
Spectral Computed Tomography Regulatory Landscape
Regulatory Landscape - Overview
Spectral Computed Tomography Regulatory Landscape: Product Overview
Spectral computed tomography, also known as dual energy CT (DECT) or multi energy CT, advanced imaging technique that acquire CT data at two or more energy levels to analyses how different tissues and materials attenuate X-rays depending on photon energy. Which helps in material decomposition, virtual monochromatic imaging, and improved tissue characterization, which is usually not possible with conventional single energy CT.
Spectral Computed Tomography Applications
Spectral CT is a type of CT scan that not only shows anatomical details but also helps detect specific materials. It improves image quality, reduces radiation and contrast media doses, and lessens the need for follow-up scans.
VNC images (Virtual Non-Contrast) are created by removing all contrast-enhanced structures from the image. This helps reduce overall radiation exposure by decreasing the number of scans needed.
In the liver, spectral CT is great for locating hypervascular lesions (like certain tumors) more clearly using low-energy images during the arterial phase. This helps in detecting more lesions with better confidence.
For pancreatic adenocarcinoma, which is hard to see on regular CT scans, low-energy spectral images and iodine quantification improve detection and evaluation of arterial involvement.
Incidental renal lesions are common in about 10% of CT scans. It's often hard to tell if these are benign or malignant on a single-phase contrast-enhanced study. Spectral CT can accurately evaluate these lesions, reducing the need for follow-up studies. It differentiates non-enhancing from enhancing lesions using VNC reconstructions, iodine maps, and spectral attenuation curves, making it easier to diagnose certain types of renal cell carcinoma.
Mono-energetic images at high and low keV are particularly useful for better visualization of enhancing structures, reducing contrast media volume, and decreasing metal artifacts. While VNC and z-effective evaluation of specific materials are promising, they need further improvement before being widely adopted.
Spectral Computed Tomography Development steps.
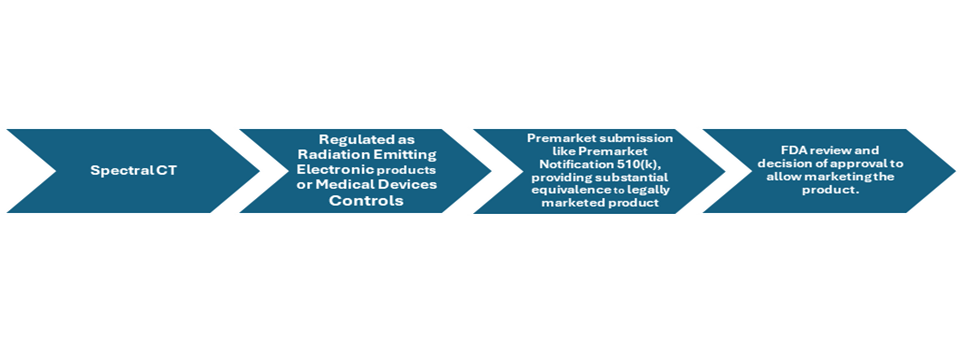
Figure: overview of product development and approval process of Spectral Computed Tomography
Spectral Computed Tomography Market Size Overview
Spectral Computed Tomography Market Size was valued at USD 8.0 Billion in 2023. The Global Spectral Computed Tomography industry is projected to grow from USD 8.8 Billion in 2024 to USD 17.2 Billion by 2032, exhibiting a compound annual growth rate (CAGR) of 8.00% during the forecast period (2024 - 2032).
Spectral Computed Tomography Regulatory Landscape:
There are several key regulatory agencies who oversee the approval and monitoring of Spectral Computed Tomography to ensure their safety, efficacy, and quality.
|
Regulatory agencies |
Regulatory Ministry |
|
Federal Food and Drug Administration |
United States: Department of Health and Human Services (HHS) |
|
The Medicines and Healthcare products Regulatory Agency |
United Kingdom: The Medicines and Healthcare products Regulatory Agency (MHRA) under the Department of Health and Social Care (DHSC) |
|
Central Drug Standard Control Organization |
India: The Ministry of Health and Family Welfare |
|
South African Health Products Regulatory Authority (SAHPRA) |
National Department of Health. |
|
Pharmaceuticals and Medical Devices Agency (PMDA) |
Japan: Ministry of Health, Labour and Welfare. |
|
National Medical Products Administration (NMPA) |
China: The Ministry of Health |
|
Health Sciences Authority |
Singapore: The Ministry of Health |
|
European Medicine Agency |
European union |
|
Brazilian Health Regulatory Agency (Anvisa) |
Ministry of Health, part of the Brazilian National Health System (SUS) |
Spectral Computed Tomography Guidelines:
Spectral CT versatile imaging technique with applications across various medical fields, eligibility to involve this in any treatment depends on clinical indication and few patients’ specific factors, it is essential to consult with healthcare providers to assess suitability based on individual health status and diagnostic needs. In cancer care spectral CT can assess tumor vascularity and monitor treatment response such as metastatic renal cell carcinoma. It has a role in diagnosis, characterization and treatment for conditions like Gout and bone marrow, especially as an alternative to MRI studies which are costly and time consuming.
Spectral Computed Tomography Classification of the Product:
Spectral Computed Tomography Regulatory Process Overview, By Country:
Food and drug administration (FDAs) has a Center for devices and radiological health (CDRH) which is responsible for the regulation of all the medical devices and therapeutics or devices involving radiation emitting materials including spectral CT. Computed tomography system is regulated by US FDA in two categories, it is regulated as radiation-emitting electronic products under the Radiation Control for Health and Safety Act and as medical devices under the Medical Device Amendments to the Food, Drug, and Cosmetic Act.
Radiation emitting electronic products are regulated under the Division of Radiological Imaging Devices and Electronic Products (DHT8B), which is responsible for regulation of diagnostic X-ray systems, radiation-emitting electronic products, and radiological imaging software products to ensure its safety, quality and efficacy.
Furthermore, FDA has Division of Radiological Imaging and Radiation Therapy Devices (DHT8C), which is responsible for regulation of mammography, ultrasound, magnetic resonance, nuclear medicine, and radiation therapy devices.
Additionally, the Nuclear Regulatory Commission (NRC), it is a federal agency in the US, responsible for regulating the safe usage and disposal of radioactive materials.
Under the Radiation Control for Health and Safety Act, the FDA administers an equipment performance standard for diagnostic X-ray systems, including CT imaging systems. This standard:
- Sets minimum radiation safety requirements for CT systems.
- Requires that manufacturers ensure their CT imaging systems comply with these radiation safety requirements.
- Requires manufacturers to certify that their products meet the established standard.
For CT systems, the standard primarily focuses on requirements for labeling and providing product performance information. It does not set patient radiation dose limits or address the imaging performance or efficacy of CT systems.
Medical Device Controls
Medical devices are categorized into three classes as class I (low risk), class II (moderate risk) and class III (high risk, usually are life sustaining devices), based on their risk and the necessary controls to ensure their safety and effectiveness. CT imaging systems fall under Class II medical devices, which means they must adhere to:
- Manufacturer registration and listing.
- Premarket notification to the FDA by the manufacturer.
- Compliance with good manufacturing practices (quality system) regulations.
- General and special controls.
Manufacturers of CT imaging systems are required to submit premarket notifications, known as 510(k)s, to the FDA. These notifications must demonstrate that each new CT system is "substantially equivalent" in terms of characteristics, performance, and safety to CT systems that were previously cleared or already on the market before the 1976 Medical Device Amendments.
Spectral Computed Tomography updates
November 2024, The Spectral CT 7500 RT system, developed by Philips, has received FDA 510(k) clearance for use in radiation oncology. This system integrates 4D conventional computed tomography (CT) with spectral CT, enhancing tissue characterization and precision in radiotherapy. Key features include automated stopping-power ratio (SPR) mapping and direct electron density measurement, which improve the accuracy of radiotherapy dosing. The system is also the first radiation therapy CT platform to offer respiratory-gated spectral imaging, reducing uncertainties in treatment planning.
Spectral Computed Tomography Regulatory Challenges and possible risk in development:
Complying with strict regulation of FDA is challenging, premarket submission should include all the details of the device giving all the safety and efficacy details of the product and also providing substantial equivalence to the one of the already leally marketed products is must to meet the requirements of approval and allowing manufacturers to market the product.
Varying complex Regulatory Frameworks of Different countries, pose manufacturing challenge for the company at an international level. Compliance with diverse regulatory requirements requires a complete understanding of each region's specific guidelines.
Technological complexity and reliability risk, since it involves integration of dual energy sources, detectors and advanced algorithms, it will always introduce risk of hardware or software malfunctions, which can be dangerous for the patient taking the treatment, and this will lead to product recall.
High research and development costs can further strain the budget and create the next huge challenge for companies to overcome and develop the product and get it approved by regulatory body like FDA and launch it in the market. If the product involves complex techniques to use, then adoption by the clinicians can be slow.
Spectral Computed Tomography Competitive Landscape Dashboard:
Companies With Marketed Spectral Computed Tomography:
- General Electric Company (US)
- Koninklijke Philips N.V. (Amsterdam, Netherlands)
- MARS Bioimaging Ltd (Christchurch, New Zealand)
- Neusoft Corporation (China)
- Shenzhen Anke High-tech Co., Ltd (China)
- Siemens (UK)
- PerkinElmer Inc. (Waltham, Massachusetts)
Regulatory Landscape - Table of Content
Table of contents will appear here once available.
Customer Stories

“This is really good guys. Excellent work on a tight deadline. I will continue to use you going forward and recommend you to others. Nice job”

“Thanks. It’s been a pleasure working with you, please use me as reference with any other Intel employees.”

“Thanks for sending the report it gives us a good global view of the Betaïne market.”

“Thank you, this will be very helpful for OQS.”

“We found the report very insightful! we found your research firm very helpful. I'm sending this email to secure our future business.”

“I am very pleased with how market segments have been defined in a relevant way for my purposes (such as "Portable Freezers & refrigerators" and "last-mile"). In general the report is well structured. Thanks very much for your efforts.”

“I have been reading the first document or the study, ,the Global HVAC and FP market report 2021 till 2026. Must say, good info! I have not gone in depth at all parts, but got a good indication of the data inside!”

“We got the report in time, we really thank you for your support in this process. I also thank to all of your team as they did a great job.”