• Cat-intel
  • MedIntelliX
  • Resources
  • About Us
  • Request Free Sample ×

    Kindly complete the form below to receive a free sample of this Report

    Leading companies partner with us for data-driven Insights

    clients tt-cursor

    Submarine Power Cable Market

    ID: MRFR/E&P/4981-CR
    117 Pages
    Anshula Mandaokar
    June 2021

    Submarine Power Cable Market Research Report Information By Type (AC, DC), By Core Type (Single Core, Multi-Core), By Insulation Type (Cross-Linked Polyethylene (XLPE), Ethylene Propylene Rubber (EPR)), By Voltage (Up to 66 KV, 66 KV-220 KV, Above 220 KV), By Conductor Material (Copper, Aluminum), By End-Use (Offshore Wind Power Generation, Offshore Oil & Gas, Island Connection, Wave & Tidal Power Generation) And By Region (North America, Europe, Asia-Pacific, And Rest Of The World) – Market Forecast Till 2032

    Share:
    Download PDF ×

    We do not share your information with anyone. However, we may send you emails based on your report interest from time to time. You may contact us at any time to opt-out.

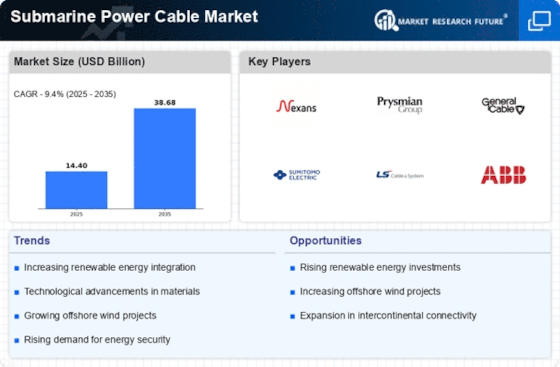
    Submarine Power Cable Market Research Report—Global Forecast till 2032 Infographic
    Purchase Options
    $ 4,950.0
    $ 5,950.0
    $ 7,250.0
    Table of Contents

    Submarine Power Cable Market Summary

    As per Market Research Future Analysis, the Submarine Power Cable Market was valued at USD 10.7 billion in 2021 and is projected to grow from USD 12.03 billion in 2022 to USD 31.55 billion by 2032, with a CAGR of 9.4% from 2022 to 2030. Key drivers include the increasing number of offshore wind farms, rising demand for inter-country and island power connections, and offshore oil and gas operations. The market is dominated by multi-core cables, which accounted for approximately 75-78% of revenue in 2021. The insulation type EPR led the market due to its superior properties, while aluminum was the preferred conductor material. Europe holds the largest market share at 43.10%, driven by offshore projects.

    Key Market Trends & Highlights

    The Submarine Power Cable Market is witnessing significant growth driven by renewable energy initiatives and technological advancements.

    • Market Size in 2021: USD 10.7 billion; projected to reach USD 31.55 billion by 2032.
    • CAGR from 2022 to 2030: 9.4%; driven by offshore wind farms and energy demand.
    • Europe holds 43.10% market share; major growth in offshore wind and oil & gas projects.
    • Multi-core cables accounted for 75-78% of market revenue in 2021.

    Market Size & Forecast

    2021 Market Size USD 10.7 Billion
    2022 Market Size USD 12.03 Billion
    2032 Market Size USD 31.55 Billion
    CAGR 9.4% (2023-2032)

    Major Players

    Key players include Prysmian Group, NKT A/S, Nexans SA, Sumitomo Electric Industries Limited, and ABB Ltd.

    Submarine Power Cable Market Trends

      • Increasing number of offshore wind farms boost the market growth

    Global energy demand has been increasing gradually, and it is anticipated that this trend will continue to fuel the market for submarine power cables. The main factors driving the increase in power demand worldwide are rising income, greater access to electricity, and urbanization. In 2019, the world's energy demand increased by 2.3% compared to 2018, mostly as a result of rising heating and cooling demands. To cut carbon emissions and encourage sustainable growth worldwide, energy producing businesses have been concentrating on the production of renewable energy.

    Submarine communication cables carry approximately 90% of global data traffic. Their total carrying capacity is measured in terabytes per second as well. As a result, OTT and communication service providers such as Google, Amazon, Facebook, and Microsoft place a premium on these connections. For example, in October 2021, the Japanese IT conglomerate NEC announced plans to build a large submarine cable with 4 crore fibre optics for Facebook. The submarine will have 24 fibre pairs with a maximum bandwidth of 500 maps.

    Most countries have laws in place to protect underwater cables from harm because they are an important part of their economies. For example, the Australian Communication and Media Authority (ACMA) has established safety zones to prevent activities that could disrupt the cables that connect Australia and the rest of the world. It also legalises new submarine cable installations.

    Submarine power cable industry are used for the electricity transmission over vast distances with reduced power losses. Authorities in numerous nations intend to guarantee energy security in both islands and other nations. For delivering high power from the generation facilities located beneath the water bodies to such locations, submarine power cables are preferred. However, one of the main problems for the operators in creating islands and combined power connections is geopolitical and geological instability caused by the influence of numerous geographic and political factors.

    The ongoing transition towards renewable energy sources is driving an unprecedented demand for submarine power cables, which are essential for connecting offshore wind farms to the grid and facilitating energy transfer across vast distances.

    U.S. Department of Energy

    Submarine Power Cable Market Drivers

    Market Growth Projections

    The Global Submarine Power Cable Market Industry is projected to experience substantial growth over the coming years. With an estimated market value of 14.2 USD Billion in 2024, the industry is expected to expand significantly, reaching approximately 41.3 USD Billion by 2035. This growth trajectory indicates a robust compound annual growth rate (CAGR) of 10.16% from 2025 to 2035. Such projections reflect the increasing investments in renewable energy projects, advancements in cable technology, and the growing need for interconnectivity between power grids. The market's expansion is indicative of the critical role submarine cables play in the global energy landscape.

    Government Policies and Incentives

    Supportive government policies and incentives are playing a crucial role in shaping the Global Submarine Power Cable Market Industry. Many governments are implementing regulatory frameworks that promote the development of submarine cable infrastructure, particularly in the context of renewable energy projects. For instance, subsidies and tax incentives for offshore wind projects encourage investments in submarine cables necessary for energy transmission. Additionally, international agreements aimed at reducing carbon emissions further bolster the demand for renewable energy solutions, including submarine cables. Such policies are likely to contribute to the market's growth trajectory, reinforcing the industry's importance in achieving energy transition goals.

    Growing Demand for Renewable Energy

    The Global Submarine Power Cable Market Industry is experiencing a notable surge in demand driven by the increasing shift towards renewable energy sources. Governments worldwide are investing heavily in offshore wind farms and solar energy projects, which necessitate robust submarine cable infrastructure for efficient energy transmission. For instance, the European Union has set ambitious targets for renewable energy, aiming for a significant portion of its energy mix to come from offshore wind by 2030. This transition is projected to contribute to the market's growth, with the industry expected to reach 14.2 USD Billion in 2024 and potentially 41.3 USD Billion by 2035.

    Rising Energy Demand in Emerging Economies

    The Global Submarine Power Cable Market Industry is significantly influenced by the rising energy demand in emerging economies. Countries in Asia and Africa are experiencing rapid urbanization and industrialization, leading to increased electricity consumption. This surge in demand necessitates the development of robust energy infrastructure, including submarine cables for efficient energy transmission from remote generation sites to urban centers. For example, nations like India and Nigeria are investing in submarine cable projects to enhance their energy distribution networks. As these economies continue to grow, the demand for submarine power cables is expected to rise, further propelling market expansion.

    Increasing Interconnectivity Between Regions

    The Global Submarine Power Cable Market Industry is witnessing a rise in interconnectivity initiatives aimed at enhancing energy security and reliability. Countries are increasingly investing in submarine cables to connect their power grids, facilitating energy trade and improving grid stability. For example, projects like the North Sea Wind Power Hub aim to interconnect multiple countries through a network of submarine cables, allowing for efficient energy distribution across borders. This trend not only supports renewable energy integration but also enhances energy resilience, thereby driving market growth. As interconnectivity expands, the demand for submarine cables is expected to rise significantly.

    Technological Advancements in Cable Manufacturing

    Technological innovations in the manufacturing of submarine power cables are significantly enhancing the capabilities and efficiency of the Global Submarine Power Cable Market Industry. Advances in materials science, such as the development of high-performance insulation and conductor materials, enable cables to operate at higher voltages and longer distances. This is particularly relevant for intercontinental connections, where efficiency is paramount. Furthermore, the introduction of advanced installation techniques, including remotely operated vehicles, reduces installation time and costs. As these technologies evolve, they are likely to drive market growth, aligning with the projected CAGR of 10.16% from 2025 to 2035.

    Market Segment Insights

    Submarine Power Cable Type Insights

    The Submarine Power Cable Market segmentation, based on type, includes Single Core, Multi-Core. The Multi-Core submarine power cable segment held the majority share in 2021 contribution to around ~75-78% in respect to the Submarine Power Cable Market revenue. A multi core cable has numerous cores and can be used for a wide range of purposes, particularly ones that demand for a lot of cables. With advantages for the cable system's cost-per-bit, multicore cables' number of cores is growing without the cable's diameter.

    Submarine Power Cable Insulation Type Insights

    The Submarine Power Cable Market segmentation, based on insulation type, includes Cross-linked polyethylene (XLPE), ethylene propylene rubber (EPR). The ethylene propylene rubber (EPR) segment dominated the market in 2021. This is owing to its properties such as high electrical properties, flexibility, easier in install, and low thermal expansion. For improved physical qualities, EPR cables are occasionally combined with polypropylene or polyethylene. The production of ethylene propylene rubber insulated cables has been a focus for companies.

    With an increase in the installation of EPR insulated cables in the oil and gas, submarine, and power generation industries, this segment is anticipated to grow gradually during the projected period.

    Submarine Power Cable Conductor Material Insights

    The Submarine Power Cable Market data has been bifurcated by Conductor Material into Copper, and Aluminum. The Aluminum segment dominated the market in 2021. The soft, nonmagnetic, ductile, and light aluminum is one of the most common metallic elements in the Earth's crust. Aluminum is less expensive and lighter than copper and is a strong conductor of heat and electricity. It is one of the materials used most frequently to build undersea power cables. The need for aluminum as a conductor in underwater power lines rises as a result.

    NKT A/S, Prysmian Group, and Nexans are a few of the leading companies in this market area for submarine power cables.

    Figure 2 Submarine Power Cable Market, by Conductor Material, 2021 & 2032 (USD Billion)

    Source Secondary Research, Primary Research, Market Research Future Database and Analyst Review

    Get more detailed insights about Submarine Power Cable Market Research Report—Global Forecast till 2032

    Regional Insights

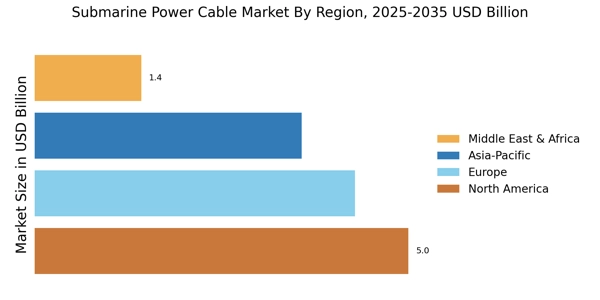
    By Region, the study provides the market insights into North America, Europe, Asia-Pacific and Rest of the World. Europe Submarine Power Cable market dominate the global market the Europe market hold 43.10% market share globally. This is attributed to the growing offshore Wind Power Generation, and Offshore Oil & Gas projects in the region.

    Further, the major countries studied in the market report are The U.S, Canada, Germany, France, UK, Italy, Spain, China, Japan, India, Australia, South Korea, and Brazil.

    Figure 3 Submarine Power Cable Market Share By Region 2021 (%)

    Submarine Power Cable Market SHARE BY REGION 2021

    Source Secondary Research, Primary Research, Market Research Future Database and Analyst Review

    North America submarine power cable market is growing significantly rate and it is driven by rising energy demand from developing nations and continuous progress toward a reliable transmission network. The regional industrial dynamics will be further pushed by strict standards for effective power transmission and rising cross-border electricity trading. Further, the United States submarine power cable market held the largest market share, and fastest growing market in the North America region

    The Asia-Pacific Submarine Power Cable Market is expected to grow at the fastest CAGR from 2022 to 2030. The acceptance and deployment of wind farms are at their highest levels in this area, with China leading the pack. China had 4.6GW1 of active offshore wind generating capacity in 2018, according to IEEFA. A total of 4.5GW of offshore wind power was added globally in 2018, although only 1.8GW of that was deployed in the country.

    A total of 24 offshore wind power projects with a combined capacity of 6.7GW and an investment boost of USD 18 billion were approved by China in January 2019 off the coast of Jiangsu Province. These offshore wind projects are supported by some of China's biggest companies, including China General Nuclear Power Corp., China Energy Group, China Huaneng Group, and the State Power Investment Corp. Moreover, China submarine power cable market held the largest market share, and the India submarine power cable market was the fastest growing market in the Asia-Pacific region

    Key Players and Competitive Insights

    Major market players are spending a lot of money on R&D to increase their product lines, which will help the submarine power cable market grow even more. Market participants are also taking a range of strategic initiatives to grow their worldwide footprint, with key market developments such as new product launches, contractual agreements, mergers and acquisitions, increased investments, and collaboration with other organizations. Competitors in the submarine power cable industry must offer cost-effective items to expand and survive in an increasingly competitive and rising market environment.

    One of the primary business strategies adopted by manufacturers in the global submarine power cable industry to benefit customers and expand the market sector is to manufacture locally to reduce operating costs. In recent years, submarine power cable industry has provided submarine power cable with some of the most significant benefits. The submarine power cable market major player such as Nexans SA, Prysmian Group and others are working to expand the market demand by investing in research and development activities.

    Feb. 2020, Nexans was awarded the contract to to provide the HV submarine power cables for the Marjan gas and oil field project located on the eastern coast of the Arabian Gulf.

    Also, In order to design and instal a three-core submarine and land power cable system with XLPE insulation between the islands of Playa Blanca in Lanzarote and La Oliva in the island of Fuerteventura, Prysmian Group entered into a contract with Red Eléctrica de Espaa, a Spanish transmission system operator in Dec. 2019.

    Key Companies in the Submarine Power Cable Market market include

    Industry Developments

    Jan. 2020 PT. PLN (Indonesia) has given Furukawa Electric Co., Ltd. a contract to provide engineering, procurement, and construction services for the construction of the 150kV underwater cable Sumatera-Bangka. The business would be able to grow its cable operations in Indonesia as a result.

    Feb. 2022 A Memorandum of Understanding was signed by the independent cable construction and operator Inligo Networks and Indonesian telecommunications company Indostat Ooredoo Hutchison to develop an 18,000 km submarine cable connecting Indonesia, Singapore, Australia, Japan, and the United States.

    In May 2023 Sumitomo Electric announces its plans to establish a new power cable factory in UK for supporting the goal of UK government of achieving Net zero 2050. Sumitomo Electric announced on 27th April 2023 to establish a new Power Cable factory in the Scottish Highlands, UK to support UK Government’s goal to achieve Net zero 2050.

    December 2023- Prysmian Group, a leading Cables manufacturer, has attained a €630m ($674.81m) order from Italian transmission system operator Terna's subsidiary for its Adriatic Link project, a 1GW submarine interconnection project in the Adriatic Sea. Prysmian will propose, supply, deploy, and commission the submarine interconnection, which can transfer 1GW of energy between Italy's central-southern and central-northern areas. The high-voltage direct current bipolar cable line will expand for 250km and is anticipated to enhance the safety and strength of the country's electricity transmission grid. Total financing for the project is predicted to be €1.3 billion.

    Terna international development director Giacomo Donnini stated that the Adriatic Link retains deliberate significance for the incorporation of renewable sources, therefore contributing to the decarbonization of the Italian energy system.

    In April 2023, Sumitomo Electric Industries, Ltd. announced plans to establish a new Power Cable factory (high voltage cable manufacturing plant) in the Scottish Highlands to support the UK Government's goal to achieve Net zero in 2050.

    In April 2023, Nexans successfully finalized the acquisition of Reka kaapeli oy, a leading Finnish manufacturer of high, medium, and low voltage cables, as part of its strategy to become a key player in electrification and contribute to carbon neutrality by 2030.

    In April 2020, Prysmian Group completed the brand integration process after acquiring General Cable. The company introduced a multi-brand strategy and updated its visual identity and logos.

    In October 2021, the Japanese IT conglomerate NEC announced plans to build a large submarine cable with 4 crore fiber optics for Facebook. The submarine will have 24 fiber pairs with a maximum bandwidth of 500 maps. Most countries have laws in place to protect underwater cables from harm because they are an important part of their economies. For example, the Australian Communication and Media Authority (ACMA) has established safety zones to prevent activities that could disrupt the cables that connect Australia and the rest of the world. It also legalizes new submarine cable installations.

    In 2018, Europe's new offshore wind farm investments totaled EUR 10.3 billion, representing almost 24% of the total new power investments and a 37% increase from the 2017 levels. The United Kingdom financed USD 5.9 billion of wind investments in total, representing 22% of total financing activity for the construction of new onshore and offshore wind farms.

    In 2023, UK businesses, led by BAE Systems, Rolls-Royce, and Babcock, secured USD 4.28 billion in contracts for the Detailed Design and Long Leads (D2L2) Phase, marking a milestone in the AUKUS program. The contracts will advance the design, prototyping, and procurement of main long-lead components for the first UK submarines, supporting thousands of skilled jobs and bolstering the domestic supply chain. The submarines, known as SSN-AUKUS, will replace the Astute-Class vessels and be the largest, most advanced attack submarines ever operated by the Royal Navy.

    Construction will primarily occur in Barrow-in-Furness, with the aim of service entry in the late 2030s.

    Future Outlook

    Submarine Power Cable Market Future Outlook

    The Global Submarine Power Cable Market is projected to grow at a 10.16% CAGR from 2024 to 2035, driven by renewable energy expansion, technological advancements, and increasing offshore wind projects.

    New opportunities lie in:

    • Invest in R&D for high-capacity cables to enhance efficiency and reduce costs.
    • Develop strategic partnerships with renewable energy firms for integrated solutions.
    • Expand into emerging markets with underdeveloped offshore infrastructure to capture new opportunities.

    By 2035, the market is expected to be robust, reflecting substantial growth and innovation.

    Market Segmentation

    Submarine Power Cable Type Outlook

    • AC
    • DC

    Submarine Power Cable End Use Outlook

    • Offshore Wind Power Generation
    • Offshore Oil & Gas
    • Island Connection
    • Wave & Tidal Power Generation

    Submarine Power Cable Voltage Outlook

    • Up to 66 KV
    • 66 KV-220 KV
    • Above 220 KV

    Submarine Power Cable Regional Outlook

    North America
    • US
    • Canada

    Submarine Power Cable Core Type Outlook

    • Single Core
    • Multi-Core

    Submarine Power Cable Insulation Type Outlook

    • Cross-Linked Polyethylene (XLPE)
    • Ethylene Propylene Rubber (EPR)

    Submarine Power Cable Conductor Material Outlook

    • Copper
    • Aluminum

    Report Scope

    Report Attribute/Metric Details
    Market Size 2021 USD 10.70 billion
    Market Size 2022 USD 12.03 billion
    Market Size 2032 USD 31.55 billion
    Compound Annual Growth Rate (CAGR) 9.4% (2023-2032)
    Base Year 2022
    Market Forecast Period 2023-2032
    Historical Data 2019 & 2021
    Market Forecast Units Value (USD Billion)
    Report Coverage Revenue Forecast, Market Competitive Landscape, Growth Factors, and Trends
    Segments Covered Type, Insulation Type, Voltage, Conductor Material, End Use, and Region
    Geographies Covered North America, Europe, Asia Pacific, and Rest of the World
    Countries Covered The U.S, Canada, Germany, France, UK, Italy, Spain, China, Japan, India, Australia, South Korea, and Brazil
    Key Companies Profiled Nexans SA, Prysmian Group and others
    Key Market Opportunities Growing number of offshore wind farms
    Key Market Dynamics Rising demand for inter-country & island power connections Increasing demand from offshore oil & gas operations

    Market Highlights

    Author
    Anshula Mandaokar
    Team Lead - Research

    Anshula Mandaokar holds an academic degree in Chemical Engineering and has been contributing to the field for more than 5 years. She has expertise in Market Research and Business Consulting and serves as a Team Lead for a reputed Market Research firm under the Chemicals and Materials domain spectrum. She has worked on multiple projects, generating explicit results in a quick turnaround time. Her understanding of data interpretation justifies her role as a leader.

    Leave a Comment

    FAQs

    How much is the Submarine Power Cable market?

    The Submarine Power Cable Market size was valued at USD 10.70 Billion in 2021.

    What is the growth rate of the Submarine Power Cable market?

    The global market is projected to grow at a CAGR of 9.4% during the forecast period, 2022-2030.

    Which region held the largest market share in the Submarine Power Cable market?

    Europe had the largest share in the global market

    Who are the key players in the Submarine Power Cable market?

    The key players in the market are Nexans SA, Prysmian Group and others.

    Which type led the Submarine Power Cable market?

    The multi-core category dominated the market in 2021.

    Which conductor material had the largest market share in the Submarine Power Cable market?

    The aluminium had the largest share in the global market.

    1. EXECUTIVE SUMMARY
      1. GLOBAL SUBMARINE POWER
    2. CABLE MARKET, BY TYPE
      1. GLOBAL SUBMARINE POWER CABLE MARKET, BY INSULATION
    3. TYPE
      1. GLOBAL SUBMARINE POWER CABLE MARKET, BY VOLTAGE
        1. GLOBAL
    4. SUBMARINE POWER CABLE MARKET, BY CONDUCTOR MATERIAL
      1. GLOBAL SUBMARINE
    5. POWER CABLE MARKET, BY END-USE
      1. GLOBAL SUBMARINE POWER CABLE MARKET, BY
    6. REGION
    7. MARKET INTRODUCTION
      1. DEFINITION
      2. SCOPE OF THE STUDY
      3. RESEARCH OBJECTIVE
      4. MARKET STRUCTURE
    8. RESEARCH METHODOLOGY
      1. RESEARCH PROCESS
      2. PRIMARY RESEARCH
      3. SECONDARY RESEARCH
      4. MARKET SIZE ESTIMATION
      5. FORECAST MODEL
      6. LIST OF ASSUMPTIONS
    9. MARKET DYNAMICS
      1. INTRODUCTION
      2. DRIVERS
        1. RISING NUMBER
    10. OF OFFSHORE WIND FARMS
      1. INCREASING DEMAND IN OFFSHORE OIL & GAS OPERATIONS
      2. RESTRAINTS
        1. HIGH INSTALLATION COST AND REPAIRING COMPLEXITY
    11. OPPORTUNITIES
      1. GROWING DEMAND FOR INTERCOUNTRY AND ISLAND POWER CONNECTIONS
      2. IMPACT ANALYSIS OF COVID-19
        1. IMPACT ON OVERALL POWER INDUSTRY
        2. IMPACT ON THE SUBMARINE CABLE MARKET
    12. IMPACT ON SUPPLY CHAIN OF SUBMARINE CABLE MARKET
      1. PRICE VARIATION OF
    13. KEY RAW MATERIALS
      1. PRODUCTION SHUTDOWN
        1. CASH FLOW CONSTRAINTS
        2. IMPACT ON THE MARKET DEMAND FOR SUBMARINE
    14. CABLE
      1. IMPACT DUE TO LOCKDOWN
        1. CONSUMER SENTIMENTS
    15. IMPACT ON PRICING OF SUBMARINE CABLE
    16. MARKET FACTOR ANALYSIS
      1. SUPPLY
    17. CHAIN ANALYSIS
      1. DESIGN & DEVELOPMENT
        1. RAW MATERIAL &
    18. COMPONENT SUPPLY
      1. MANUFACTURE & ASSEMBLY
        1. DISTRIBUTION
        2. END USE
      2. PORTER’S FIVE FORCES MODEL
        1. THREAT OF NEW
    19. ENTRANTS
      1. BARGAINING POWER OF SUPPLIERS
        1. BARGAINING POWER OF
    20. BUYERS
      1. THREAT OF SUBSTITUTES
        1. RIVALRY
    21. GLOBAL SUBMARINE
    22. POWER CABLE MARKET, BY TYPE
      1. OVERVIEW
      2. SINGLE CORE
      3. MULTI
    23. CORE
    24. GLOBAL SUBMARINE POWER CABLE MARKET, BY INSULATION TYPE
      1. OVERVIEW
      2. CROSS-LINKED POLYETHYLENE (XLPE)
      3. ETHYLENE PROPYLENE RUBBER (EPR)
    25. GLOBAL SUBMARINE POWER CABLE MARKET, BY VOLTAGE
      1. OVERVIEW
      2. UP
    26. TO 66 KV
      1. 66 KV – 220 KV
      2. ABOVE 220 KV
    27. GLOBAL SUBMARINE
    28. POWER CABLE MARKET, BY CONDUCTOR MATERIAL
      1. OVERVIEW
      2. COPPER
    29. ALUMINUM
    30. GLOBAL SUBMARINE POWER CABLE MARKET, BY END-USE
      1. OVERVIEW
      2. OFFSHORE WIND POWER GENERATION
      3. OFFSHORE OIL & GAS
    31. ISLAND CONNECTION
      1. WAVE AND TIDAL POWER GENERATION
    32. GLOBAL SUBMARINE
    33. POWER CABLE MARKET, BY REGION
      1. OVERVIEW
      2. NORTH AMERICA
    34. US
      1. CANADA
        1. MEXICO
      2. ASIA-PACIFIC
        1. CHINA
        2. JAPAN
        3. MALAYSIA
        4. INDONESIA
        5. REST OF ASIA-PACIFIC
      3. EUROPE
        1. GERMANY
        2. UK
        3. NORWAY
    35. DENMARK
      1. THE NETHERLANDS
        1. REST OF EUROPE
      2. MIDDLE
    36. EAST & AFRICA
      1. SAUDI ARABIA
        1. UAE
        2. ANGOLA
        3. REST OF MIDDLE EAST & AFRICA
      2. SOUTH AMERICA
        1. BRAZIL
        2. ARGENTINA
        3. REST OF SOUTH AMERICA
    37. COMPETITIVE LANDSCAPE
      1. COMPETITIVE OVERVIEW
      2. COMPETITIVE BENCHMARKING
      3. MARKET
    38. SHARE ANALYSIS
    39. COMPANY PROFILES
      1. PRYSMIAN GROUP
        1. COMPANY
    40. OVERVIEW
      1. FINANCIAL OVERVIEW
        1. PRODUCTS OFFERED
    41. KEY DEVELOPMENTS
      1. SWOT ANALYSIS
        1. KEY STRATEGIES
    42. NEXANS
      1. COMPANY OVERVIEW
        1. FINANCIAL OVERVIEW
        2. PRODUCTS
    43. OFFERED
      1. KEY DEVELOPMENTS
        1. SWOT ANALYSIS
        2. KEY STRATEGIES
      2. NKT A/S
        1. COMPANY OVERVIEW
        2. FINANCIAL OVERVIEW
    44. PRODUCTS OFFERED
      1. KEY DEVELOPMENTS
        1. SWOT ANALYSIS
    45. KEY STRATEGIES
      1. FURUKAWA ELECTRIC CO., LTD.
        1. COMPANY OVERVIEW
        2. FINANCIAL OVERVIEW
        3. PRODUCTS OFFERED
        4. KEY DEVELOPMENTS
        5. SWOT ANALYSIS
        6. KEY STRATEGIES
      2. LS CABLE & SYSTEM
    46. LTD
      1. COMPANY OVERVIEW
        1. FINANCIAL OVERVIEW
        2. PRODUCTS
    47. OFFERED
      1. KEY DEVELOPMENTS
        1. SWOT ANALYSIS
        2. KEY STRATEGIES
      2. SUMITOMO ELECTRIC INDUSTRIES, LTD.
        1. COMPANY OVERVIEW
    48. FINANCIAL OVERVIEW
      1. PRODUCTS OFFERED
        1. KEY DEVELOPMENTS
      2. ZTT
        1. COMPANY OVERVIEW
        2. FINANCIAL OVERVIEW
    49. PRODUCTS OFFERED
      1. KEY DEVELOPMENTS
      2. HENGTONG GROUP CO., LTD.
        1. COMPANY OVERVIEW
        2. FINANCIAL OVERVIEW
        3. PRODUCTS OFFERED
        4. KEY DEVELOPMENTS
      3. QINGDAO HANHE CABLE CO., LTD.
        1. COMPANY
    50. OVERVIEW
      1. FINANCIAL OVERVIEW
        1. PRODUCTS OFFERED
    51. KEY DEVELOPMENTS
      1. FUJITSU
        1. COMPANY OVERVIEW
        2. FINANCIAL
    52. OVERVIEW
      1. PRODUCTS OFFERED
        1. KEY DEVELOPMENTS
    53. POWER CABLE: MARKET ESTIMATES & FORECAST, BY TYPE, 2023–2032 (USD MILLION)
    54. TYPE, 2023–2032 (USD MILLION)
    55. ESTIMATES & FORECAST, BY VOLTAGE, 2023–2032 (USD MILLION)
    56. GLOBAL SUBMARINE POWER CABLE: MARKET ESTIMATES & FORECAST, BY CONDUCTOR MATERIAL,
    57. –2032 (USD MILLION)
    58. ESTIMATES & FORECAST, BY END-USE, 2023–2032 (USD MILLION)
    59. GLOBAL SUBMARINE POWER CABLE MARKET, BY REGION, 2023–2032 (USD MILLION)
    60. (USD MILLION)
    61. & FORECAST, BY TYPE, 2023–2032 (USD MILLION)
    62. SUBMARINE POWER CABLE MARKET ESTIMATES & FORECAST, BY INSULATION TYPE, 2023–2032
    63. (USD MILLION)
    64. & FORECAST, BY VOLTAGE, 2023–2032 (USD MILLION)
    65. SUBMARINE POWER CABLE MARKET ESTIMATES & FORECAST, BY CONDUCTOR MATERIAL, 2023–2032
    66. (USD MILLION)
    67. & FORECAST, BY END-USE, 2023–2032 (USD MILLION)
    68. POWER CABLE MARKET ESTIMATES & FORECAST, BY TYPE, 2023–2032 (USD MILLION)
    69. TYPE, 2023–2032 (USD MILLION)
    70. ESTIMATES & FORECAST, BY VOLTAGE, 2023–2032 (USD MILLION)
    71. US: SUBMARINE POWER CABLE MARKET ESTIMATES & FORECAST, BY CONDUCTOR MATERIAL,
    72. –2032 (USD MILLION)
    73. & FORECAST, BY END-USE, 2023–2032 (USD MILLION)
    74. SUBMARINE POWER CABLE MARKET ESTIMATES & FORECAST, BY TYPE, 2023–2032
    75. (USD MILLION)
    76. FORECAST, BY INSULATION TYPE, 2023–2032 (USD MILLION)
    77. SUBMARINE POWER CABLE MARKET ESTIMATES & FORECAST, BY VOLTAGE, 2023–2032
    78. (USD MILLION)
    79. FORECAST, BY CONDUCTOR MATERIAL, 2023–2032 (USD MILLION)
    80. SUBMARINE POWER CABLE MARKET ESTIMATES & FORECAST, BY END-USE, 2023–2032
    81. (USD MILLION)
    82. FORECAST, BY TYPE, 2023–2032 (USD MILLION)
    83. POWER CABLE MARKET ESTIMATES & FORECAST, BY INSULATION TYPE, 2023–2032
    84. (USD MILLION)
    85. FORECAST, BY VOLTAGE, 2023–2032 (USD MILLION)
    86. POWER CABLE MARKET ESTIMATES & FORECAST, BY CONDUCTOR MATERIAL, 2023–2032
    87. (USD MILLION)
    88. FORECAST, BY END-USE, 2023–2032 (USD MILLION)
    89. SUBMARINE POWER CABLE MARKET, BY COUNTRY, 2023–2032 (USD MILLION)
    90. ASIA-PACIFIC: SUBMARINE POWER CABLE MARKET ESTIMATES & FORECAST, BY TYPE,
    91. –2032 (USD MILLION)
    92. MARKET ESTIMATES & FORECAST, BY INSULATION TYPE, 2023–2032 (USD MILLION)
    93. BY VOLTAGE, 2023–2032 (USD MILLION)
    94. POWER CABLE MARKET ESTIMATES & FORECAST, BY CONDUCTOR MATERIAL, 2023–2032
    95. (USD MILLION)
    96. & FORECAST, BY END-USE, 2023–2032 (USD MILLION)
    97. POWER CABLE MARKET ESTIMATES & FORECAST, BY TYPE, 2023–2032 (USD MILLION)
    98. TYPE, 2023–2032 (USD MILLION)
    99. ESTIMATES & FORECAST, BY VOLTAGE, 2023–2032 (USD MILLION)
    100. CHINA: SUBMARINE POWER CABLE MARKET ESTIMATES & FORECAST, BY CONDUCTOR MATERIAL,
    101. –2032 (USD MILLION)
    102. ESTIMATES & FORECAST, BY END-USE, 2023–2032 (USD MILLION)
    103. JAPAN: SUBMARINE POWER CABLE MARKET ESTIMATES & FORECAST, BY TYPE, 2023–2032
    104. (USD MILLION)
    105. FORECAST, BY INSULATION TYPE, 2023–2032 (USD MILLION)
    106. SUBMARINE POWER CABLE MARKET ESTIMATES & FORECAST, BY VOLTAGE, 2023–2032
    107. (USD MILLION)
    108. FORECAST, BY CONDUCTOR MATERIAL, 2023–2032 (USD MILLION)
    109. SUBMARINE POWER CABLE MARKET ESTIMATES & FORECAST, BY END-USE, 2023–2032
    110. (USD MILLION)
    111. FORECAST, BY TYPE, 2023–2032 (USD MILLION)
    112. POWER CABLE MARKET ESTIMATES & FORECAST, BY INSULATION TYPE, 2023–2032
    113. (USD MILLION)
    114. FORECAST, BY VOLTAGE, 2023–2032 (USD MILLION)
    115. POWER CABLE MARKET ESTIMATES & FORECAST, BY CONDUCTOR MATERIAL, 2023–2032
    116. (USD MILLION)
    117. FORECAST, BY END-USE, 2023–2032 (USD MILLION)
    118. POWER CABLE MARKET ESTIMATES & FORECAST, BY TYPE, 2023–2032 (USD MILLION)
    119. INSULATION TYPE, 2023–2032 (USD MILLION)
    120. POWER CABLE MARKET ESTIMATES & FORECAST, BY VOLTAGE, 2023–2032 (USD MILLION)
    121. CONDUCTOR MATERIAL, 2023–2032 (USD MILLION)
    122. POWER CABLE MARKET ESTIMATES & FORECAST, BY END-USE, 2023–2032 (USD MILLION)
    123. BY TYPE, 2023–2032 (USD MILLION)
    124. POWER CABLE MARKET ESTIMATES & FORECAST, BY INSULATION TYPE, 2023–2032
    125. (USD MILLION)
    126. & FORECAST, BY VOLTAGE, 2023–2032 (USD MILLION)
    127. ASIA-PACIFIC: SUBMARINE POWER CABLE MARKET ESTIMATES & FORECAST, BY CONDUCTOR
    128. MATERIAL, 2023–2032 (USD MILLION)
    129. POWER CABLE MARKET ESTIMATES & FORECAST, BY END-USE, 2023–2032 (USD MILLION)
    130. MILLION)
    131. BY TYPE, 2023–2032 (USD MILLION)
    132. MARKET ESTIMATES & FORECAST, BY INSULATION TYPE, 2023–2032 (USD MILLION)
    133. –2032 (USD MILLION)
    134. ESTIMATES & FORECAST, BY CONDUCTOR MATERIAL, 2023–2032 (USD MILLION)
    135. –2032 (USD MILLION)
    136. ESTIMATES & FORECAST, BY TYPE, 2023–2032 (USD MILLION)
    137. SUBMARINE POWER CABLE MARKET ESTIMATES & FORECAST, BY INSULATION TYPE, 2023–2032
    138. (USD MILLION)
    139. FORECAST, BY VOLTAGE, 2023–2032 (USD MILLION)
    140. POWER CABLE MARKET ESTIMATES & FORECAST, BY CONDUCTOR MATERIAL, 2023–2032
    141. (USD MILLION)
    142. FORECAST, BY END-USE, 2023–2032 (USD MILLION)
    143. POWER CABLE MARKET ESTIMATES & FORECAST, BY TYPE, 2023–2032 (USD MILLION)
    144. TYPE, 2023–2032 (USD MILLION)
    145. ESTIMATES & FORECAST, BY VOLTAGE, 2023–2032 (USD MILLION)
    146. UK: SUBMARINE POWER CABLE MARKET ESTIMATES & FORECAST, BY CONDUCTOR MATERIAL,
    147. –2032 (USD MILLION)
    148. & FORECAST, BY END-USE, 2023–2032 (USD MILLION)
    149. SUBMARINE POWER CABLE MARKET ESTIMATES & FORECAST, BY TYPE, 2023–2032
    150. (USD MILLION)
    151. FORECAST, BY INSULATION TYPE, 2023–2032 (USD MILLION)
    152. SUBMARINE POWER CABLE MARKET ESTIMATES & FORECAST, BY VOLTAGE, 2023–2032
    153. (USD MILLION)
    154. FORECAST, BY CONDUCTOR MATERIAL, 2023–2032 (USD MILLION)
    155. SUBMARINE POWER CABLE MARKET ESTIMATES & FORECAST, BY END-USE, 2023–2032
    156. (USD MILLION)
    157. FORECAST, BY TYPE, 2023–2032 (USD MILLION)
    158. POWER CABLE MARKET ESTIMATES & FORECAST, BY INSULATION TYPE, 2023–2032
    159. (USD MILLION)
    160. FORECAST, BY VOLTAGE, 2023–2032 (USD MILLION)
    161. POWER CABLE MARKET ESTIMATES & FORECAST, BY CONDUCTOR MATERIAL, 2023–2032
    162. (USD MILLION)
    163. FORECAST, BY END-USE, 2023–2032 (USD MILLION)
    164. SUBMARINE POWER CABLE MARKET ESTIMATES & FORECAST, BY TYPE, 2023–2032
    165. (USD MILLION)
    166. & FORECAST, BY INSULATION TYPE, 2023–2032 (USD MILLION)
    167. THE NETHERLANDS: SUBMARINE POWER CABLE MARKET ESTIMATES & FORECAST, BY VOLTAGE,
    168. –2032 (USD MILLION)
    169. MARKET ESTIMATES & FORECAST, BY CONDUCTOR MATERIAL, 2023–2032 (USD MILLION)
    170. BY END-USE, 2023–2032 (USD MILLION)
    171. POWER CABLE MARKET ESTIMATES & FORECAST, BY TYPE, 2023–2032 (USD MILLION)
    172. BY INSULATION TYPE, 2023–2032 (USD MILLION)
    173. SUBMARINE POWER CABLE MARKET ESTIMATES & FORECAST, BY VOLTAGE, 2023–2032
    174. (USD MILLION)
    175. & FORECAST, BY CONDUCTOR MATERIAL, 2023–2032 (USD MILLION)
    176. REST OF EUROPE: SUBMARINE POWER CABLE MARKET ESTIMATES & FORECAST, BY END-USE,
    177. –2032 (USD MILLION)
    178. POWER CABLE MARKET, BY COUNTRY, 2023–2032 (USD MILLION)
    179. EAST & AFRICA: SUBMARINE POWER CABLE MARKET ESTIMATES & FORECAST, BY TYPE,
    180. –2032 (USD MILLION)
    181. POWER CABLE MARKET ESTIMATES & FORECAST, BY INSULATION TYPE, 2023–2032
    182. (USD MILLION)
    183. ESTIMATES & FORECAST, BY VOLTAGE, 2023–2032 (USD MILLION)
    184. MIDDLE EAST & AFRICA: SUBMARINE POWER CABLE MARKET ESTIMATES & FORECAST,
    185. BY CONDUCTOR MATERIAL, 2023–2032 (USD MILLION)
    186. & AFRICA: SUBMARINE POWER CABLE MARKET ESTIMATES & FORECAST, BY END USE,
    187. –2032 (USD MILLION)
    188. MARKET ESTIMATES & FORECAST, BY TYPE, 2023–2032 (USD MILLION)
    189. SAUDI ARABIA: SUBMARINE POWER CABLE MARKET ESTIMATES & FORECAST, BY INSULATION
    190. TYPE, 2023–2032 (USD MILLION)
    191. CABLE MARKET ESTIMATES & FORECAST, BY VOLTAGE, 2023–2032 (USD MILLION)
    192. BY CONDUCTOR MATERIAL, 2023–2032 (USD MILLION)
    193. SUBMARINE POWER CABLE MARKET ESTIMATES & FORECAST, BY END USE, 2023–2032
    194. (USD MILLION)
    195. BY TYPE, 2023–2032 (USD MILLION)
    196. MARKET ESTIMATES & FORECAST, BY INSULATION TYPE, 2023–2032 (USD MILLION)
    197. –2032 (USD MILLION)
    198. & FORECAST, BY CONDUCTOR MATERIAL, 2023–2032 (USD MILLION)
    199. UAE: SUBMARINE POWER CABLE MARKET ESTIMATES & FORECAST, BY END USE, 2023–2032
    200. (USD MILLION)
    201. FORECAST, BY TYPE, 2023–2032 (USD MILLION)
    202. POWER CABLE MARKET ESTIMATES & FORECAST, BY INSULATION TYPE, 2023–2032
    203. (USD MILLION)
    204. FORECAST, BY VOLTAGE, 2023–2032 (USD MILLION)
    205. POWER CABLE MARKET ESTIMATES & FORECAST, BY CONDUCTOR MATERIAL, 2023–2032
    206. (USD MILLION)
    207. FORECAST, BY END USE, 2023–2032 (USD MILLION)
    208. EAST & AFRICA: SUBMARINE POWER CABLE MARKET ESTIMATES & FORECAST, BY TYPE,
    209. –2032 (USD MILLION)
    210. POWER CABLE MARKET ESTIMATES & FORECAST, BY INSULATION TYPE, 2023–2032
    211. (USD MILLION)
    212. MARKET ESTIMATES & FORECAST, BY VOLTAGE, 2023–2032 (USD MILLION)
    213. REST OF MIDDLE EAST & AFRICA: SUBMARINE POWER CABLE MARKET ESTIMATES &
    214. FORECAST, BY CONDUCTOR MATERIAL, 2023–2032 (USD MILLION)
    215. OF MIDDLE EAST & AFRICA: SUBMARINE POWER CABLE MARKET ESTIMATES & FORECAST,
    216. BY END USE, 2023–2032 (USD MILLION)
    217. POWER CABLE MARKET, BY COUNTRY, 2023–2032 (USD MILLION)
    218. AMERICA: SUBMARINE POWER CABLE MARKET ESTIMATES & FORECAST, BY TYPE, 2023–2032
    219. (USD MILLION)
    220. & FORECAST, BY INSULATION TYPE, 2023–2032 (USD MILLION)
    221. SOUTH AMERICA: SUBMARINE POWER CABLE MARKET ESTIMATES & FORECAST, BY VOLTAGE,
    222. –2032 (USD MILLION)
    223. MARKET ESTIMATES & FORECAST, BY CONDUCTOR MATERIAL, 2023–2032 (USD MILLION)
    224. BY END USE, 2023–2032 (USD MILLION)
    225. CABLE MARKET ESTIMATES & FORECAST, BY TYPE, 2023–2032 (USD MILLION)
    226. TYPE, 2023–2032 (USD MILLION)
    227. MARKET ESTIMATES & FORECAST, BY VOLTAGE, 2023–2032 (USD MILLION)
    228. BRAZIL: SUBMARINE POWER CABLE MARKET ESTIMATES & FORECAST, BY CONDUCTOR
    229. MATERIAL, 2023–2032 (USD MILLION)
    230. MARKET ESTIMATES & FORECAST, BY END USE, 2023–2032 (USD MILLION)
    231. ARGENTINA: SUBMARINE POWER CABLE MARKET ESTIMATES & FORECAST, BY TYPE, 2023–2032
    232. (USD MILLION)
    233. FORECAST, BY INSULATION TYPE, 2023–2032 (USD MILLION)
    234. SUBMARINE POWER CABLE MARKET ESTIMATES & FORECAST, BY VOLTAGE, 2023–2032
    235. (USD MILLION)
    236. FORECAST, BY CONDUCTOR MATERIAL, 2023–2032 (USD MILLION)
    237. SUBMARINE POWER CABLE MARKET ESTIMATES & FORECAST, BY END USE, 2023–2032
    238. (USD MILLION)
    239. ESTIMATES & FORECAST, BY TYPE, 2023–2032 (USD MILLION)
    240. REST OF SOUTH AMERICA: SUBMARINE POWER CABLE MARKET ESTIMATES & FORECAST, BY
    241. INSULATION TYPE, 2023–2032 (USD MILLION)
    242. SUBMARINE POWER CABLE MARKET ESTIMATES & FORECAST, BY VOLTAGE, 2023–2032
    243. (USD MILLION)
    244. ESTIMATES & FORECAST, BY CONDUCTOR MATERIAL, 2023–2032 (USD MILLION)
    245. FORECAST, BY END USE, 2023–2032 (USD MILLION)
    246. PRODUCTS OFFERED
    247. NEXANS: PRODUCTS OFFERED
    248. NKT A/S: PRODUCTS OFFERED
    249. FURUKAWA ELECTRIC CO., LTD.: PRODUCTS OFFERED
    250. LTD.: KEY DEVELOPMENTS
    251. ELECTRIC INDUSTRIES, LTD.: PRODUCTS OFFERED
    252. LTD.: KEY DEVELOPMENTS
    253. KEY DEVELOPMENTS
    254. HENGTONG GROUP CO., LTD.: KEY DEVELOPMENTS
    255. CO., LTD.: PRODUCTS OFFERED
    256. MARKET SYNOPSIS
    257. TYPE
    258. GLOBAL SUBMARINE POWER CABLE MARKET ANALYSIS, BY CONDUCTOR MATERIAL
    259. GLOBAL SUBMARINE POWER CABLE MARKET ANALYSIS, BY END-USE
    260. SUBMARINE POWER CABLE MARKET ANALYSIS, BY REGION
    261. POWER CABLE MARKET: STRUCTURE
    262. & BOTTOM-UP APPROACHES
    263. MARKET
    264. GLOBAL SUBMARINE POWER CABLE MARKET, BY INSULATION TYPE, 2032 (% SHARE)
    265. GLOBAL SUBMARINE POWER CABLE MARKET, BY VOLTAGE, 2032 (% SHARE)
    266. GLOBAL SUBMARINE POWER CABLE MARKET, BY CONDUCTOR MATERIAL, 2032 (% SHARE)
    267. GLOBAL SUBMARINE POWER CABLE MARKET, BY END-USE, 2032 (% SHARE)
    268. GLOBAL SUBMARINE POWER CABLE MARKET, BY REGION, 2032 (% SHARE)
    269. OF MAJOR COMPETITORS
    270. GROUP: SWOT ANALYSIS
    271. NEXANS: SWOT ANALYSIS
    272. OVERVIEW SNAPSHOT
    273. LS CABLE & SYSTEM LTD.: FINANCIAL OVERVIEW SNAPSHOT
    274. & SYSTEM LTD.: SWOT ANALYSIS
    275. FINANCIAL OVERVIEW SNAPSHOT

    Submarine Power Cable Market Segmentation

    Market Segmentation Overview

    • Detailed segmentation data will be available in the full report
    • Comprehensive analysis by multiple parameters
    • Regional and country-level breakdowns
    • Market size forecasts by segment
    Submarine Power Cable Market Research Report—Global Forecast till 2032 Infographic
    Free Sample Request

    Kindly complete the form below to receive a free sample of this Report

    Customer Strories

    “I am very pleased with how market segments have been defined in a relevant way for my purposes (such as "Portable Freezers & refrigerators" and "last-mile"). In general the report is well structured. Thanks very much for your efforts.”

    Victoria Milne Founder
    Case Study

    Chemicals and Materials