• Cat-intel
  • MedIntelliX
  • Resources
  • About Us
  • Request Free Sample ×

    Kindly complete the form below to receive a free sample of this Report

    Leading companies partner with us for data-driven Insights

    clients tt-cursor

    Ride Sharing Market

    ID: MRFR/AM/5975-HCR
    135 Pages
    Swapnil Palwe
    September 2025

    Ride Sharing Market Research Report By Service Model (Peer-to-Peer, Business-to-Consumer, Business-to-Business), By Vehicle Type (Sedan, SUV, Minivan, Luxury Car), By Ride Type (Pooling, Private, Luxury), By Payment Model (Pay-as-You-Go, Subscription-based, On-Demand) and By Regional (North America, Europe, South America, Asia Pacific, Middle East and Africa) - Forecast to 2035

    Share:
    Download PDF ×

    We do not share your information with anyone. However, we may send you emails based on your report interest from time to time. You may contact us at any time to opt-out.

    Ride Sharing Market Research Report – Global Forecast till 2035 Infographic
    Purchase Options
    $ 4,950.0
    $ 5,950.0
    $ 7,250.0
    Table of Contents

    Ride Sharing Market Summary

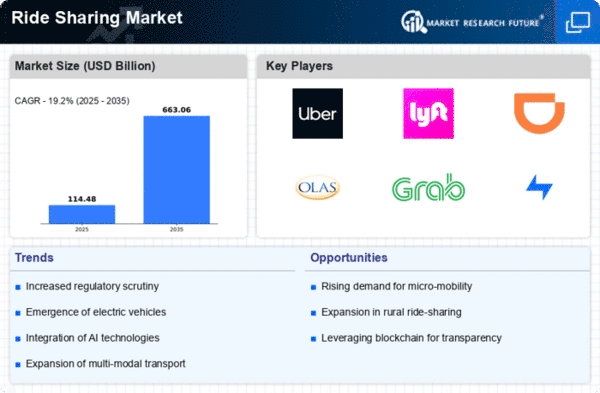
    As per Market Research Future Analysis, the global Ride Sharing Market was valued at 75.43 USD Billion in 2023 and is projected to grow to 150 USD Billion by 2035, with a CAGR of 5.89% from 2025 to 2035. The market is driven by increasing urbanization, technological advancements in mobile applications, and a shift towards environmentally friendly transportation options. Key players like Uber and Lyft are expanding their services, while emerging companies like Zeemee focus on local solutions. The market is characterized by diverse service models, vehicle types, and payment methods, catering to evolving consumer preferences.

    Key Market Trends & Highlights

    Significant trends are shaping the Ride Sharing Market, driven by consumer preferences and technological advancements.

    • Ride Sharing Market Size in 2023: 75.43 USD Billion; Expected to reach 150 USD Billion by 2035.
    • Peer-to-Peer model projected to grow from 30.0 USD Billion in 2024 to 50.0 USD Billion by 2035.
    • North America to lead the market with a valuation of 30.0 USD Billion in 2024, expected to reach 60.0 USD Billion by 2035.
    • Environmental initiatives are prompting companies like Lyft to transition to 100% electric vehicles by 2030.

    Market Size & Forecast

    2023 Market Size USD 75.43 Billion
    2024 Market Size USD 79.88 Billion
    2035 Market Size USD 150 Billion
    CAGR (2025-2035) 5.89%

    Major Players

    Uber, Zeemee, Lyft, Yandex.Taxi, Chalo, Lime, Ola, Via, Grab, Bolt, Didi Chuxing, Curb, Gojek, Careem, Gett

    Ride Sharing Market Trends

    Urbanization, changing consumer tastes, and technological progress are all major factors driving the Ride Sharing Market right now. More people are moving to cities, which has made people want more convenient ways to get about. This has led many people to switch from owning their cars to using ride-sharing services. The growing awareness of environmental issues and the necessity for long-term transportation solutions have a big impact on this change. Also, improvements in mobile technology have helped ride-sharing systems flourish, making them easier to use and more accessible to people all over the globe.

    In addition, there has been an increasing tendency in recent years to add electric cars (EVs) to ride-sharing fleets. This is in line with worldwide efforts to cut carbon emissions and promote sustainable energy. Governments all over the globe are starting to push rules that make it easier for people to utilize electric vehicles (EVs) in transportation services. This is a big chance for ride-sharing firms to attract eco-conscious customers.

    Additionally, ride-sharing services are strengthening their market position by using new technologies like artificial intelligence and big data analytics to increase safety features, optimize routes, and make the customer experience better.

    Ride-sharing platforms are still competing with each other, but there are still chances to customize services to better match the demands of customers in different areas. Companies might look for ways to better follow safety rules and regulations as they change. Ride-sharing businesses can keep doing well in this fast-changing and dynamic global economy by forming strategic alliances and expanding into regions that do not have enough of them.

    Source: Primary Research, Secondary Research, Market Research Future Database and Analyst Review

    The global ride-sharing market is poised for substantial growth as urbanization accelerates and consumers increasingly seek convenient, cost-effective transportation solutions.

    U.S. Department of Transportation

    Ride Sharing Market Drivers

    Environmental Concerns

    Growing environmental concerns are influencing the Global Ride Sharing Market Industry as consumers increasingly prioritize sustainable transportation options. Ride-sharing reduces the number of vehicles on the road, leading to lower carbon emissions and decreased traffic congestion. Many cities are implementing policies to promote shared mobility as part of their sustainability initiatives. For instance, cities like Amsterdam have embraced ride-sharing as a means to reduce their carbon footprint. This shift towards eco-friendly transportation solutions is expected to bolster market growth, aligning with global efforts to combat climate change.

    Increasing Urbanization

    The Global Ride Sharing Market Industry is experiencing a surge due to increasing urbanization. As more individuals migrate to urban areas, the demand for efficient transportation solutions rises. Urban centers often face congestion and limited parking, making ride-sharing an attractive alternative. For instance, cities like New York and Los Angeles have seen a significant uptick in ride-sharing usage as residents seek convenient mobility options. This trend is expected to contribute to the market's growth, with projections indicating a market value of 79.9 USD Billion in 2024, potentially reaching 150 USD Billion by 2035.

    Market Growth Projections

    The Global Ride Sharing Market Industry is poised for substantial growth, with projections indicating a market value of 79.9 USD Billion in 2024 and an anticipated increase to 150 USD Billion by 2035. This growth trajectory reflects a compound annual growth rate of 5.9% from 2025 to 2035. The expansion is driven by various factors, including urbanization, technological advancements, and changing consumer preferences. As the industry evolves, it is likely to adapt to emerging trends and challenges, positioning itself as a key player in the transportation sector.

    Technological Advancements

    Technological advancements play a pivotal role in shaping the Global Ride Sharing Market Industry. The integration of mobile applications, GPS navigation, and real-time data analytics enhances user experience and operational efficiency. Companies are leveraging technology to optimize routes, reduce wait times, and improve safety features. For example, ride-sharing platforms are increasingly utilizing artificial intelligence to predict demand and manage driver availability. This technological evolution is likely to drive market growth, with a projected compound annual growth rate of 5.9% from 2025 to 2035, reflecting the industry's adaptability to technological innovations.

    Changing Consumer Preferences

    The Global Ride Sharing Market Industry is also being driven by changing consumer preferences, particularly among younger demographics. Millennials and Generation Z are more inclined to utilize ride-sharing services over traditional car ownership. This shift is attributed to factors such as cost-effectiveness, convenience, and a desire for flexible transportation options. As these generations continue to dominate the consumer landscape, ride-sharing services are likely to see increased adoption. This trend is indicative of a broader cultural shift towards shared mobility, which could significantly impact market dynamics in the coming years.

    Government Initiatives and Regulations

    Government initiatives and regulations are shaping the Global Ride Sharing Market Industry by fostering a conducive environment for ride-sharing operations. Many governments are implementing policies that support shared mobility, such as tax incentives and infrastructure investments. For example, cities are increasingly designating specific lanes for ride-sharing vehicles to enhance efficiency. Additionally, regulatory frameworks are evolving to ensure safety and accountability within the industry. These supportive measures are expected to stimulate market growth, as they create a favorable landscape for ride-sharing companies to thrive.

    Market Segment Insights

    Ride Sharing Market Service Model Insights

    The Ride Sharing Market has shown significant evolution within the Service Model segment, which is crucial in shaping the dynamics of the overall market. By 2024, the market is projected to be valued at 79.88 USD Billion, with substantial contributions from various service models. Within this context, the Peer-to-Peer segment is expected to be valued at 30.0 USD Billion in 2024, reflecting the rising popularity of individual consumers offering rides to each other. This model is significant as it empowers drivers to independently monetize their vehicles, enhancing flexibility for both passengers and drivers.

    Furthermore, it is likely to dominate the landscape, as it accounts for nearly 38% of the market in its segment. The Business-to-Consumer segment, valued at 25.0 USD Billion in 2024, serves as a promising alternative, providing services directly from companies to consumers. This segment typically boasts established brands and customer trust, making it appealing for users who prefer engaging with recognized service providers. Meanwhile, the Business-to-Business offering, projected at 24.88 USD Billion in 2024, represents a less dominant yet critical component that caters to corporate needs for transportation solutions.

    These services often involve contracts with companies for employee travel or logistics, dealing with a niche market that is increasingly appreciating the efficiency and convenience ride-sharing offers. The combined impact of these models highlights the Ride Sharing Market segmentation, illustrating not just the revenue each segment is poised to generate but also the changing consumer preferences shaping the market's evolution. As commuters continue to shift towards shared mobility solutions, the peer-to-peer model's emphasis on cost-effectiveness and flexibility, alongside the recognition enjoyed by business-oriented models, will drive further market growth.

    Understanding these nuances provides invaluable insight into the Ride Sharing Market statistics and data, illuminating challenges, opportunities, and key trends likely to influence the landscape up through 2035 and beyond.

    Source: Primary Research, Secondary Research, Market Research Future Database and Analyst Review

    Ride Sharing Market Vehicle Type Insights

    The Ride Sharing Market is increasingly shaped by the diversity of vehicle types used in services, with significant contributions from categories such as Sedans, SUVs, Minivans, and Luxury Cars. As of 2024, the overall market is expected to be valued at approximately 79.88 billion USD, reflecting a growing demand for ride-sharing services globally. Sedans are prevalent due to their efficiency and cost-effectiveness, catering to the majority of users seeking affordable transportation. SUVs are gaining traction for their spaciousness and versatility, appealing to families and groups, while Minivans serve similar demographics by offering ample room and comfort for larger parties.

    Luxury Cars provide a premium experience, attracting clientele willing to pay more for comfort and status. This segment diversification enhances the user experience and attracts a broader range of customers, thus driving market growth. Despite growth challenges such as regulatory hurdles and competition, the increasing urbanization and demand for alternative transportation options present ample opportunities for expansion within the Ride Sharing Market. As urban mobility trends evolve, the significance of different vehicle types in shaping the landscape of this market continues to grow, with each category playing a crucial role in meeting diverse consumer needs and preferences.

    Ride Sharing Market Ride Type Insights

    The Ride Sharing Market is experiencing notable growth, particularly in the Ride Type segment, which is a pivotal component of the industry. By 2024, the market is projected to achieve a value of 79.88 USD Billion, reflecting evolving consumer preferences and transportation needs. In this segment, the categories of Pooling, Private, and Luxury play significant roles in shaping market dynamics. Pooling services, which allow riders to share their trips with others, have gained traction for their cost-effectiveness and sustainability, appealing to environmentally conscious consumers.

    Private rides offer individuals enhanced comfort and convenience, catering to those seeking personalized travel experiences. Luxury ride services are becoming increasingly popular among affluent clientele who prioritize high-quality service and exclusive experiences. The combination of these factors contributes to the diverse Ride Sharing Market segmentation, addressing various consumer demands. Market statistics indicate that continued investment in technology and customer experience will drive market growth, while challenges such as regulatory hurdles and competition also shape the landscape.

    Overall, the Ride Type segment is crucial for understanding the broader trends and opportunities in the Ride Sharing Market.

    Ride Sharing Market Payment Model Insights

    The Payment Model segment of the Ride Sharing Market is projected to play a crucial role as the market evolves, especially as the overall market is expected to reach a valuation of 79.88 USD billion in 2024. This segment is primarily characterized by various methods, including Pay-as-You-Go, Subscription-based, and On-Demand models. Pay-as-You-Go continues to gain traction, offering flexibility and cost-effectiveness, which appeals to a wide range of users. Subscription-based models are also becoming increasingly significant, providing regular users with predictable costs while fostering customer loyalty.

    On-Demand services are dominating the landscape, catering to immediate travel needs, making these services more accessible and convenient for users. The growing preference for digital payment solutions and the advent of technologies that streamline transactions are further enhancing the importance of these payment models. As the Ride Sharing Market revenue expands, understanding the market segmentation becomes essential for stakeholders to tap into the lucrative opportunities and adapt to changing consumer preferences effectively. Additionally, increased urbanization and changing commuting patterns globally are driving the need for innovative payment solutions, indicating ongoing growth in this segment.

    Get more detailed insights about Ride Sharing Market Research Report – Global Forecast till 2035

    Regional Insights

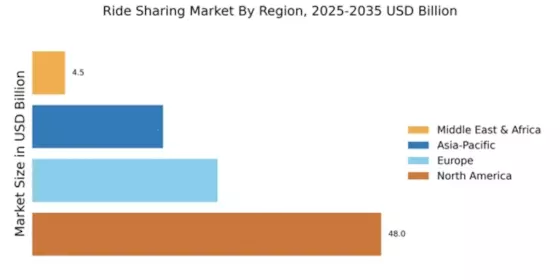
    The Ride Sharing Market exhibits significant regional dynamics with varied valuations across different areas. In 2024, North America leads with a valuation of 30.0 USD Billion, reflecting dominance due to its advanced technology infrastructure and high urbanization rates. Europe follows closely, valued at 25.0 USD Billion, benefiting from regulatory support and a strong emphasis on sustainability. The Asia Pacific region, valued at 15.0 USD Billion, showcases rapid growth driven by increasing smartphone penetration and urban migration, illustrating its significance in the Ride Sharing Market landscape.

    South America presents a smaller market at 6.0 USD Billion in 2024, nevertheless showing potential for development due to emerging economies. The Middle East and Africa represent a nascent sector, valued at 3.88 USD Billion, with prospects for growth linked to increasing digital adoption and investments in transportation infrastructure. Overall, the regional segmentation of the Ride Sharing Market illustrates varying degrees of maturity and potential, influenced by factors such as technology adoption, regulatory environments, and economic conditions.

    Ride Sharing Market Regional Insights Overview

    Source: Primary Research, Secondary Research, Market Research Future Database and Analyst Review

    Key Players and Competitive Insights

    The Ride Sharing Market has become increasingly competitive as technological advancements and changing consumer preferences shape the landscape of transportation. Various domestic and international players are vying for market share, utilizing different strategies to establish their foothold in this rapidly evolving sector. With the rise of mobile applications facilitating efficient ride-hailing services, companies are not only competing on pricing but also on the quality of service, user experience, and geographical reach.

    Additionally, regulatory challenges and the integration of sustainable practices are influencing how these companies strategize their market positioning. This dynamic market is characterized by innovation, partnerships, and an ongoing quest to enhance customer satisfaction while maintaining operational efficiency.

    Ola operates as a significant player in the Ride Sharing Market, offering a diverse range of transport services that extend beyond traditional ride-hailing. Its robust platform includes services such as Ola Electric, which focuses on promoting sustainable transportation through electric vehicles. Ola's presence is marked by its extensive service range in multiple international markets, emphasizing its adaptability and commitment to innovation.

    The company has pursued strategic partnerships, mergers, and acquisitions to enhance its technological capabilities while expanding its footprint. This approach has enabled Ola to integrate smart features and improve user experience effectively. With a focus on bolstering operational efficiency and scaling its services, Ola's strengths lie in its comprehensive suite of offerings, responsiveness to changing market dynamics, and robust infrastructure that supports consistent growth in the global ride-sharing arena.

    Key Companies in the Ride Sharing Market market include

    Industry Developments

    Future Outlook

    Ride Sharing Market Future Outlook

    The Global Ride Sharing Market is projected to grow at a 5.9% CAGR from 2024 to 2035, driven by technological advancements, urbanization, and changing consumer preferences.

    New opportunities lie in:

    • Developing integrated mobility solutions combining ride-sharing with public transport.
    • Leveraging AI for dynamic pricing and enhanced user experience.
    • Expanding services to underserved regions to capture new customer segments.

    By 2035, the market is expected to reach a robust position, reflecting substantial growth and innovation.

    Market Segmentation

    Ride Sharing Market Regional Outlook

    • North America
    • Europe
    • South America
    • Asia Pacific
    • Middle East and Africa

    Ride Sharing Market Ride Type Outlook

    • Pooling
    • Private
    • Luxury

    Ride Sharing Market Vehicle Type Outlook

    • Sedan
    • SUV
    • Minivan
    • Luxury Car

    Ride Sharing Market Payment Model Outlook

    • Pay-as-You-Go
    • Subscription-based
    • On-Demand

    Ride Sharing Market Service Model Outlook

    • Peer-to-Peer
    • Business-to-Consumer
    • Business-to-Business

    Report Scope

     
    Report Attribute/Metric Source: Details
    MARKET SIZE 2023 75.43 (USD Billion)
    MARKET SIZE 2024 79.88 (USD Billion)
    MARKET SIZE 2035 150.0 (USD Billion)
    COMPOUND ANNUAL GROWTH RATE (CAGR) 5.89% (2025 - 2035)
    REPORT COVERAGE Revenue Forecast, Competitive Landscape, Growth Factors, and Trends
    BASE YEAR 2024
    MARKET FORECAST PERIOD 2025 - 2035
    HISTORICAL DATA 2019 - 2024
    MARKET FORECAST UNITS USD Billion
    KEY COMPANIES PROFILED Uber, Zeemee, Lyft, Yandex.Taxi, Chalo, Lime, Ola, Via, Grab, Bolt, Didi Chuxing, Curb, Gojek, Careem, Gett
    SEGMENTS COVERED Service Model, Vehicle Type, Ride Type, Payment Model, Regional
    KEY MARKET OPPORTUNITIES Electric vehicle integration, Expansion in emerging markets, Tech-driven solutions adoption, Sustainable transportation initiatives, Increased urban population demand
    KEY MARKET DYNAMICS Technological Advancements, Regulatory Challenges, Consumer Preference Shift, Competitive Landscape, Environmental Concerns
    COUNTRIES COVERED North America, Europe, APAC, South America, MEA

    Market Highlights

    Author
    Swapnil Palwe
    Team Lead - Research

    With a technical background as Bachelor's in Mechanical Engineering, with MBA in Operations Management , Swapnil has 6+ years of experience in market research, consulting and analytics with the tasks of data mining, analysis, and project execution. He is the POC for our clients, for their consulting projects running under the Automotive/A&D domain. Swapnil has worked on major projects in verticals such as Aerospace & Defense, Automotive and many other domain projects. He has worked on projects for fortune 500 companies' syndicate and consulting projects along with several government projects.

    Leave a Comment

    FAQs

    What is the projected market size of the Global Ride Sharing Market in 2024?

    The projected market size of the Global Ride Sharing Market in 2024 is expected to be valued at 79.88 USD Billion.

    What will be the market size of the Global Ride Sharing Market by 2035?

    By 2035, the Global Ride Sharing Market is expected to be valued at 150.0 USD Billion.

    What is the expected CAGR for the Global Ride Sharing Market from 2025 to 2035?

    The expected CAGR for the Global Ride Sharing Market from 2025 to 2035 is 5.89%.

    Which region is projected to dominate the Global Ride Sharing Market in 2024?

    In 2024, North America is projected to dominate the Global Ride Sharing Market with a value of 30.0 USD Billion.

    What will be the market value of the Global Ride Sharing Market in Europe by 2035?

    By 2035, the market value of the Global Ride Sharing Market in Europe is expected to reach 40.0 USD Billion.

    Which are the key players in the Global Ride Sharing Market?

    Key players in the Global Ride Sharing Market include Uber, Lyft, Didi Chuxing, and Grab among others.

    What is the expected market size for Peer-to-Peer ride sharing by 2035?

    The market size for Peer-to-Peer ride sharing is expected to reach 50.0 USD Billion by 2035.

    What will be the market value for the Business-to-Business model in 2024?

    The market value for the Business-to-Business model in 2024 is anticipated to be 24.88 USD Billion.

    How is the ride sharing market expected to grow in the APAC region by 2035?

    The ride sharing market in the APAC region is expected to grow to 35.0 USD Billion by 2035.

    What are the growth drivers behind the Global Ride Sharing Market?

    Key growth drivers for the Global Ride Sharing Market include increasing urbanization and technological advancements.

    1. EXECUTIVE
    2. SUMMARY
    3. Market Overview
    4. Key Findings
    5. Market Segmentation
    6. Competitive Landscape
    7. Challenges and Opportunities
    8. Future Outlook
    9. MARKET INTRODUCTION
    10. Definition
    11. Scope of the study
    12. Research Objective
    13. Assumption
    14. Limitations
    15. RESEARCH
    16. METHODOLOGY
    17. Overview
    18. Data
    19. Mining
    20. Secondary Research
    21. Primary
    22. Research
    23. Primary Interviews and Information Gathering
    24. Process
    25. Breakdown of Primary Respondents
    26. Forecasting
    27. Model
    28. Market Size Estimation
    29. Bottom-Up
    30. Approach
    31. Top-Down Approach
    32. Data
    33. Triangulation
    34. Validation
    35. MARKET
    36. DYNAMICS
    37. Overview
    38. Drivers
    39. Restraints
    40. Opportunities
    41. MARKET FACTOR ANALYSIS
    42. Value chain Analysis
    43. Porter's
    44. Five Forces Analysis
    45. Bargaining Power of Suppliers
    46. Bargaining
    47. Power of Buyers
    48. Threat of New Entrants
    49. Threat
    50. of Substitutes
    51. Intensity of Rivalry
    52. COVID-19
    53. Impact Analysis
    54. Market Impact Analysis
    55. Regional
    56. Impact
    57. Opportunity and Threat Analysis
    58. Ride
    59. Sharing Market, BY Service Model (USD Billion)
    60. Peer-to-Peer
    61. Business-to-Consumer
    62. Business-to-Business
    63. Ride
    64. Sharing Market, BY Vehicle Type (USD Billion)
    65. Sedan
    66. SUV
    67. Minivan
    68. Luxury
    69. Car
    70. Ride Sharing Market, BY
    71. Ride Type (USD Billion)
    72. Pooling
    73. Private
    74. Luxury
    75. Ride
    76. Sharing Market, BY Payment Model (USD Billion)
    77. Pay-as-You-Go
    78. Subscription-based
    79. On-Demand
    80. Ride
    81. Sharing Market, BY Regional (USD Billion)
    82. North
    83. America
    84. US
    85. Canada
    86. Europe
    87. Germany
    88. UK
    89. France
    90. Russia
    91. Italy
    92. Spain
    93. Rest
    94. of Europe
    95. APAC
    96. China
    97. India
    98. Japan
    99. South
    100. Korea
    101. Malaysia
    102. Thailand
    103. Indonesia
    104. Rest
    105. of APAC
    106. South America
    107. Brazil
    108. Mexico
    109. Argentina
    110. Rest
    111. of South America
    112. MEA
    113. GCC
    114. Countries
    115. South Africa
    116. Rest
    117. of MEA
    118. Competitive Landscape
    119. Overview
    120. Competitive
    121. Analysis
    122. Market share Analysis
    123. Major
    124. Growth Strategy in the Ride Sharing Market
    125. Competitive
    126. Benchmarking
    127. Leading Players in Terms of Number of Developments
    128. in the Ride Sharing Market
    129. Key developments and growth
    130. strategies
    131. New Product Launch/Service Deployment
    132. Merger
    133. & Acquisitions
    134. Joint Ventures
    135. Major
    136. Players Financial Matrix
    137. Sales and Operating Income
    138. Major
    139. Players R&D Expenditure. 2023
    140. Company
    141. Profiles
    142. Uber
    143. Financial
    144. Overview
    145. Products Offered
    146. Key
    147. Developments
    148. SWOT Analysis
    149. Key
    150. Strategies
    151. Zeemee
    152. Financial
    153. Overview
    154. Products Offered
    155. Key
    156. Developments
    157. SWOT Analysis
    158. Key
    159. Strategies
    160. Lyft
    161. Financial
    162. Overview
    163. Products Offered
    164. Key
    165. Developments
    166. SWOT Analysis
    167. Key
    168. Strategies
    169. Yandex.Taxi
    170. Financial
    171. Overview
    172. Products Offered
    173. Key
    174. Developments
    175. SWOT Analysis
    176. Key
    177. Strategies
    178. Chalo
    179. Financial
    180. Overview
    181. Products Offered
    182. Key
    183. Developments
    184. SWOT Analysis
    185. Key
    186. Strategies
    187. Lime
    188. Financial
    189. Overview
    190. Products Offered
    191. Key
    192. Developments
    193. SWOT Analysis
    194. Key
    195. Strategies
    196. Ola
    197. Financial
    198. Overview
    199. Products Offered
    200. Key
    201. Developments
    202. SWOT Analysis
    203. Key
    204. Strategies
    205. Via
    206. Financial
    207. Overview
    208. Products Offered
    209. Key
    210. Developments
    211. SWOT Analysis
    212. Key
    213. Strategies
    214. Grab
    215. Financial
    216. Overview
    217. Products Offered
    218. Key
    219. Developments
    220. SWOT Analysis
    221. Key
    222. Strategies
    223. Bolt
    224. Financial
    225. Overview
    226. Products Offered
    227. Key
    228. Developments
    229. SWOT Analysis
    230. Key
    231. Strategies
    232. Didi Chuxing
    233. Financial
    234. Overview
    235. Products Offered
    236. Key
    237. Developments
    238. SWOT Analysis
    239. Key
    240. Strategies
    241. Curb
    242. Financial
    243. Overview
    244. Products Offered
    245. Key
    246. Developments
    247. SWOT Analysis
    248. Key
    249. Strategies
    250. Gojek
    251. Financial
    252. Overview
    253. Products Offered
    254. Key
    255. Developments
    256. SWOT Analysis
    257. Key
    258. Strategies
    259. Careem
    260. Financial
    261. Overview
    262. Products Offered
    263. Key
    264. Developments
    265. SWOT Analysis
    266. Key
    267. Strategies
    268. Gett
    269. Financial
    270. Overview
    271. Products Offered
    272. Key
    273. Developments
    274. SWOT Analysis
    275. Key
    276. Strategies
    277. References
    278. Related
    279. Reports
    280. LIST
    281. OF ASSUMPTIONS
    282. North America Ride Sharing Market SIZE
    283. ESTIMATES & FORECAST, BY SERVICE MODEL, 2019-2035 (USD Billions)
    284. North
    285. America Ride Sharing Market SIZE ESTIMATES & FORECAST, BY VEHICLE TYPE, 2019-2035
    286. (USD Billions)
    287. North America Ride Sharing Market SIZE
    288. ESTIMATES & FORECAST, BY RIDE TYPE, 2019-2035 (USD Billions)
    289. North
    290. America Ride Sharing Market SIZE ESTIMATES & FORECAST, BY PAYMENT MODEL, 2019-2035
    291. (USD Billions)
    292. North America Ride Sharing Market SIZE
    293. ESTIMATES & FORECAST, BY REGIONAL, 2019-2035 (USD Billions)
    294. US
    295. Ride Sharing Market SIZE ESTIMATES & FORECAST, BY SERVICE MODEL, 2019-2035 (USD
    296. Billions)
    297. US Ride Sharing Market SIZE ESTIMATES &
    298. FORECAST, BY VEHICLE TYPE, 2019-2035 (USD Billions)
    299. US
    300. Ride Sharing Market SIZE ESTIMATES & FORECAST, BY RIDE TYPE, 2019-2035 (USD
    301. Billions)
    302. US Ride Sharing Market SIZE ESTIMATES &
    303. FORECAST, BY PAYMENT MODEL, 2019-2035 (USD Billions)
    304. US
    305. Ride Sharing Market SIZE ESTIMATES & FORECAST, BY REGIONAL, 2019-2035 (USD Billions)
    306. Canada
    307. Ride Sharing Market SIZE ESTIMATES & FORECAST, BY SERVICE MODEL, 2019-2035 (USD
    308. Billions)
    309. Canada Ride Sharing Market SIZE ESTIMATES &
    310. FORECAST, BY VEHICLE TYPE, 2019-2035 (USD Billions)
    311. Canada
    312. Ride Sharing Market SIZE ESTIMATES & FORECAST, BY RIDE TYPE, 2019-2035 (USD
    313. Billions)
    314. Canada Ride Sharing Market SIZE ESTIMATES &
    315. FORECAST, BY PAYMENT MODEL, 2019-2035 (USD Billions)
    316. Canada
    317. Ride Sharing Market SIZE ESTIMATES & FORECAST, BY REGIONAL, 2019-2035 (USD Billions)
    318. Europe
    319. Ride Sharing Market SIZE ESTIMATES & FORECAST, BY SERVICE MODEL, 2019-2035 (USD
    320. Billions)
    321. Europe Ride Sharing Market SIZE ESTIMATES &
    322. FORECAST, BY VEHICLE TYPE, 2019-2035 (USD Billions)
    323. Europe
    324. Ride Sharing Market SIZE ESTIMATES & FORECAST, BY RIDE TYPE, 2019-2035 (USD
    325. Billions)
    326. Europe Ride Sharing Market SIZE ESTIMATES &
    327. FORECAST, BY PAYMENT MODEL, 2019-2035 (USD Billions)
    328. Europe
    329. Ride Sharing Market SIZE ESTIMATES & FORECAST, BY REGIONAL, 2019-2035 (USD Billions)
    330. Germany
    331. Ride Sharing Market SIZE ESTIMATES & FORECAST, BY SERVICE MODEL, 2019-2035 (USD
    332. Billions)
    333. Germany Ride Sharing Market SIZE ESTIMATES
    334. & FORECAST, BY VEHICLE TYPE, 2019-2035 (USD Billions)
    335. Germany
    336. Ride Sharing Market SIZE ESTIMATES & FORECAST, BY RIDE TYPE, 2019-2035 (USD
    337. Billions)
    338. Germany Ride Sharing Market SIZE ESTIMATES
    339. & FORECAST, BY PAYMENT MODEL, 2019-2035 (USD Billions)
    340. Germany
    341. Ride Sharing Market SIZE ESTIMATES & FORECAST, BY REGIONAL, 2019-2035 (USD Billions)
    342. UK
    343. Ride Sharing Market SIZE ESTIMATES & FORECAST, BY SERVICE MODEL, 2019-2035 (USD
    344. Billions)
    345. UK Ride Sharing Market SIZE ESTIMATES &
    346. FORECAST, BY VEHICLE TYPE, 2019-2035 (USD Billions)
    347. UK
    348. Ride Sharing Market SIZE ESTIMATES & FORECAST, BY RIDE TYPE, 2019-2035 (USD
    349. Billions)
    350. UK Ride Sharing Market SIZE ESTIMATES &
    351. FORECAST, BY PAYMENT MODEL, 2019-2035 (USD Billions)
    352. UK
    353. Ride Sharing Market SIZE ESTIMATES & FORECAST, BY REGIONAL, 2019-2035 (USD Billions)
    354. France
    355. Ride Sharing Market SIZE ESTIMATES & FORECAST, BY SERVICE MODEL, 2019-2035 (USD
    356. Billions)
    357. France Ride Sharing Market SIZE ESTIMATES &
    358. FORECAST, BY VEHICLE TYPE, 2019-2035 (USD Billions)
    359. France
    360. Ride Sharing Market SIZE ESTIMATES & FORECAST, BY RIDE TYPE, 2019-2035 (USD
    361. Billions)
    362. France Ride Sharing Market SIZE ESTIMATES &
    363. FORECAST, BY PAYMENT MODEL, 2019-2035 (USD Billions)
    364. France
    365. Ride Sharing Market SIZE ESTIMATES & FORECAST, BY REGIONAL, 2019-2035 (USD Billions)
    366. Russia
    367. Ride Sharing Market SIZE ESTIMATES & FORECAST, BY SERVICE MODEL, 2019-2035 (USD
    368. Billions)
    369. Russia Ride Sharing Market SIZE ESTIMATES &
    370. FORECAST, BY VEHICLE TYPE, 2019-2035 (USD Billions)
    371. Russia
    372. Ride Sharing Market SIZE ESTIMATES & FORECAST, BY RIDE TYPE, 2019-2035 (USD
    373. Billions)
    374. Russia Ride Sharing Market SIZE ESTIMATES &
    375. FORECAST, BY PAYMENT MODEL, 2019-2035 (USD Billions)
    376. Russia
    377. Ride Sharing Market SIZE ESTIMATES & FORECAST, BY REGIONAL, 2019-2035 (USD Billions)
    378. Italy
    379. Ride Sharing Market SIZE ESTIMATES & FORECAST, BY SERVICE MODEL, 2019-2035 (USD
    380. Billions)
    381. Italy Ride Sharing Market SIZE ESTIMATES &
    382. FORECAST, BY VEHICLE TYPE, 2019-2035 (USD Billions)
    383. Italy
    384. Ride Sharing Market SIZE ESTIMATES & FORECAST, BY RIDE TYPE, 2019-2035 (USD
    385. Billions)
    386. Italy Ride Sharing Market SIZE ESTIMATES &
    387. FORECAST, BY PAYMENT MODEL, 2019-2035 (USD Billions)
    388. Italy
    389. Ride Sharing Market SIZE ESTIMATES & FORECAST, BY REGIONAL, 2019-2035 (USD Billions)
    390. Spain
    391. Ride Sharing Market SIZE ESTIMATES & FORECAST, BY SERVICE MODEL, 2019-2035 (USD
    392. Billions)
    393. Spain Ride Sharing Market SIZE ESTIMATES &
    394. FORECAST, BY VEHICLE TYPE, 2019-2035 (USD Billions)
    395. Spain
    396. Ride Sharing Market SIZE ESTIMATES & FORECAST, BY RIDE TYPE, 2019-2035 (USD
    397. Billions)
    398. Spain Ride Sharing Market SIZE ESTIMATES &
    399. FORECAST, BY PAYMENT MODEL, 2019-2035 (USD Billions)
    400. Spain
    401. Ride Sharing Market SIZE ESTIMATES & FORECAST, BY REGIONAL, 2019-2035 (USD Billions)
    402. Rest
    403. of Europe Ride Sharing Market SIZE ESTIMATES & FORECAST, BY SERVICE MODEL, 2019-2035
    404. (USD Billions)
    405. Rest of Europe Ride Sharing Market SIZE
    406. ESTIMATES & FORECAST, BY VEHICLE TYPE, 2019-2035 (USD Billions)
    407. Rest
    408. of Europe Ride Sharing Market SIZE ESTIMATES & FORECAST, BY RIDE TYPE, 2019-2035
    409. (USD Billions)
    410. Rest of Europe Ride Sharing Market SIZE
    411. ESTIMATES & FORECAST, BY PAYMENT MODEL, 2019-2035 (USD Billions)
    412. Rest
    413. of Europe Ride Sharing Market SIZE ESTIMATES & FORECAST, BY REGIONAL, 2019-2035
    414. (USD Billions)
    415. APAC Ride Sharing Market SIZE ESTIMATES
    416. & FORECAST, BY SERVICE MODEL, 2019-2035 (USD Billions)
    417. APAC
    418. Ride Sharing Market SIZE ESTIMATES & FORECAST, BY VEHICLE TYPE, 2019-2035 (USD
    419. Billions)
    420. APAC Ride Sharing Market SIZE ESTIMATES &
    421. FORECAST, BY RIDE TYPE, 2019-2035 (USD Billions)
    422. APAC
    423. Ride Sharing Market SIZE ESTIMATES & FORECAST, BY PAYMENT MODEL, 2019-2035 (USD
    424. Billions)
    425. APAC Ride Sharing Market SIZE ESTIMATES &
    426. FORECAST, BY REGIONAL, 2019-2035 (USD Billions)
    427. China
    428. Ride Sharing Market SIZE ESTIMATES & FORECAST, BY SERVICE MODEL, 2019-2035 (USD
    429. Billions)
    430. China Ride Sharing Market SIZE ESTIMATES &
    431. FORECAST, BY VEHICLE TYPE, 2019-2035 (USD Billions)
    432. China
    433. Ride Sharing Market SIZE ESTIMATES & FORECAST, BY RIDE TYPE, 2019-2035 (USD
    434. Billions)
    435. China Ride Sharing Market SIZE ESTIMATES &
    436. FORECAST, BY PAYMENT MODEL, 2019-2035 (USD Billions)
    437. China
    438. Ride Sharing Market SIZE ESTIMATES & FORECAST, BY REGIONAL, 2019-2035 (USD Billions)
    439. India
    440. Ride Sharing Market SIZE ESTIMATES & FORECAST, BY SERVICE MODEL, 2019-2035 (USD
    441. Billions)
    442. India Ride Sharing Market SIZE ESTIMATES &
    443. FORECAST, BY VEHICLE TYPE, 2019-2035 (USD Billions)
    444. India
    445. Ride Sharing Market SIZE ESTIMATES & FORECAST, BY RIDE TYPE, 2019-2035 (USD
    446. Billions)
    447. India Ride Sharing Market SIZE ESTIMATES &
    448. FORECAST, BY PAYMENT MODEL, 2019-2035 (USD Billions)
    449. India
    450. Ride Sharing Market SIZE ESTIMATES & FORECAST, BY REGIONAL, 2019-2035 (USD Billions)
    451. Japan
    452. Ride Sharing Market SIZE ESTIMATES & FORECAST, BY SERVICE MODEL, 2019-2035 (USD
    453. Billions)
    454. Japan Ride Sharing Market SIZE ESTIMATES &
    455. FORECAST, BY VEHICLE TYPE, 2019-2035 (USD Billions)
    456. Japan
    457. Ride Sharing Market SIZE ESTIMATES & FORECAST, BY RIDE TYPE, 2019-2035 (USD
    458. Billions)
    459. Japan Ride Sharing Market SIZE ESTIMATES &
    460. FORECAST, BY PAYMENT MODEL, 2019-2035 (USD Billions)
    461. Japan
    462. Ride Sharing Market SIZE ESTIMATES & FORECAST, BY REGIONAL, 2019-2035 (USD Billions)
    463. South
    464. Korea Ride Sharing Market SIZE ESTIMATES & FORECAST, BY SERVICE MODEL, 2019-2035
    465. (USD Billions)
    466. South Korea Ride Sharing Market SIZE ESTIMATES
    467. & FORECAST, BY VEHICLE TYPE, 2019-2035 (USD Billions)
    468. South
    469. Korea Ride Sharing Market SIZE ESTIMATES & FORECAST, BY RIDE TYPE, 2019-2035
    470. (USD Billions)
    471. South Korea Ride Sharing Market SIZE ESTIMATES
    472. & FORECAST, BY PAYMENT MODEL, 2019-2035 (USD Billions)
    473. South
    474. Korea Ride Sharing Market SIZE ESTIMATES & FORECAST, BY REGIONAL, 2019-2035
    475. (USD Billions)
    476. Malaysia Ride Sharing Market SIZE ESTIMATES
    477. & FORECAST, BY SERVICE MODEL, 2019-2035 (USD Billions)
    478. Malaysia
    479. Ride Sharing Market SIZE ESTIMATES & FORECAST, BY VEHICLE TYPE, 2019-2035 (USD
    480. Billions)
    481. Malaysia Ride Sharing Market SIZE ESTIMATES
    482. & FORECAST, BY RIDE TYPE, 2019-2035 (USD Billions)
    483. Malaysia
    484. Ride Sharing Market SIZE ESTIMATES & FORECAST, BY PAYMENT MODEL, 2019-2035 (USD
    485. Billions)
    486. Malaysia Ride Sharing Market SIZE ESTIMATES
    487. & FORECAST, BY REGIONAL, 2019-2035 (USD Billions)
    488. Thailand
    489. Ride Sharing Market SIZE ESTIMATES & FORECAST, BY SERVICE MODEL, 2019-2035 (USD
    490. Billions)
    491. Thailand Ride Sharing Market SIZE ESTIMATES
    492. & FORECAST, BY VEHICLE TYPE, 2019-2035 (USD Billions)
    493. Thailand
    494. Ride Sharing Market SIZE ESTIMATES & FORECAST, BY RIDE TYPE, 2019-2035 (USD
    495. Billions)
    496. Thailand Ride Sharing Market SIZE ESTIMATES
    497. & FORECAST, BY PAYMENT MODEL, 2019-2035 (USD Billions)
    498. Thailand
    499. Ride Sharing Market SIZE ESTIMATES & FORECAST, BY REGIONAL, 2019-2035 (USD Billions)
    500. Indonesia
    501. Ride Sharing Market SIZE ESTIMATES & FORECAST, BY SERVICE MODEL, 2019-2035 (USD
    502. Billions)
    503. Indonesia Ride Sharing Market SIZE ESTIMATES
    504. & FORECAST, BY VEHICLE TYPE, 2019-2035 (USD Billions)
    505. Indonesia
    506. Ride Sharing Market SIZE ESTIMATES & FORECAST, BY RIDE TYPE, 2019-2035 (USD
    507. Billions)
    508. Indonesia Ride Sharing Market SIZE ESTIMATES
    509. & FORECAST, BY PAYMENT MODEL, 2019-2035 (USD Billions)
    510. Indonesia
    511. Ride Sharing Market SIZE ESTIMATES & FORECAST, BY REGIONAL, 2019-2035 (USD Billions)
    512. Rest
    513. of APAC Ride Sharing Market SIZE ESTIMATES & FORECAST, BY SERVICE MODEL, 2019-2035
    514. (USD Billions)
    515. Rest of APAC Ride Sharing Market SIZE
    516. ESTIMATES & FORECAST, BY VEHICLE TYPE, 2019-2035 (USD Billions)
    517. Rest
    518. of APAC Ride Sharing Market SIZE ESTIMATES & FORECAST, BY RIDE TYPE, 2019-2035
    519. (USD Billions)
    520. Rest of APAC Ride Sharing Market SIZE
    521. ESTIMATES & FORECAST, BY PAYMENT MODEL, 2019-2035 (USD Billions)
    522. Rest
    523. of APAC Ride Sharing Market SIZE ESTIMATES & FORECAST, BY REGIONAL, 2019-2035
    524. (USD Billions)
    525. South America Ride Sharing Market SIZE
    526. ESTIMATES & FORECAST, BY SERVICE MODEL, 2019-2035 (USD Billions)
    527. South
    528. America Ride Sharing Market SIZE ESTIMATES & FORECAST, BY VEHICLE TYPE, 2019-2035
    529. (USD Billions)
    530. South America Ride Sharing Market SIZE
    531. ESTIMATES & FORECAST, BY RIDE TYPE, 2019-2035 (USD Billions)
    532. South
    533. America Ride Sharing Market SIZE ESTIMATES & FORECAST, BY PAYMENT MODEL, 2019-2035
    534. (USD Billions)
    535. South America Ride Sharing Market SIZE
    536. ESTIMATES & FORECAST, BY REGIONAL, 2019-2035 (USD Billions)
    537. Brazil
    538. Ride Sharing Market SIZE ESTIMATES & FORECAST, BY SERVICE MODEL, 2019-2035 (USD
    539. Billions)
    540. Brazil Ride Sharing Market SIZE ESTIMATES &
    541. FORECAST, BY VEHICLE TYPE, 2019-2035 (USD Billions)
    542. Brazil
    543. Ride Sharing Market SIZE ESTIMATES & FORECAST, BY RIDE TYPE, 2019-2035 (USD
    544. Billions)
    545. Brazil Ride Sharing Market SIZE ESTIMATES &
    546. FORECAST, BY PAYMENT MODEL, 2019-2035 (USD Billions)
    547. Brazil
    548. Ride Sharing Market SIZE ESTIMATES & FORECAST, BY REGIONAL, 2019-2035 (USD Billions)
    549. Mexico
    550. Ride Sharing Market SIZE ESTIMATES & FORECAST, BY SERVICE MODEL, 2019-2035 (USD
    551. Billions)
    552. Mexico Ride Sharing Market SIZE ESTIMATES &
    553. FORECAST, BY VEHICLE TYPE, 2019-2035 (USD Billions)
    554. Mexico
    555. Ride Sharing Market SIZE ESTIMATES & FORECAST, BY RIDE TYPE, 2019-2035 (USD
    556. Billions)
    557. Mexico Ride Sharing Market SIZE ESTIMATES &
    558. FORECAST, BY PAYMENT MODEL, 2019-2035 (USD Billions)
    559. Mexico
    560. Ride Sharing Market SIZE ESTIMATES & FORECAST, BY REGIONAL, 2019-2035 (USD Billions)
    561. Argentina
    562. Ride Sharing Market SIZE ESTIMATES & FORECAST, BY SERVICE MODEL, 2019-2035 (USD
    563. Billions)
    564. Argentina Ride Sharing Market SIZE ESTIMATES
    565. & FORECAST, BY VEHICLE TYPE, 2019-2035 (USD Billions)
    566. Argentina
    567. Ride Sharing Market SIZE ESTIMATES & FORECAST, BY RIDE TYPE, 2019-2035 (USD
    568. Billions)
    569. Argentina Ride Sharing Market SIZE ESTIMATES
    570. & FORECAST, BY PAYMENT MODEL, 2019-2035 (USD Billions)
    571. Argentina
    572. Ride Sharing Market SIZE ESTIMATES & FORECAST, BY REGIONAL, 2019-2035 (USD Billions)
    573. Rest
    574. of South America Ride Sharing Market SIZE ESTIMATES & FORECAST, BY SERVICE MODEL,
    575. 2035 (USD Billions)
    576. Rest of South America Ride Sharing
    577. Market SIZE ESTIMATES & FORECAST, BY VEHICLE TYPE, 2019-2035 (USD Billions)
    578. Rest
    579. of South America Ride Sharing Market SIZE ESTIMATES & FORECAST, BY RIDE TYPE,
    580. 2035 (USD Billions)
    581. Rest of South America Ride Sharing
    582. Market SIZE ESTIMATES & FORECAST, BY PAYMENT MODEL, 2019-2035 (USD Billions)
    583. Rest
    584. of South America Ride Sharing Market SIZE ESTIMATES & FORECAST, BY REGIONAL,
    585. 2035 (USD Billions)
    586. MEA Ride Sharing Market SIZE
    587. ESTIMATES & FORECAST, BY SERVICE MODEL, 2019-2035 (USD Billions)
    588. MEA
    589. Ride Sharing Market SIZE ESTIMATES & FORECAST, BY VEHICLE TYPE, 2019-2035 (USD
    590. Billions)
    591. MEA Ride Sharing Market SIZE ESTIMATES &
    592. FORECAST, BY RIDE TYPE, 2019-2035 (USD Billions)
    593. MEA
    594. Ride Sharing Market SIZE ESTIMATES & FORECAST, BY PAYMENT MODEL, 2019-2035 (USD
    595. Billions)
    596. MEA Ride Sharing Market SIZE ESTIMATES &
    597. FORECAST, BY REGIONAL, 2019-2035 (USD Billions)
    598. GCC Countries
    599. Ride Sharing Market SIZE ESTIMATES & FORECAST, BY SERVICE MODEL, 2019-2035 (USD
    600. Billions)
    601. GCC Countries Ride Sharing Market SIZE ESTIMATES
    602. & FORECAST, BY VEHICLE TYPE, 2019-2035 (USD Billions)
    603. GCC
    604. Countries Ride Sharing Market SIZE ESTIMATES & FORECAST, BY RIDE TYPE, 2019-2035
    605. (USD Billions)
    606. GCC Countries Ride Sharing Market SIZE
    607. ESTIMATES & FORECAST, BY PAYMENT MODEL, 2019-2035 (USD Billions)
    608. GCC
    609. Countries Ride Sharing Market SIZE ESTIMATES & FORECAST, BY REGIONAL, 2019-2035
    610. (USD Billions)
    611. South Africa Ride Sharing Market SIZE
    612. ESTIMATES & FORECAST, BY SERVICE MODEL, 2019-2035 (USD Billions)
    613. South
    614. Africa Ride Sharing Market SIZE ESTIMATES & FORECAST, BY VEHICLE TYPE, 2019-2035
    615. (USD Billions)
    616. South Africa Ride Sharing Market SIZE
    617. ESTIMATES & FORECAST, BY RIDE TYPE, 2019-2035 (USD Billions)
    618. South
    619. Africa Ride Sharing Market SIZE ESTIMATES & FORECAST, BY PAYMENT MODEL, 2019-2035
    620. (USD Billions)
    621. South Africa Ride Sharing Market SIZE
    622. ESTIMATES & FORECAST, BY REGIONAL, 2019-2035 (USD Billions)
    623. Rest
    624. of MEA Ride Sharing Market SIZE ESTIMATES & FORECAST, BY SERVICE MODEL, 2019-2035
    625. (USD Billions)
    626. Rest of MEA Ride Sharing Market SIZE ESTIMATES
    627. & FORECAST, BY VEHICLE TYPE, 2019-2035 (USD Billions)
    628. Rest
    629. of MEA Ride Sharing Market SIZE ESTIMATES & FORECAST, BY RIDE TYPE, 2019-2035
    630. (USD Billions)
    631. Rest of MEA Ride Sharing Market SIZE ESTIMATES
    632. & FORECAST, BY PAYMENT MODEL, 2019-2035 (USD Billions)
    633. Rest
    634. of MEA Ride Sharing Market SIZE ESTIMATES & FORECAST, BY REGIONAL, 2019-2035
    635. (USD Billions)
    636. PRODUCT LAUNCH/PRODUCT DEVELOPMENT/APPROVAL
    637. ACQUISITION/PARTNERSHIP
    638. LIST
    639. Of figures
    640. MARKET SYNOPSIS
    641. NORTH
    642. AMERICA RIDE SHARING MARKET ANALYSIS
    643. US RIDE SHARING
    644. MARKET ANALYSIS BY SERVICE MODEL
    645. US RIDE SHARING MARKET
    646. ANALYSIS BY VEHICLE TYPE
    647. US RIDE SHARING MARKET ANALYSIS
    648. BY RIDE TYPE
    649. US RIDE SHARING MARKET ANALYSIS BY PAYMENT
    650. MODEL
    651. US RIDE SHARING MARKET ANALYSIS BY REGIONAL
    652. CANADA
    653. RIDE SHARING MARKET ANALYSIS BY SERVICE MODEL
    654. CANADA
    655. RIDE SHARING MARKET ANALYSIS BY VEHICLE TYPE
    656. CANADA RIDE
    657. SHARING MARKET ANALYSIS BY RIDE TYPE
    658. CANADA RIDE SHARING
    659. MARKET ANALYSIS BY PAYMENT MODEL
    660. CANADA RIDE SHARING
    661. MARKET ANALYSIS BY REGIONAL
    662. EUROPE RIDE SHARING MARKET
    663. ANALYSIS
    664. GERMANY RIDE SHARING MARKET ANALYSIS BY SERVICE
    665. MODEL
    666. GERMANY RIDE SHARING MARKET ANALYSIS BY VEHICLE
    667. TYPE
    668. GERMANY RIDE SHARING MARKET ANALYSIS BY RIDE TYPE
    669. GERMANY
    670. RIDE SHARING MARKET ANALYSIS BY PAYMENT MODEL
    671. GERMANY
    672. RIDE SHARING MARKET ANALYSIS BY REGIONAL
    673. UK RIDE SHARING
    674. MARKET ANALYSIS BY SERVICE MODEL
    675. UK RIDE SHARING MARKET
    676. ANALYSIS BY VEHICLE TYPE
    677. UK RIDE SHARING MARKET ANALYSIS
    678. BY RIDE TYPE
    679. UK RIDE SHARING MARKET ANALYSIS BY PAYMENT
    680. MODEL
    681. UK RIDE SHARING MARKET ANALYSIS BY REGIONAL
    682. FRANCE
    683. RIDE SHARING MARKET ANALYSIS BY SERVICE MODEL
    684. FRANCE
    685. RIDE SHARING MARKET ANALYSIS BY VEHICLE TYPE
    686. FRANCE RIDE
    687. SHARING MARKET ANALYSIS BY RIDE TYPE
    688. FRANCE RIDE SHARING
    689. MARKET ANALYSIS BY PAYMENT MODEL
    690. FRANCE RIDE SHARING
    691. MARKET ANALYSIS BY REGIONAL
    692. RUSSIA RIDE SHARING MARKET
    693. ANALYSIS BY SERVICE MODEL
    694. RUSSIA RIDE SHARING MARKET
    695. ANALYSIS BY VEHICLE TYPE
    696. RUSSIA RIDE SHARING MARKET ANALYSIS
    697. BY RIDE TYPE
    698. RUSSIA RIDE SHARING MARKET ANALYSIS BY PAYMENT
    699. MODEL
    700. RUSSIA RIDE SHARING MARKET ANALYSIS BY REGIONAL
    701. ITALY
    702. RIDE SHARING MARKET ANALYSIS BY SERVICE MODEL
    703. ITALY RIDE
    704. SHARING MARKET ANALYSIS BY VEHICLE TYPE
    705. ITALY RIDE SHARING
    706. MARKET ANALYSIS BY RIDE TYPE
    707. ITALY RIDE SHARING MARKET
    708. ANALYSIS BY PAYMENT MODEL
    709. ITALY RIDE SHARING MARKET ANALYSIS
    710. BY REGIONAL
    711. SPAIN RIDE SHARING MARKET ANALYSIS BY SERVICE
    712. MODEL
    713. SPAIN RIDE SHARING MARKET ANALYSIS BY VEHICLE TYPE
    714. SPAIN
    715. RIDE SHARING MARKET ANALYSIS BY RIDE TYPE
    716. SPAIN RIDE
    717. SHARING MARKET ANALYSIS BY PAYMENT MODEL
    718. SPAIN RIDE SHARING
    719. MARKET ANALYSIS BY REGIONAL
    720. REST OF EUROPE RIDE SHARING
    721. MARKET ANALYSIS BY SERVICE MODEL
    722. REST OF EUROPE RIDE
    723. SHARING MARKET ANALYSIS BY VEHICLE TYPE
    724. REST OF EUROPE
    725. RIDE SHARING MARKET ANALYSIS BY RIDE TYPE
    726. REST OF EUROPE
    727. RIDE SHARING MARKET ANALYSIS BY PAYMENT MODEL
    728. REST OF
    729. EUROPE RIDE SHARING MARKET ANALYSIS BY REGIONAL
    730. APAC
    731. RIDE SHARING MARKET ANALYSIS
    732. CHINA RIDE SHARING MARKET
    733. ANALYSIS BY SERVICE MODEL
    734. CHINA RIDE SHARING MARKET ANALYSIS
    735. BY VEHICLE TYPE
    736. CHINA RIDE SHARING MARKET ANALYSIS BY
    737. RIDE TYPE
    738. CHINA RIDE SHARING MARKET ANALYSIS BY PAYMENT
    739. MODEL
    740. CHINA RIDE SHARING MARKET ANALYSIS BY REGIONAL
    741. INDIA
    742. RIDE SHARING MARKET ANALYSIS BY SERVICE MODEL
    743. INDIA RIDE
    744. SHARING MARKET ANALYSIS BY VEHICLE TYPE
    745. INDIA RIDE SHARING
    746. MARKET ANALYSIS BY RIDE TYPE
    747. INDIA RIDE SHARING MARKET
    748. ANALYSIS BY PAYMENT MODEL
    749. INDIA RIDE SHARING MARKET ANALYSIS
    750. BY REGIONAL
    751. JAPAN RIDE SHARING MARKET ANALYSIS BY SERVICE
    752. MODEL
    753. JAPAN RIDE SHARING MARKET ANALYSIS BY VEHICLE TYPE
    754. JAPAN
    755. RIDE SHARING MARKET ANALYSIS BY RIDE TYPE
    756. JAPAN RIDE
    757. SHARING MARKET ANALYSIS BY PAYMENT MODEL
    758. JAPAN RIDE SHARING
    759. MARKET ANALYSIS BY REGIONAL
    760. SOUTH KOREA RIDE SHARING
    761. MARKET ANALYSIS BY SERVICE MODEL
    762. SOUTH KOREA RIDE SHARING
    763. MARKET ANALYSIS BY VEHICLE TYPE
    764. SOUTH KOREA RIDE SHARING
    765. MARKET ANALYSIS BY RIDE TYPE
    766. SOUTH KOREA RIDE SHARING
    767. MARKET ANALYSIS BY PAYMENT MODEL
    768. SOUTH KOREA RIDE SHARING
    769. MARKET ANALYSIS BY REGIONAL
    770. MALAYSIA RIDE SHARING MARKET
    771. ANALYSIS BY SERVICE MODEL
    772. MALAYSIA RIDE SHARING MARKET
    773. ANALYSIS BY VEHICLE TYPE
    774. MALAYSIA RIDE SHARING MARKET
    775. ANALYSIS BY RIDE TYPE
    776. MALAYSIA RIDE SHARING MARKET ANALYSIS
    777. BY PAYMENT MODEL
    778. MALAYSIA RIDE SHARING MARKET ANALYSIS
    779. BY REGIONAL
    780. THAILAND RIDE SHARING MARKET ANALYSIS BY
    781. SERVICE MODEL
    782. THAILAND RIDE SHARING MARKET ANALYSIS BY
    783. VEHICLE TYPE
    784. THAILAND RIDE SHARING MARKET ANALYSIS BY
    785. RIDE TYPE
    786. THAILAND RIDE SHARING MARKET ANALYSIS BY PAYMENT
    787. MODEL
    788. THAILAND RIDE SHARING MARKET ANALYSIS BY REGIONAL
    789. INDONESIA
    790. RIDE SHARING MARKET ANALYSIS BY SERVICE MODEL
    791. INDONESIA
    792. RIDE SHARING MARKET ANALYSIS BY VEHICLE TYPE
    793. INDONESIA
    794. RIDE SHARING MARKET ANALYSIS BY RIDE TYPE
    795. INDONESIA RIDE
    796. SHARING MARKET ANALYSIS BY PAYMENT MODEL
    797. INDONESIA RIDE
    798. SHARING MARKET ANALYSIS BY REGIONAL
    799. REST OF APAC RIDE
    800. SHARING MARKET ANALYSIS BY SERVICE MODEL
    801. REST OF APAC
    802. RIDE SHARING MARKET ANALYSIS BY VEHICLE TYPE
    803. REST OF
    804. APAC RIDE SHARING MARKET ANALYSIS BY RIDE TYPE
    805. REST OF
    806. APAC RIDE SHARING MARKET ANALYSIS BY PAYMENT MODEL
    807. REST
    808. OF APAC RIDE SHARING MARKET ANALYSIS BY REGIONAL
    809. SOUTH
    810. AMERICA RIDE SHARING MARKET ANALYSIS
    811. BRAZIL RIDE SHARING
    812. MARKET ANALYSIS BY SERVICE MODEL
    813. BRAZIL RIDE SHARING
    814. MARKET ANALYSIS BY VEHICLE TYPE
    815. BRAZIL RIDE SHARING MARKET
    816. ANALYSIS BY RIDE TYPE
    817. BRAZIL RIDE SHARING MARKET ANALYSIS
    818. BY PAYMENT MODEL
    819. BRAZIL RIDE SHARING MARKET ANALYSIS
    820. BY REGIONAL
    821. MEXICO RIDE SHARING MARKET ANALYSIS BY SERVICE
    822. MODEL
    823. MEXICO RIDE SHARING MARKET ANALYSIS BY VEHICLE
    824. TYPE
    825. MEXICO RIDE SHARING MARKET ANALYSIS BY RIDE TYPE
    826. MEXICO
    827. RIDE SHARING MARKET ANALYSIS BY PAYMENT MODEL
    828. MEXICO
    829. RIDE SHARING MARKET ANALYSIS BY REGIONAL
    830. ARGENTINA RIDE
    831. SHARING MARKET ANALYSIS BY SERVICE MODEL
    832. ARGENTINA RIDE
    833. SHARING MARKET ANALYSIS BY VEHICLE TYPE
    834. ARGENTINA RIDE
    835. SHARING MARKET ANALYSIS BY RIDE TYPE
    836. ARGENTINA RIDE SHARING
    837. MARKET ANALYSIS BY PAYMENT MODEL
    838. ARGENTINA RIDE SHARING
    839. MARKET ANALYSIS BY REGIONAL
    840. REST OF SOUTH AMERICA RIDE
    841. SHARING MARKET ANALYSIS BY SERVICE MODEL
    842. REST OF SOUTH
    843. AMERICA RIDE SHARING MARKET ANALYSIS BY VEHICLE TYPE
    844. REST
    845. OF SOUTH AMERICA RIDE SHARING MARKET ANALYSIS BY RIDE TYPE
    846. REST
    847. OF SOUTH AMERICA RIDE SHARING MARKET ANALYSIS BY PAYMENT MODEL
    848. REST
    849. OF SOUTH AMERICA RIDE SHARING MARKET ANALYSIS BY REGIONAL
    850. MEA
    851. RIDE SHARING MARKET ANALYSIS
    852. GCC COUNTRIES RIDE SHARING
    853. MARKET ANALYSIS BY SERVICE MODEL
    854. GCC COUNTRIES RIDE SHARING
    855. MARKET ANALYSIS BY VEHICLE TYPE
    856. GCC COUNTRIES RIDE SHARING
    857. MARKET ANALYSIS BY RIDE TYPE
    858. GCC COUNTRIES RIDE SHARING
    859. MARKET ANALYSIS BY PAYMENT MODEL
    860. GCC COUNTRIES RIDE SHARING
    861. MARKET ANALYSIS BY REGIONAL
    862. SOUTH AFRICA RIDE SHARING
    863. MARKET ANALYSIS BY SERVICE MODEL
    864. SOUTH AFRICA RIDE SHARING
    865. MARKET ANALYSIS BY VEHICLE TYPE
    866. SOUTH AFRICA RIDE SHARING
    867. MARKET ANALYSIS BY RIDE TYPE
    868. SOUTH AFRICA RIDE SHARING
    869. MARKET ANALYSIS BY PAYMENT MODEL
    870. SOUTH AFRICA RIDE SHARING
    871. MARKET ANALYSIS BY REGIONAL
    872. REST OF MEA RIDE SHARING
    873. MARKET ANALYSIS BY SERVICE MODEL
    874. REST OF MEA RIDE SHARING
    875. MARKET ANALYSIS BY VEHICLE TYPE
    876. REST OF MEA RIDE SHARING
    877. MARKET ANALYSIS BY RIDE TYPE
    878. REST OF MEA RIDE SHARING
    879. MARKET ANALYSIS BY PAYMENT MODEL
    880. REST OF MEA RIDE SHARING
    881. MARKET ANALYSIS BY REGIONAL
    882. KEY BUYING CRITERIA OF RIDE
    883. SHARING MARKET
    884. RESEARCH PROCESS OF MRFR
    885. DRO
    886. ANALYSIS OF RIDE SHARING MARKET
    887. DRIVERS IMPACT ANALYSIS:
    888. RIDE SHARING MARKET
    889. RESTRAINTS IMPACT ANALYSIS: RIDE
    890. SHARING MARKET
    891. SUPPLY / VALUE CHAIN: RIDE SHARING MARKET
    892. RIDE
    893. SHARING MARKET, BY SERVICE MODEL, 2025 (% SHARE)
    894. RIDE
    895. SHARING MARKET, BY SERVICE MODEL, 2019 TO 2035 (USD Billions)
    896. RIDE
    897. SHARING MARKET, BY VEHICLE TYPE, 2025 (% SHARE)
    898. RIDE
    899. SHARING MARKET, BY VEHICLE TYPE, 2019 TO 2035 (USD Billions)
    900. RIDE
    901. SHARING MARKET, BY RIDE TYPE, 2025 (% SHARE)
    902. RIDE SHARING
    903. MARKET, BY RIDE TYPE, 2019 TO 2035 (USD Billions)
    904. RIDE
    905. SHARING MARKET, BY PAYMENT MODEL, 2025 (% SHARE)
    906. RIDE
    907. SHARING MARKET, BY PAYMENT MODEL, 2019 TO 2035 (USD Billions)
    908. RIDE
    909. SHARING MARKET, BY REGIONAL, 2025 (% SHARE)
    910. RIDE SHARING
    911. MARKET, BY REGIONAL, 2019 TO 2035 (USD Billions)
    912. BENCHMARKING
    913. OF MAJOR COMPETITORS

    Ride Sharing Market Segmentation

    • Ride Sharing Market By Service Model (USD Billion, 2019-2035)

      • Peer-to-Peer
      • Business-to-Consumer
      • Business-to-Business
    • Ride Sharing Market By Vehicle Type (USD Billion, 2019-2035)

      • Sedan
      • SUV
      • Minivan
      • Luxury Car
    • Ride Sharing Market By Ride Type (USD Billion, 2019-2035)

      • Pooling
      • Private
      • Luxury
    • Ride Sharing Market By Payment Model (USD Billion, 2019-2035)

      • Pay-as-You-Go
      • Subscription-based
      • On-Demand
    • Ride Sharing Market By Regional (USD Billion, 2019-2035)

      • North America
      • Europe
      • South America
      • Asia Pacific
      • Middle East and Africa

    Ride Sharing Market Regional Outlook (USD Billion, 2019-2035)

    • North America Outlook (USD Billion, 2019-2035)

      • North America Ride Sharing Market by Service Model Type

        • Peer-to-Peer
        • Business-to-Consumer
        • Business-to-Business
      • North America Ride Sharing Market by Vehicle Type

        • Sedan
        • SUV
        • Minivan
        • Luxury Car
      • North America Ride Sharing Market by Ride Type

        • Pooling
        • Private
        • Luxury
      • North America Ride Sharing Market by Payment Model Type

        • Pay-as-You-Go
        • Subscription-based
        • On-Demand
      • North America Ride Sharing Market by Regional Type

        • US
        • Canada
      • US Outlook (USD Billion, 2019-2035)
      • US Ride Sharing Market by Service Model Type

        • Peer-to-Peer
        • Business-to-Consumer
        • Business-to-Business
      • US Ride Sharing Market by Vehicle Type

        • Sedan
        • SUV
        • Minivan
        • Luxury Car
      • US Ride Sharing Market by Ride Type

        • Pooling
        • Private
        • Luxury
      • US Ride Sharing Market by Payment Model Type

        • Pay-as-You-Go
        • Subscription-based
        • On-Demand
      • CANADA Outlook (USD Billion, 2019-2035)
      • CANADA Ride Sharing Market by Service Model Type

        • Peer-to-Peer
        • Business-to-Consumer
        • Business-to-Business
      • CANADA Ride Sharing Market by Vehicle Type

        • Sedan
        • SUV
        • Minivan
        • Luxury Car
      • CANADA Ride Sharing Market by Ride Type

        • Pooling
        • Private
        • Luxury
      • CANADA Ride Sharing Market by Payment Model Type

        • Pay-as-You-Go
        • Subscription-based
        • On-Demand
    • Europe Outlook (USD Billion, 2019-2035)

      • Europe Ride Sharing Market by Service Model Type

        • Peer-to-Peer
        • Business-to-Consumer
        • Business-to-Business
      • Europe Ride Sharing Market by Vehicle Type

        • Sedan
        • SUV
        • Minivan
        • Luxury Car
      • Europe Ride Sharing Market by Ride Type

        • Pooling
        • Private
        • Luxury
      • Europe Ride Sharing Market by Payment Model Type

        • Pay-as-You-Go
        • Subscription-based
        • On-Demand
      • Europe Ride Sharing Market by Regional Type

        • Germany
        • UK
        • France
        • Russia
        • Italy
        • Spain
        • Rest of Europe
      • GERMANY Outlook (USD Billion, 2019-2035)
      • GERMANY Ride Sharing Market by Service Model Type

        • Peer-to-Peer
        • Business-to-Consumer
        • Business-to-Business
      • GERMANY Ride Sharing Market by Vehicle Type

        • Sedan
        • SUV
        • Minivan
        • Luxury Car
      • GERMANY Ride Sharing Market by Ride Type

        • Pooling
        • Private
        • Luxury
      • GERMANY Ride Sharing Market by Payment Model Type

        • Pay-as-You-Go
        • Subscription-based
        • On-Demand
      • UK Outlook (USD Billion, 2019-2035)
      • UK Ride Sharing Market by Service Model Type

        • Peer-to-Peer
        • Business-to-Consumer
        • Business-to-Business
      • UK Ride Sharing Market by Vehicle Type

        • Sedan
        • SUV
        • Minivan
        • Luxury Car
      • UK Ride Sharing Market by Ride Type

        • Pooling
        • Private
        • Luxury
      • UK Ride Sharing Market by Payment Model Type

        • Pay-as-You-Go
        • Subscription-based
        • On-Demand
      • FRANCE Outlook (USD Billion, 2019-2035)
      • FRANCE Ride Sharing Market by Service Model Type

        • Peer-to-Peer
        • Business-to-Consumer
        • Business-to-Business
      • FRANCE Ride Sharing Market by Vehicle Type

        • Sedan
        • SUV
        • Minivan
        • Luxury Car
      • FRANCE Ride Sharing Market by Ride Type

        • Pooling
        • Private
        • Luxury
      • FRANCE Ride Sharing Market by Payment Model Type

        • Pay-as-You-Go
        • Subscription-based
        • On-Demand
      • RUSSIA Outlook (USD Billion, 2019-2035)
      • RUSSIA Ride Sharing Market by Service Model Type

        • Peer-to-Peer
        • Business-to-Consumer
        • Business-to-Business
      • RUSSIA Ride Sharing Market by Vehicle Type

        • Sedan
        • SUV
        • Minivan
        • Luxury Car
      • RUSSIA Ride Sharing Market by Ride Type

        • Pooling
        • Private
        • Luxury
      • RUSSIA Ride Sharing Market by Payment Model Type

        • Pay-as-You-Go
        • Subscription-based
        • On-Demand
      • ITALY Outlook (USD Billion, 2019-2035)
      • ITALY Ride Sharing Market by Service Model Type

        • Peer-to-Peer
        • Business-to-Consumer
        • Business-to-Business
      • ITALY Ride Sharing Market by Vehicle Type

        • Sedan
        • SUV
        • Minivan
        • Luxury Car
      • ITALY Ride Sharing Market by Ride Type

        • Pooling
        • Private
        • Luxury
      • ITALY Ride Sharing Market by Payment Model Type

        • Pay-as-You-Go
        • Subscription-based
        • On-Demand
      • SPAIN Outlook (USD Billion, 2019-2035)
      • SPAIN Ride Sharing Market by Service Model Type

        • Peer-to-Peer
        • Business-to-Consumer
        • Business-to-Business
      • SPAIN Ride Sharing Market by Vehicle Type

        • Sedan
        • SUV
        • Minivan
        • Luxury Car
      • SPAIN Ride Sharing Market by Ride Type

        • Pooling
        • Private
        • Luxury
      • SPAIN Ride Sharing Market by Payment Model Type

        • Pay-as-You-Go
        • Subscription-based
        • On-Demand
      • REST OF EUROPE Outlook (USD Billion, 2019-2035)
      • REST OF EUROPE Ride Sharing Market by Service Model Type

        • Peer-to-Peer
        • Business-to-Consumer
        • Business-to-Business
      • REST OF EUROPE Ride Sharing Market by Vehicle Type

        • Sedan
        • SUV
        • Minivan
        • Luxury Car
      • REST OF EUROPE Ride Sharing Market by Ride Type

        • Pooling
        • Private
        • Luxury
      • REST OF EUROPE Ride Sharing Market by Payment Model Type

        • Pay-as-You-Go
        • Subscription-based
        • On-Demand
    • APAC Outlook (USD Billion, 2019-2035)

      • APAC Ride Sharing Market by Service Model Type

        • Peer-to-Peer
        • Business-to-Consumer
        • Business-to-Business
      • APAC Ride Sharing Market by Vehicle Type

        • Sedan
        • SUV
        • Minivan
        • Luxury Car
      • APAC Ride Sharing Market by Ride Type

        • Pooling
        • Private
        • Luxury
      • APAC Ride Sharing Market by Payment Model Type

        • Pay-as-You-Go
        • Subscription-based
        • On-Demand
      • APAC Ride Sharing Market by Regional Type

        • China
        • India
        • Japan
        • South Korea
        • Malaysia
        • Thailand
        • Indonesia
        • Rest of APAC
      • CHINA Outlook (USD Billion, 2019-2035)
      • CHINA Ride Sharing Market by Service Model Type

        • Peer-to-Peer
        • Business-to-Consumer
        • Business-to-Business
      • CHINA Ride Sharing Market by Vehicle Type

        • Sedan
        • SUV
        • Minivan
        • Luxury Car
      • CHINA Ride Sharing Market by Ride Type

        • Pooling
        • Private
        • Luxury
      • CHINA Ride Sharing Market by Payment Model Type

        • Pay-as-You-Go
        • Subscription-based
        • On-Demand
      • INDIA Outlook (USD Billion, 2019-2035)
      • INDIA Ride Sharing Market by Service Model Type

        • Peer-to-Peer
        • Business-to-Consumer
        • Business-to-Business
      • INDIA Ride Sharing Market by Vehicle Type

        • Sedan
        • SUV
        • Minivan
        • Luxury Car
      • INDIA Ride Sharing Market by Ride Type

        • Pooling
        • Private
        • Luxury
      • INDIA Ride Sharing Market by Payment Model Type

        • Pay-as-You-Go
        • Subscription-based
        • On-Demand
      • JAPAN Outlook (USD Billion, 2019-2035)
      • JAPAN Ride Sharing Market by Service Model Type

        • Peer-to-Peer
        • Business-to-Consumer
        • Business-to-Business
      • JAPAN Ride Sharing Market by Vehicle Type

        • Sedan
        • SUV
        • Minivan
        • Luxury Car
      • JAPAN Ride Sharing Market by Ride Type

        • Pooling
        • Private
        • Luxury
      • JAPAN Ride Sharing Market by Payment Model Type

        • Pay-as-You-Go
        • Subscription-based
        • On-Demand
      • SOUTH KOREA Outlook (USD Billion, 2019-2035)
      • SOUTH KOREA Ride Sharing Market by Service Model Type

        • Peer-to-Peer
        • Business-to-Consumer
        • Business-to-Business
      • SOUTH KOREA Ride Sharing Market by Vehicle Type

        • Sedan
        • SUV
        • Minivan
        • Luxury Car
      • SOUTH KOREA Ride Sharing Market by Ride Type

        • Pooling
        • Private
        • Luxury
      • SOUTH KOREA Ride Sharing Market by Payment Model Type

        • Pay-as-You-Go
        • Subscription-based
        • On-Demand
      • MALAYSIA Outlook (USD Billion, 2019-2035)
      • MALAYSIA Ride Sharing Market by Service Model Type

        • Peer-to-Peer
        • Business-to-Consumer
        • Business-to-Business
      • MALAYSIA Ride Sharing Market by Vehicle Type

        • Sedan
        • SUV
        • Minivan
        • Luxury Car
      • MALAYSIA Ride Sharing Market by Ride Type

        • Pooling
        • Private
        • Luxury
      • MALAYSIA Ride Sharing Market by Payment Model Type

        • Pay-as-You-Go
        • Subscription-based
        • On-Demand
      • THAILAND Outlook (USD Billion, 2019-2035)
      • THAILAND Ride Sharing Market by Service Model Type

        • Peer-to-Peer
        • Business-to-Consumer
        • Business-to-Business
      • THAILAND Ride Sharing Market by Vehicle Type

        • Sedan
        • SUV
        • Minivan
        • Luxury Car
      • THAILAND Ride Sharing Market by Ride Type

        • Pooling
        • Private
        • Luxury
      • THAILAND Ride Sharing Market by Payment Model Type

        • Pay-as-You-Go
        • Subscription-based
        • On-Demand
      • INDONESIA Outlook (USD Billion, 2019-2035)
      • INDONESIA Ride Sharing Market by Service Model Type

        • Peer-to-Peer
        • Business-to-Consumer
        • Business-to-Business
      • INDONESIA Ride Sharing Market by Vehicle Type

        • Sedan
        • SUV
        • Minivan
        • Luxury Car
      • INDONESIA Ride Sharing Market by Ride Type

        • Pooling
        • Private
        • Luxury
      • INDONESIA Ride Sharing Market by Payment Model Type

        • Pay-as-You-Go
        • Subscription-based
        • On-Demand
      • REST OF APAC Outlook (USD Billion, 2019-2035)
      • REST OF APAC Ride Sharing Market by Service Model Type

        • Peer-to-Peer
        • Business-to-Consumer
        • Business-to-Business
      • REST OF APAC Ride Sharing Market by Vehicle Type

        • Sedan
        • SUV
        • Minivan
        • Luxury Car
      • REST OF APAC Ride Sharing Market by Ride Type

        • Pooling
        • Private
        • Luxury
      • REST OF APAC Ride Sharing Market by Payment Model Type

        • Pay-as-You-Go
        • Subscription-based
        • On-Demand
    • South America Outlook (USD Billion, 2019-2035)

      • South America Ride Sharing Market by Service Model Type

        • Peer-to-Peer
        • Business-to-Consumer
        • Business-to-Business
      • South America Ride Sharing Market by Vehicle Type

        • Sedan
        • SUV
        • Minivan
        • Luxury Car
      • South America Ride Sharing Market by Ride Type

        • Pooling
        • Private
        • Luxury
      • South America Ride Sharing Market by Payment Model Type

        • Pay-as-You-Go
        • Subscription-based
        • On-Demand
      • South America Ride Sharing Market by Regional Type

        • Brazil
        • Mexico
        • Argentina
        • Rest of South America
      • BRAZIL Outlook (USD Billion, 2019-2035)
      • BRAZIL Ride Sharing Market by Service Model Type

        • Peer-to-Peer
        • Business-to-Consumer
        • Business-to-Business
      • BRAZIL Ride Sharing Market by Vehicle Type

        • Sedan
        • SUV
        • Minivan
        • Luxury Car
      • BRAZIL Ride Sharing Market by Ride Type

        • Pooling
        • Private
        • Luxury
      • BRAZIL Ride Sharing Market by Payment Model Type

        • Pay-as-You-Go
        • Subscription-based
        • On-Demand
      • MEXICO Outlook (USD Billion, 2019-2035)
      • MEXICO Ride Sharing Market by Service Model Type

        • Peer-to-Peer
        • Business-to-Consumer
        • Business-to-Business
      • MEXICO Ride Sharing Market by Vehicle Type

        • Sedan
        • SUV
        • Minivan
        • Luxury Car
      • MEXICO Ride Sharing Market by Ride Type

        • Pooling
        • Private
        • Luxury
      • MEXICO Ride Sharing Market by Payment Model Type

        • Pay-as-You-Go
        • Subscription-based
        • On-Demand
      • ARGENTINA Outlook (USD Billion, 2019-2035)
      • ARGENTINA Ride Sharing Market by Service Model Type

        • Peer-to-Peer
        • Business-to-Consumer
        • Business-to-Business
      • ARGENTINA Ride Sharing Market by Vehicle Type

        • Sedan
        • SUV
        • Minivan
        • Luxury Car
      • ARGENTINA Ride Sharing Market by Ride Type

        • Pooling
        • Private
        • Luxury
      • ARGENTINA Ride Sharing Market by Payment Model Type

        • Pay-as-You-Go
        • Subscription-based
        • On-Demand
      • REST OF SOUTH AMERICA Outlook (USD Billion, 2019-2035)
      • REST OF SOUTH AMERICA Ride Sharing Market by Service Model Type

        • Peer-to-Peer
        • Business-to-Consumer
        • Business-to-Business
      • REST OF SOUTH AMERICA Ride Sharing Market by Vehicle Type

        • Sedan
        • SUV
        • Minivan
        • Luxury Car
      • REST OF SOUTH AMERICA Ride Sharing Market by Ride Type

        • Pooling
        • Private
        • Luxury
      • REST OF SOUTH AMERICA Ride Sharing Market by Payment Model Type

        • Pay-as-You-Go
        • Subscription-based
        • On-Demand
    • MEA Outlook (USD Billion, 2019-2035)

      • MEA Ride Sharing Market by Service Model Type

        • Peer-to-Peer
        • Business-to-Consumer
        • Business-to-Business
      • MEA Ride Sharing Market by Vehicle Type

        • Sedan
        • SUV
        • Minivan
        • Luxury Car
      • MEA Ride Sharing Market by Ride Type

        • Pooling
        • Private
        • Luxury
      • MEA Ride Sharing Market by Payment Model Type

        • Pay-as-You-Go
        • Subscription-based
        • On-Demand
      • MEA Ride Sharing Market by Regional Type

        • GCC Countries
        • South Africa
        • Rest of MEA
      • GCC COUNTRIES Outlook (USD Billion, 2019-2035)
      • GCC COUNTRIES Ride Sharing Market by Service Model Type

        • Peer-to-Peer
        • Business-to-Consumer
        • Business-to-Business
      • GCC COUNTRIES Ride Sharing Market by Vehicle Type

        • Sedan
        • SUV
        • Minivan
        • Luxury Car
      • GCC COUNTRIES Ride Sharing Market by Ride Type

        • Pooling
        • Private
        • Luxury
      • GCC COUNTRIES Ride Sharing Market by Payment Model Type

        • Pay-as-You-Go
        • Subscription-based
        • On-Demand
      • SOUTH AFRICA Outlook (USD Billion, 2019-2035)
      • SOUTH AFRICA Ride Sharing Market by Service Model Type

        • Peer-to-Peer
        • Business-to-Consumer
        • Business-to-Business
      • SOUTH AFRICA Ride Sharing Market by Vehicle Type

        • Sedan
        • SUV
        • Minivan
        • Luxury Car
      • SOUTH AFRICA Ride Sharing Market by Ride Type

        • Pooling
        • Private
        • Luxury
      • SOUTH AFRICA Ride Sharing Market by Payment Model Type

        • Pay-as-You-Go
        • Subscription-based
        • On-Demand
      • REST OF MEA Outlook (USD Billion, 2019-2035)
      • REST OF MEA Ride Sharing Market by Service Model Type

        • Peer-to-Peer
        • Business-to-Consumer
        • Business-to-Business
      • REST OF MEA Ride Sharing Market by Vehicle Type

        • Sedan
        • SUV
        • Minivan
        • Luxury Car
      • REST OF MEA Ride Sharing Market by Ride Type

        • Pooling
        • Private
        • Luxury
      • REST OF MEA Ride Sharing Market by Payment Model Type

        • Pay-as-You-Go
        • Subscription-based
        • On-Demand
    Ride Sharing Market Research Report – Global Forecast till 2035 Infographic
    Free Sample Request

    Kindly complete the form below to receive a free sample of this Report

    Customer Strories

    “I am very pleased with how market segments have been defined in a relevant way for my purposes (such as "Portable Freezers & refrigerators" and "last-mile"). In general the report is well structured. Thanks very much for your efforts.”

    Victoria Milne Founder
    Case Study

    Chemicals and Materials