• Cat-intel
  • MedIntelliX
  • Resources
  • About Us
  • Request Free Sample ×

    Kindly complete the form below to receive a free sample of this Report

    Leading companies partner with us for data-driven Insights

    clients tt-cursor

    Public Transport Market

    ID: MRFR/AM/7205-CR
    195 Pages
    Sejal Akre
    January 2025

    Public Transport Market Research Report Information by Mobility (Bus, Tram, Train, Car Sharing, and Others), By Propulsion (Diesel, Gasoline, Electric, and Others) By Ownership Type (Private Owned, and Public Owned) By End Use (Intracity, Intercity, and Others) and By Region (North America, Europe, Asia-Pacific, Middle East and Africa, South America) – Market Forecast Till 2032

    Share:
    Download PDF ×

    We do not share your information with anyone. However, we may send you emails based on your report interest from time to time. You may contact us at any time to opt-out.

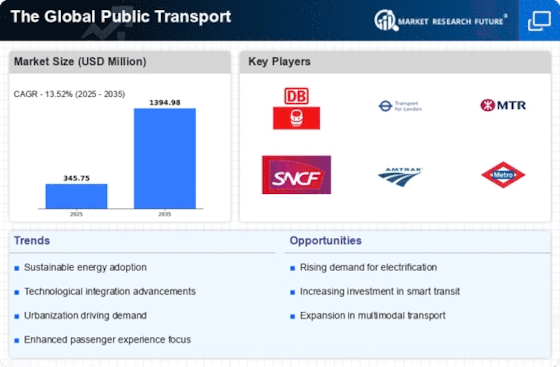
    Public Transport Market Research Report - Global Forecast till 2032 Infographic
    Purchase Options
    $ 4,950.0
    $ 5,950.0
    $ 7,250.0
    Table of Contents

    Public Transport Market Summary

    As per Market Research Future Analysis, the Global Public Transport Market was valued at USD 2,67,300.19 million in 2023 and is projected to grow to USD 4,33,249.56 million by 2032, reflecting a CAGR of 5.57% from 2023 to 2032. The market is influenced by urbanization, technological advancements, and environmental concerns, leading to increased demand for efficient mass transportation. The shift towards electric and hybrid vehicles is notable, with electric buses and trains being deployed to meet sustainability goals. The market is characterized by a significant presence of private operators, with buses holding the largest share of the mobility segment. The Asia-Pacific region commands a substantial market share, driven by urban growth and government initiatives to reduce emissions.

    Key Market Trends & Highlights

    Key trends shaping the Public Transport Market include technological advancements and a shift towards sustainable transport solutions.

    • Public Transport Market Size in 2023: USD 2,67,300.19 million.
    • Projected Market Size by 2032: USD 4,33,249.56 million.
    • CAGR from 2023 to 2032: 5.57%.
    • Asia-Pacific Market Share in 2023: Approximately 34.58%.

    Market Size & Forecast

    2023 Market Size USD 2,67,300.19 million
    2032 Market Size USD 4,33,249.56 million
    CAGR 5.57%

    Major Players

    Key Companies include Metropolitan Transportation Authority, Transport for London, MRT Corporation, Chicago Transit Authority, and Madrid Metro.

    Public Transport Market Trends

    The ongoing evolution of urban mobility solutions indicates a growing emphasis on sustainable public transport systems that prioritize efficiency and accessibility.

    U.S. Department of Transportation

    Public Transport Market Drivers

    Market Growth Projections

    The Global Public Transport Market Industry is poised for substantial growth, with projections indicating a market value of 280.9 USD Billion in 2024 and an anticipated increase to 509.8 USD Billion by 2035. This growth trajectory suggests a compound annual growth rate of 5.57 percent from 2025 to 2035. Factors contributing to this expansion include urbanization, government investments, and technological advancements. The market's evolution reflects a broader trend towards sustainable and efficient public transport systems that cater to the needs of growing urban populations. As cities continue to develop, the demand for innovative public transport solutions is expected to rise.

    Technological Advancements

    Technological advancements are transforming the Global Public Transport Market Industry, enhancing efficiency and user experience. Innovations such as smart ticketing systems, real-time tracking, and electric vehicles are becoming increasingly prevalent. These technologies not only improve operational efficiency but also attract more users to public transport systems. The integration of data analytics and artificial intelligence into transport management systems is expected to optimize routes and reduce operational costs. As a result, the market is likely to witness a compound annual growth rate of 5.57 percent from 2025 to 2035, indicating a robust shift towards tech-driven public transport solutions.

    Changing Consumer Preferences

    Changing consumer preferences are reshaping the Global Public Transport Market Industry. As urban populations grow, there is a noticeable shift towards public transport as a preferred mode of commuting. Factors such as convenience, cost-effectiveness, and environmental impact are driving this change. Younger generations, in particular, are more inclined to utilize public transport over personal vehicles, reflecting a broader cultural shift towards sustainability. This trend is likely to contribute to the market's growth, with an anticipated value of 280.9 USD Billion by 2024. Public transport systems that adapt to these preferences by offering enhanced services and amenities may capture a larger share of the market.

    Urbanization and Population Growth

    The Global Public Transport Market Industry is experiencing a surge driven by rapid urbanization and population growth. As cities expand, the demand for efficient public transport systems intensifies. By 2024, the market is projected to reach 280.9 USD Billion, reflecting the increasing need for sustainable transport solutions. Urban areas are expected to house over 68 percent of the global population by 2050, necessitating robust public transport infrastructure. This trend indicates a shift towards integrated transport systems that can accommodate growing urban populations while reducing congestion and pollution, thereby enhancing the overall quality of urban life.

    Government Initiatives and Investments

    Government initiatives play a pivotal role in shaping the Global Public Transport Market Industry. Various countries are investing heavily in public transport infrastructure to promote sustainability and reduce traffic congestion. For instance, initiatives such as the European Union's Green Deal aim to enhance public transport systems across member states. These investments are likely to drive the market towards an estimated value of 509.8 USD Billion by 2035. Furthermore, governments are increasingly adopting policies that encourage the use of public transport, such as subsidies and tax incentives, which may further stimulate market growth and improve service accessibility.

    Environmental Concerns and Sustainability

    Growing environmental concerns are significantly influencing the Global Public Transport Market Industry. As awareness of climate change and air pollution rises, there is an increasing push towards sustainable transport solutions. Public transport systems are viewed as a viable alternative to reduce carbon footprints and promote eco-friendly commuting. Many cities are adopting electric and hybrid buses, which contribute to lower emissions. This shift towards sustainability is expected to bolster the market, with projections indicating a growth to 509.8 USD Billion by 2035. The emphasis on green transport solutions aligns with global efforts to combat climate change and promote sustainable urban development.

    Market Segment Insights

    Public Transport Market Platform Segment Insights

    Public Transport Mobility Insights

    Based on Mobility, the Public Transport Market segmentation includes Bus, Tram, Train, Car Sharing, and Others. Bus holds the majority share in 2023, contributing around 35.18% to the market revenue. The bus transport segment is one of the most popular and easily available segments of public transportation currently used in different countries. Buses transport both the urban and rural people, and are affordable means especially for the daily commuters.

    Sometimes, these public buses are partly or fully funded from taxpayers’ money to allow the passengers to pay reasonable fares for transport services; public buses are therefore an essential component of public transport infrastructure; this is particularly so in growing urban areas that cannot support the use of private cars due to traffic hold-up and pollution.

    Public Transport Propulsion Insights

    Based on the Propulsion, the Public Transport Market segmentation is Diesel, Gasoline, Electric, and Others. Diesel dominated the market in 2023. Diesel propulsion has been one of the most popular systems in public transport for many years. It is very popular with buses, trains and trucks which require high torque for the long distances they travel with heavy loads, and for their fuel economy.

    Cars that run on diesel are especially profitable in the areas where the supporting structures of other types of fuel are still in the process of being created. Furthermore, diesel has been applied to intercity and rural transportation systems where people cover long distances frequently and the installation of charging stations or refueling points of other resources is costly.

    Public Transport Ownership Type Insights

    Based on the Ownership Type, the Public Transport Market segmentation is Private Owned, and Public Owned. Private Owned dominated the market in 2023. Private operated public transport systems are those managed in the hands of private individuals, companies or organizations who are mainly involved with an intention to make profits.

    These services include large bus fleet operations, taxis, ride-hailing companies, and at times rail. The companies operating them are usually private firms and are in a better position to determine the prices, or introduce new services, or expand as they wish.

    FIGURE 2: PUBLIC TRANSPORT MARKET, BY OWNERSHIP TYPE, 2023 VS 2032 (USD MILLION)

    PUBLIC TRANSPORT MARKET, BY OWNERSHIP TYPE, 2023 VS 2032

    Source: Secondary Research, Primary Research, Market Research Future Database, and Analyst Review

    Public Transport End-Use Insights

    Based on the End-Use, the Public Transport Market segmentation is Intracity, Intercity, and Others. Intracity dominated the market in 2023. Intercity public transport is a type of transport that is used to transport people within a city or metropolitan region is called intra-city or urban or local public transportation.

    This segment mainly includes transportation like buses, tram, metro rail, local train, ferries and in some cases it may also include ridesharing covers taxis or ride hailing like services. The primary objectives of intra-city public transport are to offer affordable means of transport to the people within a city in order to transport people from residential areas to places of work, schools, hospitals, theatres and other social facilities.

    Regional Insights

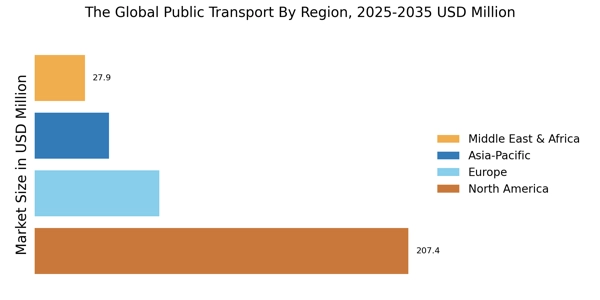
    By Region, the study provides market insights into North America, Europe, Asia-Pacific, Middle East and Africa and South America. In 2023, the Asia-Pacific Public Transport market commands a significant share of the global market at approximately 34.58%. Asia Pacific public transportation has recorded tremendous growth over the past years due to the increasing growth of urban setting, expansion of the population, and increasing concern for the environment.

    The Asian countries like China, India, Japan, and Australia dominate the market as these countries have huge people living in urban areas and government policies to cut down green house emission. The public transport in the region is of different category which includes buses, rails, ferries and metros.

    Although, the bus and railway segment stand out since they have a broad coverage and are more affordable. Smart transport technologies are being adopted by governments globally to deliver better customer satisfaction, cost effective solutions and security. For instance, the China boasts of having a wider coverage of high speed rail which forms a large part of the region’s public transportation.

    The public transport market in North America has undergone a number of changes in the recent past due to factors such as demographic factors, trend of urbanization, technological development, and effects of the natural environment. New York, Los Angeles, and Toronto are some of the most populous cities in the USA and Canada respectively and they all depend on public transport to meet the mobility demand of their increasingly urban residents.

    The market is predominantly defined by transit vehicles such as buses, subway, light rail, ferries, and Commuter trains, all of which have their part to play with regard to connectivity. The problems of congestion and pollution, which are associated with the growth of urbanization, have given importance to public transport systems. However, North America public transport systems are diverse and established in some cities though the gap is very big especially in less populated areas.

    FIGURE 3: PUBLIC TRANSPORT MARKET SIZE, BY REGION 2023 VS 2032

    PUBLIC TRANSPORT MARKET SIZE, BY REGION 2023 VS 2032

    Source: Secondary Research, Primary Research, Market Research Future Database, and Analyst Review

    Key Players and Competitive Insights

    The Public Transport Market is characterized by the presence of many global, regional, and local vendors. The market is highly competitive, with all the players competing to gain maximum market share. Competitors in the public transport market include a wide range of organizations whose key role is to provide means of transport for the working population.

    MTA is the most significant actor in New York, which is overseeing the transport system that comprises of subways and buses. MTR Corporation operates in Hong Kong, the most efficient and punctual transport system, offering rail and bus services. The Chicago Transit Authority (CTA) is one of the important public transport systems in Chicago while focusing on accessibility and high technology.

    Key Companies in the Public Transport Market market include

    Industry Developments

      • In September 2024, Transport for London (TfL) has announced the launch of a new e-bike scheme aimed at enhancing sustainable transport options across the city. This initiative is part of TfL's ongoing efforts to promote greener travel and reduce congestion on public transport.
      • In August 2024, MTR Corporation has announced enhanced train services with more frequent trips on the East Rail Line, Tseung Kwan O Line, and Tuen Ma Line during various periods. This improvement aims to provide better connectivity and convenience for passengers.

    Future Outlook

    Public Transport Market Future Outlook

    The Global Public Transport Market is poised for growth at 5.57% CAGR from 2024 to 2035, driven by urbanization, technological advancements, and sustainability initiatives.

    New opportunities lie in:

    • Invest in electric and hybrid vehicle fleets to enhance sustainability.
    • Develop integrated mobility platforms for seamless user experiences.
    • Leverage data analytics for optimizing route planning and operational efficiency.

    By 2035, the market is expected to exhibit robust growth, reflecting evolving transportation needs and technological integration.

    Market Segmentation

    Public Transport End Use Outlook

    • Intracity
    • Intercity
    • Others

    Public Transport Mobility Outlook

    • Bus
    • Tram
    • Train
    • Car Sharing
    • Others

    Public Transport Propulsion Outlook

    • Diesel
    • Gasoline
    • Electric
    • Others

    Public Transport Ownership Type Outlook

    • Private Owned
    • Public Owned

    Public Transport Market Regional Outlook

    North America
    • US
    • Canada
    • Mexico

    Report Scope

    Report Attribute/Metric Details
    Market Size 2022 USD 2,67,300.19 million
    Market Size 2023 USD 2,80,871.82 million
    Market Size 2032 USD 4,33,249.56 million
    Compound Annual Growth Rate (CAGR) 5.57% (2023-2032)
    Base Year 2023
    Market Forecast Period 2024-2032
    Historical Data 2019- 2022
    Market Forecast Units Value (USD Million)
    Report Coverage Revenue Forecast, Market Competitive Landscape, Growth Factors, and Trends
    Segments Covered Mobility, Propulsion, Ownership Type, End-User and Region.
    Geographies Covered Europe, North America, Asia-Pacific, Middle East and Africa, and South America.
    Countries Covered U.S. Canada Mexico Germany UK France Italy Spain China India Japan South Korea Saudi Arabia UAE South Africa Brazil Argentina And Others.
    Key Companies Profiled Metropolitan Transportation Authority, Transport for London, MRT Corporation, Chicago Transit Authority, Madrid Metro, and Others.
    Key Market Opportunities ·       Technological advancements improve operational efficiency and safety ·       Integration of smart technologies enhances user experience
    Key Market Dynamics ·       Increasing urbanization driving demand for efficient transport systems ·       Growing environmental concerns promoting sustainable transportation solutions

    Market Highlights

    Author
    Sejal Akre
    Senior Research Analyst

    She has over 5 years of rich experience, in market research and consulting providing valuable market insights to client. Hands on expertise in management consulting, and extensive knowledge in domain including ICT, Automotive & Transportation and Aerospace & Defense. She is skilled in Go-to market strategy, industry analysis, market sizing, in depth company profiling, competitive intelligence & benchmarking and value chain amongst others.

    Leave a Comment

    FAQs

    How much is the Public Transport market?

    The Public Transport Market size is expected to be valued at USD 2,67,300.19 Million in 2023.

    What is the growth rate of the Public Transport market?

    The global market is projected to grow at a CAGR of 5.57% during the forecast period, 2023-2032.

    Which region held the largest market share in the Public Transport market?

    Asia-Pacific had the largest share of the global market.

    Who are the key players in the Public Transport market?

    The key players in the market are Metropolitan Transportation Authority, Transport for London, MRT Corporation, Chicago Transit Authority, Madrid Metro.

    Which mobility segment led the Public Transport market?

    The “Bus” dominated the market in 2023.

    1. EXECUTIVE SUMMARY 20
      1. MARKET ATTRACTIVENESS
    2. ANALYSIS 21
      1. GLOBAL PUBLIC TRANSPORT MARKET, By Mobility 22
    3. GLOBAL PUBLIC TRANSPORT MARKET, By Propulsion 23
      1. GLOBAL PUBLIC TRANSPORT
    4. MARKET, By Ownership Type 24
      1. GLOBAL PUBLIC TRANSPORT MARKET, By End-Use
        1. GLOBAL PUBLIC TRANSPORT MARKET, BY region 26
    5. MARKET INTRODUCTION
      1. DEFINITION 28
      2. SCOPE OF THE STUDY 28
      3. RESEARCH OBJECTIVE
      4. MARKET STRUCTURE 30
      5. KEY BUYING CRITERIA 31
    6. RESEARCH
    7. METHODOLOGY 32
      1. OVERVIEW 32
      2. DATA FLOW 34
        1. Data Mining
    8. Process 35
      1. PURCHASED DATABASE: 36
      2. SECONDARY SOURCES: 37
    9. Secondary Research data flow: 38
      1. PRIMARY RESEARCH: 39
        1. Primary
    10. Research DATA FLOW: 40
      1. Primary Research: Number of Interviews conducted
        1. Primary Research: Regional Coverage 41
      2. APPROACHES FOR MARKET
    11. SIZE ESTIMATION: 42
      1. Consumption & Net Trade Approach 42
    12. Revenue Analysis Approach 42
      1. DATA FORECASTING 43
        1. Data forecasting
    13. Technique 43
      1. DATA MODELING 44
        1. microeconomic factor analysis:
        2. Data modeling: 46
      2. TEAMS AND ANALYST CONTRIBUTION 48
    14. MARKET DYNAMICS 50
      1. INTRODUCTION 50
      2. DRIVERS 51
        1. Increasing
    15. urbanization driving demand for efficient transport systems 51
      1. Growing
    16. environmental concerns promoting sustainable transportation solutions 53
    17. RESTRAINTS 54
      1. Aging public transport infrastructure requiring costly
    18. upgrades 54
      1. Competition from ride-sharing and personal vehicles 55
      2. OPPORTUNITY 56
        1. Technological advancements improve operational efficiency
    19. and safety 56
      1. Integration of smart technologies enhances user experience
      2. TECHNOLOGY TRENDS 58
        1. Electric and Hybrid Vehicles 58
    20. Autonomous Public Transport 59
      1. Mobility as a Service (MaaS) 59
    21. Smart Ticketing Systems 59
      1. Real-Time Data and Connectivity 60
    22. Sustainability and Green Initiatives 60
      1. Enhanced Passenger Experience
    23. through Technology 60
      1. Integration of Big Data and Analytics 60
    24. REGULATORY UPDATES 61
    25. MARKET FACTOR ANALYSIS 63
      1. VALUE CHAIN ANALYSIS
        1. Infrastructure Development 63
        2. Vehicle Procurement 63
        3. Operations Management 64
        4. Customer Service 64
      2. PORTER’S
    26. FIVE FORCES MODEL 65
      1. Threat of New Entrants 65
        1. Bargaining
    27. Power of Suppliers 66
      1. Threat of Substitutes 66
        1. Bargaining
    28. Power of Buyers 67
      1. Intensity of Rivalry 67
    29. GLOBAL PUBLIC TRANSPORT
    30. MARKET, BY MOBILITY 69
      1. INTRODUCTION 69
      2. BUS 70
      3. TRAM 70
      4. TRAIN 71
      5. CAR SHARING 71
      6. OTHERS 71
    31. GLOBAL PUBLIC TRANSPORT
    32. MARKET, BY PROPULSION 73
      1. INTRODUCTION 73
      2. DIESEL 74
      3. GASOLINE
      4. ELECTRIC 75
      5. OTHERS 75
    33. GLOBAL PUBLIC TRANSPORT MARKET,
    34. BY OWNERSHIP TYPE 77
      1. INTRODUCTION 77
      2. PRIVATE OWNED 78
    35. PUBLIC OWNED 79
    36. GLOBAL PUBLIC TRANSPORT MARKET, BY END-USE 81
      1. INTRODUCTION
      2. INTRACITY 82
      3. INTERCITY 82
      4. OTHERS 83
    37. GLOBAL
    38. PUBLIC TRANSPORT MARKET, BY REGION 84
      1. OVERVIEW 84
      2. NORTH AMERICA
        1. US 91
        2. CANADA 92
        3. MEXICO 94
      3. EUROPE
        1. GERMANY 100
        2. UK 101
        3. FRANCE 103
    39. SPAIN 104
      1. ITALY 105
        1. REST OF EUROPE 108
      2. ASIA PACIFIC
        1. CHINA 114
        2. JAPAN 115
        3. INDIA 117
    40. SOUTH KOREA 118
      1. VIETNAM 120
        1. INDONESIA 122
        2. Rest
    41. of asia pacific 123
      1. MIDDLE EAST & AFRICA 126
        1. SAUDI ARABIA
        2. UAE 132
        3. SOUTH AFRICA 134
        4. REST OF MIDDLE
    42. EAST & AFRICA 135
      1. SOUTH AMERICA 138
        1. BRAZIL 142
    43. ARGENTINA 143
      1. REST OF SOUTH AMERICA 145
    44. COMPETITIVE LANDSCAPE
      1. COMPETITIVE OVERVIEW 147
      2. MAJOR PLAYERS IN THE GLOBAL PUBLIC
    45. TRANSPORT MARKET 148
      1. MAJOR PLAYERS IN TERMS OF MARKET DISRUPTORS &
    46. INNOVATORS 149
      1. COMPETITIVE BENCHMARKING 149
      2. STRATEGIES OF MARKET
    47. LEADERS IN THE GLOBAL PUBLIC TRANSPORT MARKET 150
      1. LEADING PLAYERS IN TERMS
    48. OF THE NUMBER OF DEVELOPMENTS IN GLOBAL PUBLIC TRANSPORT MARKET 151
      1. KEY
    49. DEVELOPMENTS & GROWTH STRATEGIES 151
      1. Product Launch/Product Development
        1. Expansion/ACQUISITION/Partnership 152
    50. COMPANY PROFILES 154
      1. TRANSPORT FOR LONDON 154
        1. Company Overview 154
        2. FINANCIAL
    51. OVERVIEW 154
      1. Products/Services Offered 154
        1. KEY DEVELOPMENTS
        2. SWOT Analysis 155
        3. Key Strategies 156
      2. MTR CORPORATION
        1. COMPANY OVERVIEW 157
        2. Financial Overview 157
    52. PRODUCTS OFFERED 158
      1. KEY DEVELOPMENTS 158
        1. SWOT ANALYSIS
        2. KEY STRATEGIES 159
      2. BAY AREA RAPID TRANSIT (BART) 160
        1. COMPANY OVERVIEW 160
        2. FINANCIAL OVERVIEW 160
        3. PRODUCTS
    53. OFFERED 160
      1. KEY DEVELOPMENTS 160
        1. SWOT ANALYSIS 161
    54. KEY STRATEGIES 161
      1. CHICAGO TRANSIT AUTHORITY 162
        1. COMPANY OVERVIEW
        2. FINANCIAL OVERVIEW 162
        3. PRODUCTS OFFERED 162
    55. KEY DEVELOPMENTS 163
      1. SWOT ANALYSIS 163
        1. KEY STRATEGIES 164
      2. THE WASHINGTON METROPOLITAN AREA TRANSIT AUTHORITY 165
        1. COMPANY
    56. OVERVIEW 165
      1. FINANCIAL OVERVIEW 165
        1. PRODUCTS OFFERED 165
        2. KEY DEVELOPMENTS 166
        3. SWOT ANALYSIS 166
        4. KEY STRATEGIES
      2. MASSACHUSETTS BAY TRANSPORTATION AUTHORITY 168
        1. COMPANY
    57. OVERVIEW 168
      1. FINANCIAL OVERVIEW 168
        1. PRODUCTS OFFERED 168
        2. KEY DEVELOPMENTS 169
        3. SWOT ANALYSIS 169
        4. KEY STRATEGIES
      2. MADRID METRO 171
        1. Company Overview 171
        2. FINANCIAL
    58. OVERVIEW 171
      1. Products/Services Offered 171
        1. KEY DEVELOPMENTS
        2. SWOT Analysis 172
        3. Key Strategies 172
      2. METROPOLITAN
    59. TRANSPORTATION AUTHORITY 174
      1. COMPANY OVERVIEW 174
        1. FINANCIAL
    60. OVERVIEW 174
      1. PRODUCTS OFFERED 174
        1. KEY DEVELOPMENTS 175
        2. SWOT ANALYSIS 175
        3. KEY STRATEGIES 176
      2. THE SAN DIEGO
    61. METROPOLITAN TRANSIT SYSTEM 177
      1. COMPANY OVERVIEW 177
        1. FINANCIAL
    62. OVERVIEW 177
      1. PRODUCTS OFFERED 177
        1. KEY DEVELOPMENTS 177
        2. SWOT ANALYSIS 178
        3. KEY STRATEGIES 178
      2. SEOUL METRO
        1. COMPANY OVERVIEW 179
        2. FINANCIAL OVERVIEW 179
    63. PRODUCTS OFFERED 179
      1. Key Developments 180
        1. SWOT ANALYSIS
        2. KEY STRATEGIES 181
    64. APPENDIX 182
      1. REFERENCES 182

    Public Transport Market Segmentation

    Global Public Transport Mobility Outlook (USD Million, 2019-2032)

    • Bus
    • Tram
    • Train
    • Car Sharing
    • Others

    Global Public Transport Propulsion Outlook (USD Million, 2019-2032)

    • Diesel
    • Gasoline
    • Electric
    • Others

    Global Public Transport Ownership Type Outlook (USD Million, 2019-2032)

    • Private Owned
    • Public Owned

    Global Public Transport End Use Outlook (USD Million, 2019-2032)

    • Intracity
    • Intercity
    • Others

    Global Public Transport Market Regional Outlook (USD Million, 2019-2032)

    North America Public Transport Mobility Outlook (USD Million, 2019-2032)

    • Bus
    • Tram
    • Train
    • Car Sharing
    • Others

    North America Public Transport Propulsion Outlook (USD Million, 2019-2032)

    • Diesel
    • Gasoline
    • Electric
    • Others

    North America Public Transport Ownership Type Outlook (USD Million, 2019-2032)

    • Private Owned
    • Public Owned

    North America Public Transport End Use Outlook (USD Million, 2019-2032)

    • Intracity
    • Intercity
    • Others

    US Public Transport Mobility Outlook (USD Million, 2019-2032)

    • Bus
    • Tram
    • Train
    • Car Sharing
    • Others

    US Public Transport Propulsion Outlook (USD Million, 2019-2032)

    • Diesel
    • Gasoline
    • Electric
    • Others

    US Public Transport Ownership Type Outlook (USD Million, 2019-2032)

    • Private Owned
    • Public Owned

    US Public Transport End Use Outlook (USD Million, 2019-2032)

    • Intracity
    • Intercity
    • Others

    Canada Public Transport Mobility Outlook (USD Million, 2019-2032)

    • Bus
    • Tram
    • Train
    • Car Sharing
    • Others

    Canada Public Transport Propulsion Outlook (USD Million, 2019-2032)

    • Diesel
    • Gasoline
    • Electric
    • Others

    Canada Public Transport Ownership Type Outlook (USD Million, 2019-2032)

    • Private Owned
    • Public Owned

    Canada Public Transport End Use Outlook (USD Million, 2019-2032)

    • Intracity
    • Intercity
    • Others

    Mexico Public Transport Mobility Outlook (USD Million, 2019-2032)

    • Bus
    • Tram
    • Train
    • Car Sharing
    • Others

    Mexico Public Transport Propulsion Outlook (USD Million, 2019-2032)

    • Diesel
    • Gasoline
    • Electric
    • Others

    Mexico Public Transport Ownership Type Outlook (USD Million, 2019-2032)

    • Private Owned
    • Public Owned

    Mexico Public Transport End Use Outlook (USD Million, 2019-2032)

    • Intracity
    • Intercity
    • Others

    Europe Public Transport Mobility Outlook (USD Million, 2019-2032)

    • Bus
    • Tram
    • Train
    • Car Sharing
    • Others

    Europe Public Transport Propulsion Outlook (USD Million, 2019-2032)

    • Diesel
    • Gasoline
    • Electric
    • Others

    Europe Public Transport Ownership Type Outlook (USD Million, 2019-2032)

    • Private Owned
    • Public Owned

    Europe Public Transport End Use Outlook (USD Million, 2019-2032)

    • Intracity
    • Intercity
    • Others

    Germany Public Transport Mobility Outlook (USD Million, 2019-2032)

    • Bus
    • Tram
    • Train
    • Car Sharing
    • Others

    Germany Public Transport Propulsion Outlook (USD Million, 2019-2032)

    • Diesel
    • Gasoline
    • Electric
    • Others

    Germany Public Transport Ownership Type Outlook (USD Million, 2019-2032)

    • Private Owned
    • Public Owned

    Germany Public Transport End Use Outlook (USD Million, 2019-2032)

    • Intracity
    • Intercity
    • Others

    UK Public Transport Mobility Outlook (USD Million, 2019-2032)

    • Bus
    • Tram
    • Train
    • Car Sharing
    • Others

    UK Public Transport Propulsion Outlook (USD Million, 2019-2032)

    • Diesel
    • Gasoline
    • Electric
    • Others

    UK Public Transport Ownership Type Outlook (USD Million, 2019-2032)

    • Private Owned
    • Public Owned

    UK Public Transport End Use Outlook (USD Million, 2019-2032)

    • Intracity
    • Intercity
    • Others

    France Public Transport Mobility Outlook (USD Million, 2019-2032)

    • Bus
    • Tram
    • Train
    • Car Sharing
    • Others

    France Public Transport Propulsion Outlook (USD Million, 2019-2032)

    • Diesel
    • Gasoline
    • Electric
    • Others

    France Public Transport Ownership Type Outlook (USD Million, 2019-2032)

    • Private Owned
    • Public Owned

    France Public Transport End Use Outlook (USD Million, 2019-2032)

    • Intracity
    • Intercity
    • Others

    Spain Public Transport Mobility Outlook (USD Million, 2019-2032)

    • Bus
    • Tram
    • Train
    • Car Sharing
    • Others

    Spain Public Transport Propulsion Outlook (USD Million, 2019-2032)

    • Diesel
    • Gasoline
    • Electric
    • Others

    Spain Public Transport Ownership Type Outlook (USD Million, 2019-2032)

    • Private Owned
    • Public Owned

    Spain Public Transport End Use Outlook (USD Million, 2019-2032)

    • Intracity
    • Intercity
    • Others

    Italy Public Transport Mobility Outlook (USD Million, 2019-2032)

    • Bus
    • Tram
    • Train
    • Car Sharing
    • Others

    Italy Public Transport Propulsion Outlook (USD Million, 2019-2032)

    • Diesel
    • Gasoline
    • Electric
    • Others

    Italy Public Transport Ownership Type Outlook (USD Million, 2019-2032)

    • Private Owned
    • Public Owned

    Italy Public Transport End Use Outlook (USD Million, 2019-2032)

    • Intracity
    • Intercity
    • Others

    Rest of Europe Public Transport Mobility Outlook (USD Million, 2019-2032)

    • Bus
    • Tram
    • Train
    • Car Sharing
    • Others

    Rest of Europe Public Transport Propulsion Outlook (USD Million, 2019-2032)

    • Diesel
    • Gasoline
    • Electric
    • Others

    Rest of Europe Public Transport Ownership Type Outlook (USD Million, 2019-2032)

    • Private Owned
    • Public Owned

    Rest of Europe Public Transport End Use Outlook (USD Million, 2019-2032)

    • Intracity
    • Intercity
    • Others

    Asia Pacific Public Transport Mobility Outlook (USD Million, 2019-2032)

    • Bus
    • Tram
    • Train
    • Car Sharing
    • Others

    Asia Pacific Public Transport Propulsion Outlook (USD Million, 2019-2032)

    • Diesel
    • Gasoline
    • Electric
    • Others

    Asia Pacific Public Transport Ownership Type Outlook (USD Million, 2019-2032)

    • Private Owned
    • Public Owned

    Asia Pacific Public Transport End Use Outlook (USD Million, 2019-2032)

    • Intracity
    • Intercity
    • Others

    China Public Transport Mobility Outlook (USD Million, 2019-2032)

    • Bus
    • Tram
    • Train
    • Car Sharing
    • Others

    China Public Transport Propulsion Outlook (USD Million, 2019-2032)

    • Diesel
    • Gasoline
    • Electric
    • Others

    China Public Transport Ownership Type Outlook (USD Million, 2019-2032)

    • Private Owned
    • Public Owned

    China Public Transport End Use Outlook (USD Million, 2019-2032)

    • Intracity
    • Intercity
    • Others

    Japan Public Transport Mobility Outlook (USD Million, 2019-2032)

    • Bus
    • Tram
    • Train
    • Car Sharing
    • Others

    Japan Public Transport Propulsion Outlook (USD Million, 2019-2032)

    • Diesel
    • Gasoline
    • Electric
    • Others

    Japan Public Transport Ownership Type Outlook (USD Million, 2019-2032)

    • Private Owned
    • Public Owned

    Japan Public Transport End Use Outlook (USD Million, 2019-2032)

    • Intracity
    • Intercity
    • Others

    India Public Transport Mobility Outlook (USD Million, 2019-2032)

    • Bus
    • Tram
    • Train
    • Car Sharing
    • Others

    India Public Transport Propulsion Outlook (USD Million, 2019-2032)

    • Diesel
    • Gasoline
    • Electric
    • Others

    India Public Transport Ownership Type Outlook (USD Million, 2019-2032)

    • Private Owned
    • Public Owned

    India Public Transport End Use Outlook (USD Million, 2019-2032)

    • Intracity
    • Intercity
    • Others

    South Korea Public Transport Mobility Outlook (USD Million, 2019-2032)

    • Bus
    • Tram
    • Train
    • Car Sharing
    • Others

    South Korea Public Transport Propulsion Outlook (USD Million, 2019-2032)

    • Diesel
    • Gasoline
    • Electric
    • Others

    South Korea Public Transport Ownership Type Outlook (USD Million, 2019-2032)

    • Private Owned
    • Public Owned

    South Korea Public Transport End Use Outlook (USD Million, 2019-2032)

    • Intracity
    • Intercity
    • Others

    Vietnam Public Transport Mobility Outlook (USD Million, 2019-2032)

    • Bus
    • Tram
    • Train
    • Car Sharing
    • Others

    Vietnam Public Transport Propulsion Outlook (USD Million, 2019-2032)

    • Diesel
    • Gasoline
    • Electric
    • Others

    Vietnam Public Transport Ownership Type Outlook (USD Million, 2019-2032)

    • Private Owned
    • Public Owned

    Vietnam Public Transport End Use Outlook (USD Million, 2019-2032)

    • Intracity
    • Intercity
    • Others

    Indonesia Public Transport Mobility Outlook (USD Million, 2019-2032)

    • Bus
    • Tram
    • Train
    • Car Sharing
    • Others

    Indonesia Public Transport Propulsion Outlook (USD Million, 2019-2032)

    • Diesel
    • Gasoline
    • Electric
    • Others

    Indonesia Public Transport Ownership Type Outlook (USD Million, 2019-2032)

    • Private Owned
    • Public Owned

    Indonesia Public Transport End Use Outlook (USD Million, 2019-2032)

    • Intracity
    • Intercity
    • Others

    Rest of Asia Pacific Public Transport Mobility Outlook (USD Million, 2019-2032)

    • Bus
    • Tram
    • Train
    • Car Sharing
    • Others

    Rest of Asia Pacific Public Transport Propulsion Outlook (USD Million, 2019-2032)

    • Diesel
    • Gasoline
    • Electric
    • Others

    Rest of Asia Pacific Public Transport Ownership Type Outlook (USD Million, 2019-2032)

    • Private Owned
    • Public Owned

    Rest of Asia Pacific Public Transport End Use Outlook (USD Million, 2019-2032)

    • Intracity
    • Intercity
    • Others

    Middle East & Africa Public Transport Mobility Outlook (USD Million, 2019-2032)

    • Bus
    • Tram
    • Train
    • Car Sharing
    • Others

    Middle East & Africa Public Transport Propulsion Outlook (USD Million, 2019-2032)

    • Diesel
    • Gasoline
    • Electric
    • Others

    Middle East & Africa Public Transport Ownership Type Outlook (USD Million, 2019-2032)

    • Private Owned
    • Public Owned

    Middle East & Africa Public Transport End Use Outlook (USD Million, 2019-2032)

    • Intracity
    • Intercity
    • Others

    Saudi Arabia Public Transport Mobility Outlook (USD Million, 2019-2032)

    • Bus
    • Tram
    • Train
    • Car Sharing
    • Others

    Saudi Arabia Public Transport Propulsion Outlook (USD Million, 2019-2032)

    • Diesel
    • Gasoline
    • Electric
    • Others

    Saudi Arabia Public Transport Ownership Type Outlook (USD Million, 2019-2032)

    • Private Owned
    • Public Owned

    Saudi Arabia Public Transport End Use Outlook (USD Million, 2019-2032)

    • Intracity
    • Intercity
    • Others

    UAE Public Transport Mobility Outlook (USD Million, 2019-2032)

    • Bus
    • Tram
    • Train
    • Car Sharing
    • Others

    UAE Public Transport Propulsion Outlook (USD Million, 2019-2032)

    • Diesel
    • Gasoline
    • Electric
    • Others

    UAE Public Transport Ownership Type Outlook (USD Million, 2019-2032)

    • Private Owned
    • Public Owned

    UAE Public Transport End Use Outlook (USD Million, 2019-2032)

    • Intracity
    • Intercity
    • Others

    South Africa Public Transport Mobility Outlook (USD Million, 2019-2032)

    • Bus
    • Tram
    • Train
    • Car Sharing
    • Others

    South Africa Public Transport Propulsion Outlook (USD Million, 2019-2032)

    • Diesel
    • Gasoline
    • Electric
    • Others

    South Africa Public Transport Ownership Type Outlook (USD Million, 2019-2032)

    • Private Owned
    • Public Owned

    South Africa Public Transport End Use Outlook (USD Million, 2019-2032)

    • Intracity
    • Intercity
    • Others

    Rest of Middle East & Africa Public Transport Mobility Outlook (USD Million, 2019-2032)

    • Bus
    • Tram
    • Train
    • Car Sharing
    • Others

    Rest of Middle East & Africa Public Transport Propulsion Outlook (USD Million, 2019-2032)

    • Diesel
    • Gasoline
    • Electric
    • Others

    Rest of Middle East & Africa Public Transport Ownership Type Outlook (USD Million, 2019-2032)

    • Private Owned
    • Public Owned

    Rest of Middle East & Africa Public Transport End Use Outlook (USD Million, 2019-2032)

    • Intracity
    • Intercity
    • Others

    South America Public Transport Mobility Outlook (USD Million, 2019-2032)

    • Bus
    • Tram
    • Train
    • Car Sharing
    • Others

    South America Public Transport Propulsion Outlook (USD Million, 2019-2032)

    • Diesel
    • Gasoline
    • Electric
    • Others

    South America Public Transport Ownership Type Outlook (USD Million, 2019-2032)

    • Private Owned
    • Public Owned

    South America Public Transport End Use Outlook (USD Million, 2019-2032)

    • Intracity
    • Intercity
    • Others

    Brazil Public Transport Mobility Outlook (USD Million, 2019-2032)

    • Bus
    • Tram
    • Train
    • Car Sharing
    • Others

    Brazil Public Transport Propulsion Outlook (USD Million, 2019-2032)

    • Diesel
    • Gasoline
    • Electric
    • Others

    Brazil Public Transport Ownership Type Outlook (USD Million, 2019-2032)

    • Private Owned
    • Public Owned

    Brazil Public Transport End Use Outlook (USD Million, 2019-2032)

    • Intracity
    • Intercity
    • Others

    Argentina Public Transport Mobility Outlook (USD Million, 2019-2032)

    • Bus
    • Tram
    • Train
    • Car Sharing
    • Others

    Argentina Public Transport Propulsion Outlook (USD Million, 2019-2032)

    • Diesel
    • Gasoline
    • Electric
    • Others

    Argentina Public Transport Ownership Type Outlook (USD Million, 2019-2032)

    • Private Owned
    • Public Owned

    Argentina Public Transport End Use Outlook (USD Million, 2019-2032)

    • Intracity
    • Intercity
    • Others

    Rest of South America Public Transport Mobility Outlook (USD Million, 2019-2032)

    • Bus
    • Tram
    • Train
    • Car Sharing
    • Others

    Rest of South America Public Transport Propulsion Outlook (USD Million, 2019-2032)

    • Diesel
    • Gasoline
    • Electric
    • Others

    Rest of South America Public Transport Ownership Type Outlook (USD Million, 2019-2032)

    • Private Owned
    • Public Owned

    Rest of South America Public Transport End Use Outlook (USD Million, 2019-2032)

    • Intracity
    • Intercity
    • Others
    Public Transport Market Research Report - Global Forecast till 2032 Infographic
    Free Sample Request

    Kindly complete the form below to receive a free sample of this Report

    Customer Strories

    “I am very pleased with how market segments have been defined in a relevant way for my purposes (such as "Portable Freezers & refrigerators" and "last-mile"). In general the report is well structured. Thanks very much for your efforts.”

    Victoria Milne Founder
    Case Study

    Chemicals and Materials