• Cat-intel
  • MedIntelliX
  • Resources
  • About Us
  • Request Free Sample ×

    Kindly complete the form below to receive a free sample of this Report

    Leading companies partner with us for data-driven Insights

    clients tt-cursor

    Metaverse Market

    ID: MRFR/ICT/9260-CR
    153 Pages
    Aarti Dhapte
    October 2022

    Metaverse Market Research Report Information By Component (Software, Hardware), By Platform (Desktop/Laptops, Mobile, Wearables), By Technology (Blockchain, VR & AR, Mixed Reality, Others), By Application (Online Shopping, Content Creation, Gaming, Social Media, Others), By End User (Consumer, Enterprises), By Region (North America, Asia-Pacific, Europe, And Rest Of The World) – Industry Size, Share Growth and Forecast To 2030.

    Share:
    Download PDF ×

    We do not share your information with anyone. However, we may send you emails based on your report interest from time to time. You may contact us at any time to opt-out.

    Metaverse Market Research Report - Global Forecast till 2030 Infographic
    Purchase Options
    $ 4,950.0
    $ 5,950.0
    $ 7,250.0
    Table of Contents

    Metaverse Market Summary

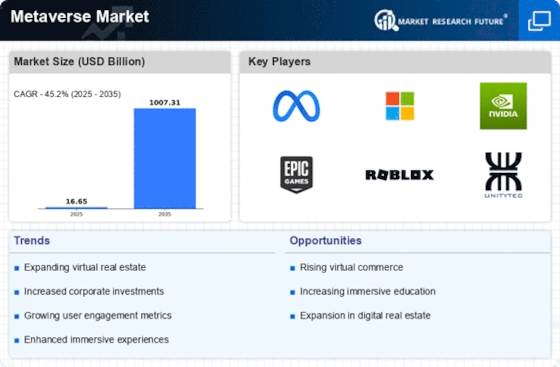
    As per Market Research Future Analysis, the metaverse market was valued at USD 7.91 billion in 2022 and is projected to grow from USD 11.47 billion in 2023 to USD 107.49 billion by 2030, with a CAGR of 45.2% from 2024 to 2030. Key drivers include the integration of digital platforms across industries and the rising use of AR, VR, and mixed reality in recreational activities. The gaming sector is the largest application segment, accounting for 28% of the market share in 2022, while the consumer segment currently holds a larger market share compared to enterprises. North America led the market with USD 3.61 billion in 2022, driven by high investments and consumer purchasing power.

    Key Market Trends & Highlights

    The metaverse market is experiencing significant growth driven by technological advancements and consumer engagement.

    • The market is expected to reach USD 107.49 billion by 2030, growing at a CAGR of 45.2%.
    • Gaming accounts for 28% of the metaverse market share in 2022, highlighting its dominance.
    • North America held USD 3.61 billion in 2022, showcasing its leading position in the market.
    • The mobile segment is anticipated to grow the fastest during the forecast period due to innovations in VR games.

    Market Size & Forecast

    2022 Market Size USD 7.91 Billion
    2023 Market Size USD 11.47 Billion
    2030 Market Size USD 107.49 Billion
    CAGR (2024-2030) 45.2%

    Major Players

    Key players include Meta Platforms Inc., Microsoft Corporation, Tencent Holdings Ltd., Nvidia, and Epic Games.

    Metaverse Market Trends

    Growing use of metaverse in gaming and recreation to boost the market growth

    The internet has seen consumers use online games for recreational activities. This has helped grow the metaverse as it provides a better interface than traditional online gaming platforms. Using equipment and platforms such as VR headsets, smart helmets, and MR displays has helped improve the gaming experience, leading to increased use of metaverse by gaming developers. Thus, this has led to the growth of the market CAGR.The rising interest in cryptocurrency has also helped expand its usage. The increasing popularity of NFTs amongst the younger generation has also led to increased use of metaverse.

    According to CNBC, the market for NFTs increased by 210% from 2021 to 2022. Retailers and luxury brands have also used metaverse to capture consumers by selling limited edition goods, such as Gucci's collaboration with Roblox to sell limited edition bags and let users win accessories through games. Similarly, artists such as Arian Grande and Imagine Dragons have conducted concerts in the metaverse.

    Additionally, there has been an increase in the adoption of metaverse into various end-use industries such as medicine, defense, aerospace, and other banking sectors. Major BFSI players such as JP Morgan and HSBC have started using it to better connect with their customers. Trading companies have also begun using metaverse to give their customers an interactive way of managing their stock portfolio, thus driving the metaverse market revenue.

    However, there have also been trials in the medical field to set up doctor-patient interactions in the metaverse for seamless and anonymous communication. The government sector is expected to significantly boost the market for the metaverse with its implementation in areas such as tourism, defense, and employee training in the forecast period.

    The Global Metaverse Market is poised to redefine digital interaction, creating immersive environments that blend physical and virtual realities, thereby transforming how individuals engage with technology and each other.

    U.S. Department of Commerce

    Metaverse Market Drivers

    Increased Investment

    Investment in the Global Metaverse Market Industry is witnessing a significant surge as companies recognize the potential of virtual environments. Major tech firms and startups alike are allocating substantial resources to develop metaverse platforms and applications. For example, investments in gaming, social interaction, and virtual commerce are driving innovation and expansion. This influx of capital is likely to enhance the quality and variety of offerings within the metaverse, attracting a broader audience. By 2035, the market is anticipated to grow to 693.7 USD Billion, reflecting the confidence investors have in the metaverse's future.

    Growing Consumer Demand

    Consumer demand for immersive digital experiences is a key driver of the Global Metaverse Market Industry. As individuals seek new forms of entertainment, social interaction, and commerce, the metaverse offers unique opportunities that traditional platforms cannot match. The rise of online gaming and virtual events illustrates this trend, with millions participating in virtual concerts and gaming tournaments. This shift in consumer behavior suggests a growing appetite for metaverse experiences, which could lead to a compound annual growth rate (CAGR) of 40.79% from 2025 to 2035. Such demand is likely to shape the future landscape of the metaverse.

    Market Growth Projections

    The Global Metaverse Market Industry is projected to experience substantial growth over the coming years. With an estimated value of 16.1 USD Billion in 2024, the market is set to expand dramatically, reaching 693.7 USD Billion by 2035. This growth trajectory suggests a compound annual growth rate (CAGR) of 40.79% from 2025 to 2035, highlighting the increasing interest and investment in metaverse technologies and applications. Such projections indicate a robust future for the industry, driven by technological advancements, consumer demand, and the integration of various digital platforms.

    Technological Advancements

    The Global Metaverse Market Industry is propelled by rapid technological advancements, particularly in virtual reality (VR) and augmented reality (AR). Innovations in hardware and software are enhancing user experiences, making virtual environments more immersive and interactive. For instance, companies are developing high-resolution displays and haptic feedback systems that allow users to engage with digital content in unprecedented ways. As these technologies evolve, they are expected to attract more users and businesses, contributing to the market's growth. The Global Metaverse Market is projected to reach 16.1 USD Billion in 2024, indicating a robust demand for these advanced technologies.

    Integration of Social Media

    The integration of social media platforms into the Global Metaverse Market Industry is reshaping how users interact within virtual environments. Social media giants are exploring ways to create immersive experiences that blend social networking with virtual reality. This integration allows users to connect, share, and collaborate in ways that enhance their online presence. As social media continues to evolve, its influence on the metaverse is likely to grow, attracting a diverse user base. This trend may contribute to the overall growth of the market, as more individuals seek to engage in social experiences within the metaverse.

    Expansion of Virtual Economies

    The Global Metaverse Market Industry is increasingly characterized by the emergence of virtual economies, where users can create, buy, and sell digital assets. This phenomenon is facilitated by blockchain technology, which ensures secure transactions and ownership verification. Virtual real estate, digital art, and in-game items are examples of assets traded within these economies. As more users engage in these transactions, the economic activity within the metaverse is expected to grow, further driving market expansion. The potential for virtual economies to generate revenue is substantial, indicating a promising future for the Global Metaverse Market.

    Market Segment Insights

    Metaverse Component Type Insights

    The metaverse market segmentation, based on component type, includes hardware and software. The hardware segment held the majority share in 2021, contributing to around ~47-49% of the metaverse market revenue. This is primarily owing to the improvement in technology for components such as VR and MR headsets, sensors, and displays. For instance, the market for AR, VR, and MR headsets in 2021 amounted to about USD 28 billion.

    June 2022: Meta Platforms Inc to use Broadcom Inc’s ASIC chips to develop their hardware.

    October 2021:Facebook Reality labs announced its USD 10 billion investment in developing and manufacturing AR and VR headsets.

    Metaverse Platform Type Insights

    Based on platform type, the metaverse market segmentation includes desktop/laptops, mobile, and wearables. The desktop/ laptops segment dominated the market growth in 2021, accounting for around USD 16 billion. The ease of usage of desktops and the higher degree of innovation currently available in the desktop segment are significant factors for the high revenue generation. Moreover, devices such as Oculus Quest and Valve Index can only be used with high-power desktops, further increasing their use.

    The mobile segment is expected to see the fastest growth in the forecast period due to the rising innovation in virtual reality games as mobile applications.

    Metaverse Technology Type Insights

    The metaverse market data, based on technology type, includes blockchain, VR & AR mixed reality, and others. The VR & AR segment dominated the market in 2021. The higher degree of user experience that VR and AR provide in areas such as gaming has boosted the revenue gain for the segment. It also helps in improving peer-to-peer interaction within as well as in between the applications. The mixed reality segment is expected to showcase the fastest growth in the forecast period due to its higher performance and enhanced user connectivity and experience properties.

    Figure 3: Metaverse market, by technology, 2021 & 2030 (USD billion) 

     Source: Secondary Research, Primary Research, and Analyst Review

    Metaverse Application Type Insights

    Based on application, the metaverse industry has been segmented into gaming, online shopping, content creation, social media, and others. The gaming industry is the largest segment in terms of application for the metaverse market, with a market share of about 28% in 2022. This is due to consumers' rising use of AR-VR games as it provides a more holistic gaming experience. The social media segment is expected to register the highest market growth in the forecast period.

    This is due to the increasing number of content creators and the need for improved social connection and user experience by social media companies.

    Metaverse End User Insights

    Based on End Users, the metaverse industry has been segmented into consumers and enterprises. The consumer segment for the metaverse industry holds the larger market share as currently. The metaverse is used for recreational activities such as buying NFTs, selling virtual artwork, and cryptocurrency. However, the enterprise segment is expected to register a higher CAGR in the forecast period as more and more companies begin using the metaverse as a marketplace and a place to handle the company’s interactive functions.

    The increasing use of virtual working models is expected to boost this pattern of using it for practical use in enterprises.

    May 2022: Alibaba’s Taobao introduced the “Metaverse Mall” for China’s 618 shopping festival.

    Get more detailed insights about Metaverse Market Research Report - Global Forecast till 2030

    Regional Insights

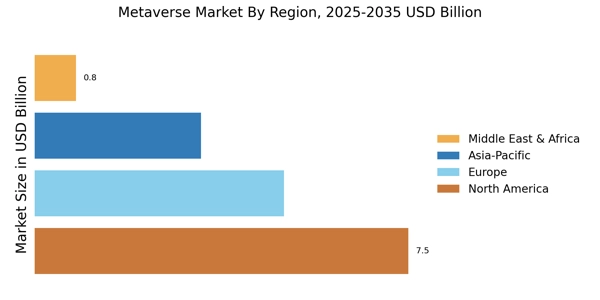
    The report provides insights into North America, Europe, Asia-Pacific, and the Rest of the World. The North America Metaverse market accounted for USD 3.61 billion in 2022 and showcased a notable CAGR growth during the study period. This is attributed to the higher investments by firms to develop cutting-edge technologies and the higher purchasing power of consumers in the region.Further, countries studied in the market report are The U.S., Canada, Germany, the UK, France, Italy, Spain, Japan, China, India, Australia, South Korea, and Brazil.

    Figure 4: METAVERSE MARKET SHARE BY REGION 2021 (%) 

    METAVERSE MARKET SHARE BY REGION

    Source: Secondary Research, Primary Research, and Analyst Review

    Europe's metaverse market is fast-moving due to the expanding gaming sector in countries such as Germany, France, and the UK. Government initiatives such as AEGLE and MIDAS are also expected to boost investment into the market. For instance, Facebook is expected to provide about 10,000 jobs in the European Union. Moreover, UK metaverse market held the largest market share, and the Germany metaverse market was the fastest growing market in the region.

    The Asia-Pacific metaverse market is expected to grow with the fastest CAGR from 2022 to 2030. This is due to rapid digitization initiatives by governments in developing countries such as China and India. Moreover, the economic growth in Asian countries is also expected to boost the use of metaverse in the region, helping the market to grow at a higher pace. The favorable regulations by governments for technology driver startups are also expected to be a significant factor for market growth.

    For instance, Meta Platforms partnered with the Indian IT Ministry to launch an accelerator, the XR Startup Program, to assist early-stage startups with innovation in emerging technologies. In 2021, Tencent Holdings, Ltd. partnered with the AIDF to improve Asia’s education, research, and entrepreneurship in the fintech industry. Further, the China metaverse market held the largest market share, and the India metaverse market was the fastest growing market in the region.

    Key Players and Competitive Insights

    Major market players have high investments in R&D to improve their products, which will help the metaverse market grow. Market participants are taking various strategic initiatives to expand their presence, with market developments such as new product launches, contracts, mergers and acquisitions, and collaboration with other organizations. Competitors in the metaverse industry must offer technologically unique products to survive in an increasingly competitive environment.

    One of the primary business strategies adopted in the metaverse industry to benefit clients and expand the market sector is to invest in mergers and technological developments. In the metaverse market, major players such as Meta (US), Microsoft (US), Tencent (China), and others are working on expanding the market demand by investing in partnerships and product enhancements.Meta Platforms (US) is a multinational technology conglomerate. Meta changed its name from Facebook to Meta Platforms in October 2021 to align with their work in building the metaverse.

    The company is the parent of major social media and communication applications such as Facebook, Instagram, and Whatsapp, among other products and services. In October 2022, Meta launched Meta Quest Pro, a VR headset that provides an open periphery and lets users multitask. They also come with sensors that capture facial emotions and track eye movements.

    Also, Nvidia (US) is a multinational technology company that develops software and hardware. Nvidia is a market leader in artificial intelligence. The company manufactures graphics processing units, application programming interfaces, and systems on chips for mobile and automotive markets. It also provides CUDA, an API used in supercomputers worldwide. In August 2021, Nvidia corporation signed partnerships with Blender and Adobe to create nvidia omniverse, the world’s first collaboration and simulation platform.

    Key Companies in the Metaverse Market market include

    Industry Developments

    • Q1 2024: Meta launches Horizon Workrooms 2.0 with advanced collaboration tools for the metaverse Meta announced the release of Horizon Workrooms 2.0, introducing new features for virtual meetings and collaboration, including spatial audio, improved avatar customization, and integration with enterprise productivity tools.
    • Q1 2024: Roblox partners with Sony Music to launch virtual concerts in the metaverse Roblox and Sony Music entered a partnership to host a series of virtual concerts and music experiences on the Roblox platform, aiming to expand entertainment offerings in the metaverse.
    • Q1 2024: Microsoft acquires metaverse startup AltspaceVR to bolster Mesh platform Microsoft completed the acquisition of AltspaceVR, a social virtual reality platform, to enhance its Mesh mixed reality offering and accelerate enterprise metaverse adoption.
    • Q2 2024: Meta unveils Quest 4 VR headset with enhanced metaverse capabilities Meta launched the Quest 4, its latest virtual reality headset, featuring improved graphics, lighter design, and new metaverse-focused applications for gaming and social interaction.
    • Q2 2024: Dubai-based Verse World partners with Azerion to enhance hyper-realistic metaverse Verse World announced a partnership with Azerion to provide monetization services and game content for its $180 million-valued metaverse platform, integrating VR, AR, and spatial computing[1].
    • Q2 2024: Epic Games raises $500 million to expand metaverse development Epic Games secured $500 million in new funding to accelerate the development of its metaverse ecosystem, focusing on interoperability and creator tools.
    • Q3 2024: NVIDIA launches Omniverse Cloud for enterprise metaverse applications NVIDIA introduced Omniverse Cloud, a suite of cloud-based tools for building and operating industrial and enterprise metaverse applications, enabling real-time collaboration and simulation.
    • Q3 2024: Tencent launches virtual shopping mall in metaverse platform 'Dream City' Tencent debuted 'Dream City,' a virtual shopping mall within its metaverse platform, allowing brands to create immersive retail experiences and digital storefronts.
    • Q4 2024: Meta appoints new Chief Metaverse Officer to lead immersive technology strategy Meta announced the appointment of a Chief Metaverse Officer, tasked with overseeing the company's metaverse initiatives and driving cross-platform integration.
    • Q1 2025: Apple launches Vision Pro 2 with expanded metaverse features Apple released the Vision Pro 2 headset, introducing advanced spatial computing and new developer tools for building metaverse applications.
    • Q2 2025: Roblox acquires virtual fashion startup DRESSX to expand metaverse avatar customization Roblox acquired DRESSX, a digital fashion company, to enhance avatar customization and virtual goods offerings within its metaverse platform.
    • Q2 2025: Meta secures regulatory approval for metaverse payments platform in Europe Meta received regulatory approval from the European Commission to launch its metaverse payments platform, enabling seamless digital transactions across its virtual environments.

    Future Outlook

    Metaverse Market Future Outlook

    The Global Metaverse Market is projected to grow at a 40.79% CAGR from 2024 to 2035, driven by advancements in VR technology, increased digital engagement, and evolving consumer preferences.

    New opportunities lie in:

    • Develop immersive training solutions for enterprises leveraging VR and AR technologies.
    • Create decentralized platforms for digital asset ownership and trade within the metaverse.
    • Invest in cross-platform interoperability tools to enhance user experience across different metaverse environments.

    By 2035, the Metaverse Market is expected to be a pivotal sector, reshaping digital interactions and commerce.

    Market Segmentation

    Metaverse End User Outlook

    • Consumer
    • Enterprises

    Metaverse Platform Outlook

    • Desktop/Laptops
    • Mobile
    • Wearables

    Metaverse Regional Outlook

    • US
    • Canada

    Metaverse Component Outlook

    • Hardware
    • Software

    Metaverse Technology Outlook

    • Blockchain
    • VR & AR
    • Mixed Reality
    • Others

    Metaverse Application Outlook

    • Gaming
    • Online Shopping
    • Content Creation
    • Social Media
    • Others

    Report Scope

    Report Attribute/Metric Details
    Market Size 2022 USD 7.9 billion
    Market Size 2023 USD 11.47 billion
    Market Size 2030 USD 107.49 billion
    Compound Annual Growth Rate (CAGR) 45.20% (2022-2030)
    Base Year 2023
    Market Forecast Period 2024-2030
    Historical Data 2018 & 2020
    Market Forecast Units Value (USD Billion)
    Report Coverage Revenue Forecast, Market Competitive Landscape, Growth Factors, and Trends
    Segments Covered Component, Platform, Technology, Application, End-User, and Region
    Geographies Covered North America, Asia Pacific, Europe, and the Rest of the World
    Countries Covered The U.S, Canada, Germany, France, the UK, Italy, Spain, China, Japan, India, Australia, South Korea, and Brazil
    Key Companies Profiled Meta Platforms Inc., Nvidia, Microsoft Corporation, Tencent Holdings Ltd., Bytedance, Epic GamesNetease Inc., Roblox Corporation, Lilith Games, Nextech AR Solutions Inc., Unity Software Inc, Antier Solutions
    Key Market Opportunities Advancement in technology for easy accessibility of these platforms
    Key Market Dynamics Rising use of AR/VR in the gaming and entertainment industry Increase affinity towards cryptocurrency and virtual assets

    Market Highlights

    Author
    Aarti Dhapte
    Team Lead - Research

    She holds an experience of about 6+ years in Market Research and Business Consulting, working under the spectrum of Information Communication Technology, Telecommunications and Semiconductor domains. Aarti conceptualizes and implements a scalable business strategy and provides strategic leadership to the clients. Her expertise lies in market estimation, competitive intelligence, pipeline analysis, customer assessment, etc.

    Leave a Comment

    FAQs

    How much is the metaverse market?

    The  market was valued at USD 7.9 Billion in 2022.

    What is the growth rate of the metaverse market?

    The  market is projected to grow at a CAGR of 45.20% during the forecast period, 2024-2030.

    Which region held the largest market share in the metaverse market?

    North America has the largest share of the  market

    Who are the major players in the metaverse market?

    The key players in the market are Meta Platforms Inc. (US), Nvidia (US), Microsoft Corporation (US), and Tencent Holdings Ltd (China).

    Which Component type led the metaverse market?

    The hardware category dominated the market in 2022.

    Which platform had the largest market share in the metaverse market?

    The desktop platform had the largest share of the market.

    What are the challenges of the metaverse?

    The metaverse also faces a number of challenges, including:    1) High cost: The metaverse requires a high level of investment in technology and infrastructure.   2) Security and privacy concerns: The metaverse raises a number of security and privacy concerns, such as the potential for data theft and fraud.   3) Social isolation: The metaverse could lead to social isolation, as people spend more time interacting with digital content than with real people.   4) Addiction: The metaverse could be addictive, as it can provide a highly stimulating and immersive experience.

    1. 'TABLE OF CONTENTS
    2. EXECUTIVE SUMMARY 19
      1. MARKET ATTRACTIVENESS
    3. ANALYSIS 21
    4. MARKET INTRODUCTION 22
    5. DEFINITION 22
    6. SCOPE OF THE STUDY 22
    7. RESEARCH OBJECTIVE 22
    8. MARKET STRUCTURE 23
    9. RESEARCH METHODOLOGY 24
    10. MARKET DYNAMICS 32
      1. INTRODUCTION 32
      2. DRIVER 33
        1. INCREASING FOCUS ON CONVERGING DIGITAL AND PHYSICAL WORLDS USING
    11. INTERNET 33
    12. INCREASING TRACTION AND POPULARITY OF MIXED REALITY (MR) 34
      1. RESTRAINT 35
        1. CYBER-THREATS 35
      2. OPPORTUNITY 35
        1. TECHNOLOGICAL ADVANCEMENT 35
      3. COVID-19 IMPACT 36
        1. IMPACT ON THE IT
    13. INDUSTRY 36
    14. IMPACT ON IT EXPENDITURE BY ORGANIZATIONS 36
      1. IMPACT ON METAVERSE DEVELOPMENTS 36
    15. MARKET FACTOR ANALYSIS
      1. VALUE
    16. CHAIN 37
    17. RESEARCH & DEVELOPER 37
      1. SYSTEM INTEGRATORS 37
        1. END USERS 38
      2. PORTER''S FIVE FORCES MODEL 38
        1. THREAT OF NEW ENTRANTS
        2. BARGAINING
    18. POWER OF SUPPLIERS 39
    19. THREAT OF SUBSTITUTES 39
      1. BARGAINING POWER OF BUYERS 39
        1. INTENSITY OF RIVALRY 39
    20. GLOBAL METAVERSE STATUS 40
      1. THE DEVELOPMENT STAGE DIVISION OF THE METAVERSE
      2. GLOBAL
    21. METAVERSE INVESTMENTS BY REGION 40
      1. GLOBAL METAVERSE PROJECTED USERS ANALYSIS 41
    22. GLOBAL METAVERSE MARKET,
    23. BY COMPONENT 42
    24. OVERVIEW 42
    25. GLOBAL METAVERSE MARKET, BY COMPONENT, 2022–2030 (USD MILLION) 43
      1. HARDWARE 43
        1. IC 44
        2. CIS 44
        3. AR/VR 44
        4. OTHERS 44
      2. SOFTWARE 44
    26. GLOBAL METAVERSE MARKET,
    27. BY PLATFORM 45
    28. OVERVIEW 45
    29. GLOBAL METAVERSE MARKET, BY PLATFORM, 2022–2030 (USD MILLION) 46
      1. DESKTOP/LAPTOPS 46
      2. MOBILE 46
      3. WEARABLES 46
    30. GLOBAL METAVERSE MARKET,
    31. BY TECHNOLOGY 47
    32. OVERVIEW 47
    33. GLOBAL METAVERSE MARKET, BY TECHNOLOGY, 2022–2030 (USD MILLION) 48
      1. BLOCKCHAIN 48
      2. VR & AR [AUGMENTED
    34. REALITY (AR), VIRTUAL REALITY (VR)] 48
      1. MIXED REALITY 48
      2. OTHERS 49
    35. GLOBAL METAVERSE MARKET, BY APPLICATION 50
      1. OVERVIEW 50
        1. GLOBAL METAVERSE
    36. MARKET, BY APPLICATION, 2022–2030 (USD MILLION) 51
      1. GAMING 51
      2. ONLINE SHOPPING 51
      3. CONTENT CREATION 51
      4. SOCIAL MEDIA 52
      5. OTHERS 52
    37. GLOBAL METAVERSE MARKET, BY END USER 53
      1. OVERVIEW 53
        1. GLOBAL METAVERSE MARKET,
    38. BY END USER, 2022–2030 (USD MILLION) 54
      1. CONSUMER 54
      2. ENTERPRISES 54
        1. GLOBAL METAVERSE MARKET, BY ENTERPRISE 54
        2. BFSI 55
        3. RETAIL 56
        4. MEDIA & ENTERTAINMENT
        5. EDUCATION
        6. REAL
    39. ESTATE 56
    40. AEROSPACE & DEFENSE 56
      1. HEALTHCARE 56
        1. ENGINEERING 57
        2. OTHERS 57
    41. GLOBAL METAVERSE MARKET, BY REGION 58
      1. OVERVIEW 58
        1. GLOBAL METAVERSE
    42. MARKET, BY REGION, 2022 VS 2030 (USD MILLION) 59
      1. GLOBAL METAVERSE MARKET, BY REGION, 2022–2030
    43. (USD MILLION) 59
    44. NORTH AMERICA 60
    45. NORTH AMERICA: METAVERSE MARKET, BY COUNTRY, 2022–2030 (USD MILLION) 61
      1. NORTH AMERICA
    46. METAVERSE MARKET, BY COMPONENT, 2022–2030 (USD MILLION) 61
      1. NORTH AMERICA METAVERSE
    47. MARKET, BY HARDWARE, 2022–2030 (USD MILLION) 62
      1. NORTH AMERICA METAVERSE MARKET, BY PLATFORM,
    48. –2030 (USD MILLION) 62
      1. NORTH AMERICA METAVERSE MARKET, BY TECHNOLOGY, 2022–2030
    49. (USD MILLION) 63
    50. NORTH AMERICA METAVERSE MARKET, BY APPLICATION, 2022–2030 (USD MILLION) 64
      1. NORTH AMERICA
    51. METAVERSE MARKET, BY END USER, 2022–2030 (USD MILLION) 65
      1. NORTH AMERICA METAVERSE
    52. MARKET, BY ENTERPRISES, 2022–2030 (USD MILLION) 66
      1. US 66
        1. US METAVERSE MARKET, BY COMPONENT, 2022–2030
    53. (USD MILLION) 66
    54. US METAVERSE MARKET, BY HARDWARE, 2022–2030 (USD MILLION) 67
      1. US METAVERSE MARKET,
    55. BY PLATFORM, 2022–2030 (USD MILLION) 67
      1. US METAVERSE MARKET, BY TECHNOLOGY, 2022–2030
    56. (USD MILLION) 67
    57. US METAVERSE MARKET, BY APPLICATION, 2022–2030 (USD MILLION) 68
      1. US METAVERSE
    58. MARKET, BY END USER, 2022–2030 (USD MILLION) 68
      1. US METAVERSE MARKET, BY ENTERPRISES, 2022–2030
    59. (USD MILLION) 68
    60. CANADA 69
    61. CANADA METAVERSE MARKET, BY COMPONENT, 2022–2030 (USD MILLION) 69
      1. CANADA METAVERSE
    62. MARKET, BY HARDWARE, 2022–2030 (USD MILLION) 69
      1. CANADA METAVERSE MARKET, BY PLATFORM, 2022–2030
    63. (USD MILLION) 69
    64. CANADA METAVERSE MARKET, BY TECHNOLOGY, 2022–2030 (USD MILLION) 70
      1. CANADA METAVERSE
    65. MARKET, BY APPLICATION, 2022–2030 (USD MILLION) 70
      1. CANADA METAVERSE MARKET, BY END USER, 2022–2030
    66. (USD MILLION) 70
    67. CANADA METAVERSE MARKET, BY ENTERPRISES, 2022–2030 (USD MILLION) 71
      1. MEXICO 71
        1. MEXICO METAVERSE
    68. MARKET, BY COMPONENT, 2022–2030 (USD MILLION) 71
      1. MEXICO METAVERSE MARKET, BY HARDWARE,
    69. –2030 (USD MILLION) 72
      1. MEXICO METAVERSE MARKET, BY PLATFORM, 2022–2030 (USD
    70. MILLION) 72
    71. MEXICO METAVERSE MARKET, BY TECHNOLOGY, 2022–2030 (USD MILLION) 72
      1. MEXICO METAVERSE
    72. MARKET, BY APPLICATION, 2022–2030 (USD MILLION) 73
      1. MEXICO METAVERSE MARKET, BY END USER, 2022–2030
    73. (USD MILLION) 73
    74. MEXICO METAVERSE MARKET, BY ENTERPRISES, 2022–2030 (USD MILLION) 73
      1. EUROPE 74
        1. EUROPE: METAVERSE
    75. MARKET, BY COUNTRY, 2022–2030 (USD MILLION) 75
      1. EUROPE METAVERSE MARKET, BY COMPONENT, 2022–2030
    76. (USD MILLION) 75
    77. EUROPE METAVERSE MARKET, BY HARDWARE, 2022–2030 (USD MILLION) 76
      1. EUROPE METAVERSE
    78. MARKET, BY PLATFORM, 2022–2030 (USD MILLION) 76
      1. EUROPE METAVERSE MARKET, BY TECHNOLOGY, 2022–2030
    79. (USD MILLION) 77
    80. EUROPE METAVERSE MARKET, BY APPLICATION, 2022–2030 (USD MILLION) 78
      1. EUROPE METAVERSE
    81. MARKET, BY END USER, 2022–2030 (USD MILLION) 79
      1. EUROPE METAVERSE MARKET, BY ENTERPRISES,
    82. –2030 (USD MILLION) 79
      1. GERMANY 80
        1. GERMANY METAVERSE MARKET, BY COMPONENT, 2022–2030 (USD
    83. MILLION) 80
    84. GERMANY METAVERSE MARKET, BY HARDWARE, 2022–2030 (USD MILLION) 80
      1. GERMANY METAVERSE
    85. MARKET, BY PLATFORM, 2022–2030 (USD MILLION) 80
      1. GERMANY METAVERSE MARKET, BY TECHNOLOGY,
    86. –2030 (USD MILLION) 81
      1. GERMANY METAVERSE MARKET, BY APPLICATION, 2022–2030
    87. (USD MILLION) 81
    88. GERMANY METAVERSE MARKET, BY END USER, 2022–2030 (USD MILLION) 81
      1. GERMANY METAVERSE
    89. MARKET, BY ENTERPRISES, 2022–2030 (USD MILLION) 82
      1. FRANCE 82
        1. FRANCE METAVERSE MARKET, BY COMPONENT, 2022–2030
    90. (USD MILLION) 82
    91. FRANCE METAVERSE MARKET, BY HARDWARE, 2022–2030 (USD MILLION) 83
      1. FRANCE METAVERSE
    92. MARKET, BY PLATFORM, 2022–2030 (USD MILLION) 83
      1. FRANCE METAVERSE MARKET, BY TECHNOLOGY,
    93. –2030 (USD MILLION) 83
      1. FRANCE METAVERSE MARKET, BY APPLICATION, 2022–2030 (USD
    94. MILLION) 84
    95. FRANCE METAVERSE MARKET, BY END USER, 2022–2030 (USD MILLION) 84
      1. FRANCE METAVERSE
    96. MARKET, BY ENTERPRISES, 2022–2030 (USD MILLION) 84
      1. UK 85
        1. UK METAVERSE MARKET, BY COMPONENT, 2022–2030
    97. (USD MILLION) 85
    98. UK METAVERSE MARKET, BY HARDWARE, 2022–2030 (USD MILLION) 85
      1. UK METAVERSE MARKET,
    99. BY PLATFORM, 2022–2030 (USD MILLION) 85
      1. UK METAVERSE MARKET, BY TECHNOLOGY, 2022–2030
    100. (USD MILLION) 86
    101. UK METAVERSE MARKET, BY APPLICATION, 2022–2030 (USD MILLION) 86
      1. UK METAVERSE
    102. MARKET, BY END USER, 2022–2030 (USD MILLION) 86
      1. UK METAVERSE MARKET, BY ENTERPRISES, 2022–2030
    103. (USD MILLION) 87
    104. REST OF EUROPE 87
    105. REST OF EUROPE METAVERSE MARKET, BY COMPONENT, 2022–2030 (USD MILLION) 87
      1. REST OF EUROPE
    106. METAVERSE MARKET, BY HARDWARE, 2022–2030 (USD MILLION) 88
      1. REST OF EUROPE METAVERSE
    107. MARKET, BY PLATFORM, 2022–2030 (USD MILLION) 88
      1. REST OF EUROPE METAVERSE MARKET, BY TECHNOLOGY,
    108. –2030 (USD MILLION) 88
      1. REST OF EUROPE METAVERSE MARKET, BY APPLICATION, 2022–2030
    109. (USD MILLION) 89
    110. REST OF EUROPE METAVERSE MARKET, BY END USER, 2022–2030 (USD MILLION) 89
      1. REST OF EUROPE
    111. METAVERSE MARKET, BY ENTERPRISES, 2022–2030 (USD MILLION) 89
      1. ASIA-PACIFIC 90
        1. ASIA-PACIFIC:
    112. METAVERSE MARKET, BY COUNTRY, 2022–2030 (USD MILLION) 91
      1. ASIA-PACIFIC METAVERSE
    113. MARKET, BY COMPONENT, 2022–2030 (USD MILLION) 91
      1. ASIA-PACIFIC METAVERSE MARKET, BY HARDWARE,
    114. –2030 (USD MILLION) 92
      1. ASIA-PACIFIC METAVERSE MARKET, BY PLATFORM, 2022–2030
    115. (USD MILLION) 92
    116. ASIA-PACIFIC METAVERSE MARKET, BY TECHNOLOGY, 2022–2030 (USD MILLION) 93
      1. ASIA-PACIFIC METAVERSE
    117. MARKET, BY APPLICATION, 2022–2030 (USD MILLION) 94
      1. ASIA-PACIFIC METAVERSE MARKET, BY END USER,
    118. –2030 (USD MILLION) 95
      1. ASIA-PACIFIC METAVERSE MARKET, BY ENTERPRISES, 2022–2030
    119. (USD MILLION) 95
      1. CHINA 96
        1. CHINA METAVERSE
    120. MARKET, BY COMPONENT, 2022–2030 (USD MILLION) 96
      1. CHINA METAVERSE MARKET, BY HARDWARE, 2022–2030
    121. (USD MILLION) 96
    122. CHINA METAVERSE MARKET, BY PLATFORM, 2022–2030 (USD MILLION) 96
      1. CHINA METAVERSE
    123. MARKET, BY TECHNOLOGY, 2022–2030 (USD MILLION) 97
      1. CHINA METAVERSE MARKET, BY APPLICATION,
    124. –2030 (USD MILLION) 97
      1. CHINA METAVERSE MARKET, BY END USER, 2022–2030 (USD
    125. MILLION) 97
    126. CHINA METAVERSE MARKET, BY ENTERPRISES, 2022–2030 (USD MILLION) 98
      1. INDIA 98
        1. INDIA METAVERSE
    127. MARKET, BY COMPONENT, 2022–2030 (USD MILLION) 98
      1. INDIA METAVERSE MARKET, BY HARDWARE, 2022–2030
    128. (USD MILLION) 99
    129. INDIA METAVERSE MARKET, BY PLATFORM, 2022–2030 (USD MILLION) 99
      1. INDIA METAVERSE
    130. MARKET, BY TECHNOLOGY, 2022–2030 (USD MILLION) 99
      1. INDIA METAVERSE MARKET, BY APPLICATION,
    131. –2030 (USD MILLION) 100
      1. INDIA METAVERSE MARKET, BY END USER, 2022–2030 (USD
    132. MILLION) 100
    133. INDIA METAVERSE MARKET, BY ENTERPRISES, 2022–2030 (USD MILLION) 100
      1. JAPAN 101
        1. JAPAN METAVERSE
    134. MARKET, BY COMPONENT, 2022–2030 (USD MILLION) 101
      1. JAPAN METAVERSE MARKET, BY HARDWARE, 2022–2030
    135. (USD MILLION) 101
    136. JAPAN METAVERSE MARKET, BY PLATFORM, 2022–2030 (USD MILLION) 101
      1. JAPAN METAVERSE
    137. MARKET, BY TECHNOLOGY, 2022–2030 (USD MILLION) 102
      1. JAPAN METAVERSE MARKET, BY APPLICATION,
    138. –2030 (USD MILLION) 102
      1. JAPAN METAVERSE MARKET, BY END USER, 2022–2030 (USD
    139. MILLION) 102
    140. JAPAN METAVERSE MARKET, BY ENTERPRISES, 2022–2030 (USD MILLION) 103
      1. REST OF ASIA-PACIFIC
    141. REST OF ASIA-PACIFIC METAVERSE MARKET, BY COMPONENT, 2022–2030 (USD MILLION)
    142. REST OF ASIA-PACIFIC METAVERSE MARKET, BY HARDWARE, 2022–2030 (USD MILLION)
    143. REST OF ASIA-PACIFIC METAVERSE MARKET, BY PLATFORM, 2022–2030 (USD MILLION)
    144. REST OF ASIA-PACIFIC METAVERSE MARKET, BY TECHNOLOGY, 2022–2030 (USD MILLION)
    145. REST OF ASIA-PACIFIC METAVERSE MARKET, BY APPLICATION, 2022–2030 (USD MILLION)
    146. REST OF ASIA-PACIFIC METAVERSE MARKET, BY END USER, 2022–2030 (USD MILLION)
    147. REST OF ASIA-PACIFIC METAVERSE MARKET, BY ENTERPRISES, 2022–2030 (USD MILLION)
      1. MIDDLE EAST &
    148. AFRICA 106
    149. MIDDLE EAST & AFRICA METAVERSE MARKET, BY COMPONENT, 2022–2030 (USD MILLION)
    150. MIDDLE EAST & AFRICA METAVERSE MARKET, BY HARDWARE, 2022–2030 (USD MILLION)
    151. MIDDLE EAST & AFRICA METAVERSE MARKET, BY PLATFORM, 2022–2030 (USD MILLION)
    152. MIDDLE EAST & AFRICA METAVERSE MARKET, BY TECHNOLOGY, 2022–2030 (USD MILLION)
    153. MIDDLE EAST & AFRICA METAVERSE MARKET, BY APPLICATION, 2022–2030 (USD
    154. MILLION) 109
    155. MIDDLE EAST & AFRICA METAVERSE MARKET, BY END USER, 2022–2030 (USD MILLION)
    156. MIDDLE EAST & AFRICA METAVERSE MARKET, BY ENTERPRISES, 2022–2030 (USD
    157. MILLION) 110
    158. SOUTH AMERICA 111
    159. SOUTH AMERICA METAVERSE MARKET, BY COMPONENT, 2022–2030 (USD MILLION) 111
      1. SOUTH AMERICA
    160. METAVERSE MARKET, BY HARDWARE, 2022–2030 (USD MILLION) 112
      1. SOUTH AMERICA METAVERSE
    161. MARKET, BY PLATFORM, 2022–2030 (USD MILLION) 112
      1. SOUTH AMERICA METAVERSE MARKET, BY TECHNOLOGY,
    162. –2030 (USD MILLION) 113
      1. SOUTH AMERICA METAVERSE MARKET, BY APPLICATION, 2022–2030
    163. (USD MILLION) 114
    164. SOUTH AMERICA METAVERSE MARKET, BY END USER, 2022–2030 (USD MILLION) 115
      1. SOUTH AMERICA
    165. METAVERSE MARKET, BY ENTERPRISES, 2022–2030 (USD MILLION) 115
    166. COMPETITIVE LANDSCAPE 116
      1. COMPETITIVE BENCHMARKING
      2. THE
    167. SPECIFIC NATIONAL POLICIES 117
      1. THE SPECIFIC GUIDELINES OF INTERNATIONAL ORGANIZATION 118
      2. RECENT DEVELOPMENTS
    168. PARTNERSHIPS/AGREEMENTS/CONTRACTS/COLLABORATIONS 120
      1. BUSINESS EXPANSIONS/ACQUISTIONS 121
        1. PRODUCT LAUNCHES/DEVELOPMENTS
    169. COMPANY
    170. PROFILES 123
    171. META PLATFORMS, INC. 123
      1. COMPANY OVERVIEW 123
        1. FINANCIAL OVERVIEW 124
        2. PRODUCTS/SOLUTIONS/SERVICES OFFERED 124
        3. KEY DEVELOPMENTS
    172. SWOT ANALYSIS 125
    173. KEY STRATEGIES 125
      1. NVIDIA 126
        1. COMPANY OVERVIEW
    174. FINANCIAL OVERVIEW 127
    175. SWOT ANALYSIS 127
    176. KEY DEVELOPMENTS 128
    177. SWOT ANALYSIS 128
    178. KEY STRATEGIES 128
    179. MICROSOFT CORPORATION 129
      1. COMPANY OVERVIEW 129
        1. FINANCIAL OVERVIEW 130
        2. PRODUCTS OFFERED 130
        3. KEY DEVELOPMENTS 131
        4. MICROSOFT CORPORATION: SWOT ANALYSIS 131
        5. KEY STRATEGIES
      2. TENCENT
    180. HOLDINGS LTD 132
    181. COMPANY OVERVIEW 132
    182. FINANCIAL OVERVIEW 133
    183. PRODUCTS OFFERED 133
    184. KEY DEVELOPMENTS 134
    185. SWOT ANALYSIS 134
    186. KEY STRATEGIES 134
    187. BYTEDANCE 135
    188. COMPANY OVERVIEW 135
    189. FINANCIAL OVERVIEW 135
    190. PRODUCTS OFFERED 135
    191. KEY DEVELOPMENTS 135
    192. SWOT ANALYSIS 136
    193. KEY STRATEGIES 136
    194. EPIC GAMES 137
    195. COMPANY OVERVIEW 137
    196. FINANCIAL OVERVIEW 137
    197. PRODUCTS OFFERED 137
    198. KEY DEVELOPMENTS 137
    199. SWOT ANALYSIS 138
    200. KEY STRATEGIES 138
      1. NETEASE INC. 139
        1. COMPANY OVERVIEW
    201. FINANCIAL OVERVIEW 140
    202. PRODUCTS OFFERED 140
    203. KEY DEVELOPMENTS 140
    204. SWOT ANALYSIS 141
    205. KEY STRATEGIES 141
    206. ROBLOX CORPORATION 142
    207. COMPANY OVERVIEW 142
    208. FINANCIAL OVERVIEW 142
    209. PRODUCTS/SERVICES/SOLUTIONS OFFERED 143
      1. KEY DEVELOPMENTS 143
        1. SWOT ANALYSIS 143
        2. KEY STRATEGIES 143
      2. LILITH GAMES 144
        1. COMPANY OVERVIEW 144
        2. FINANCIAL OVERVIEW 144
        3. PRODUCTS OFFERED 144
        4. KEY DEVELOPMENTS 144
      3. NEXTECH AR SOLUTIONS INC. 145
        1. COMPANY OVERVIEW 145
        2. FINANCIAL OVERVIEW
    210. PRODUCTS OFFERED 146
    211. KEY DEVELOPMENTS 146
    212. SWOT ANALYSIS 147
    213. KEY STRATEGIES 147
    214. UNITY SOFTWARE INC. 148
      1. COMPANY OVERVIEW 148
        1. FINANCIAL OVERVIEW 148
        2. PRODUCTS OFFERED 149
        3. KEY DEVELOPMENTS
    215. SWOT ANALYSIS 149
    216. KEY STRATEGIES 150
    217. THE DEVELOPMENT STAGE DIVISION OF THE METAVERSE 40
    218. (USD MILLION) 40
    219. GLOBAL METAVERSE MARKET, BY COMPONENT, 2022–2030 (USD MILLION) 43
    220. MARKET, BY HARDWARE, 2022–2030 (USD MILLION) 43
    221. (USD MILLION) 46
    222. GLOBAL METAVERSE MARKET, BY TECHNOLOGY, 2022–2030 (USD MILLION) 48
    223. MARKET, BY APPLICATION, 2022–2030 (USD MILLION) 51
    224. (USD MILLION) 54
    225. GLOBAL METAVERSE MARKET, BY ENTERPRISES, 2022–2030 (USD MILLION) 55
    226. MARKET, BY REGION, 2022–2030 (USD MILLION) 59
    227. –2030 (USD MILLION) 61
    228. (USD MILLION) 61
    229. NORTH AMERICA METAVERSE MARKET, BY HARDWARE, 2022–2030 (USD MILLION) 62
    230. METAVERSE MARKET, BY PLATFORM, 2022–2030 (USD MILLION) 62
    231. MARKET, BY TECHNOLOGY, 2022–2030 (USD MILLION) 63
    232. –2030 (USD MILLION) 64
    233. (USD MILLION) 65
    234. NORTH AMERICA METAVERSE MARKET, BY ENTERPRISES, 2022–2030 (USD MILLION)
    235. US METAVERSE MARKET, BY COMPONENT, 2022–2030 (USD MILLION) 66
    236. BY HARDWARE, 2022–2030 (USD MILLION) 67
    237. (USD MILLION) 67
    238. US METAVERSE MARKET, BY TECHNOLOGY, 2022–2030 (USD MILLION) 67
    239. MARKET, BY APPLICATION, 2022–2030 (USD MILLION) 68
    240. (USD MILLION) 68
    241. US METAVERSE MARKET, BY ENTERPRISES, 2022–2030 (USD MILLION) 68
    242. MARKET, BY COMPONENT, 2022–2030 (USD MILLION) 69
    243. (USD MILLION) 69
    244. CANADA METAVERSE MARKET, BY PLATFORM, 2022–2030 (USD MILLION) 69
    245. MARKET, BY TECHNOLOGY, 2022–2030 (USD MILLION) 70
    246. –2030 (USD MILLION) 70
    247. MILLION) 70
    248. CANADA METAVERSE MARKET, BY ENTERPRISES, 2022–2030 (USD MILLION) 71
    249. MARKET, BY COMPONENT, 2022–2030 (USD MILLION) 71
    250. (USD MILLION) 72
    251. MEXICO METAVERSE MARKET, BY PLATFORM, 2022–2030 (USD MILLION) 72
    252. MARKET, BY TECHNOLOGY, 2022–2030 (USD MILLION) 72
    253. –2030 (USD MILLION) 73
    254. MILLION) 73
    255. MEXICO METAVERSE MARKET, BY ENTERPRISES, 2022–2030 (USD MILLION) 73
    256. MARKET, BY COUNTRY, 2022–2030 (USD MILLION) 75
    257. (USD MILLION) 75
    258. EUROPE METAVERSE MARKET, BY HARDWARE, 2022–2030 (USD MILLION) 76
    259. MARKET, BY PLATFORM, 2022–2030 (USD MILLION) 76
    260. –2030 (USD MILLION) 77
    261. MILLION) 78
    262. EUROPE METAVERSE MARKET, BY END USER, 2022–2030 (USD MILLION) 79
    263. MARKET, BY ENTERPRISES, 2022–2030 (USD MILLION) 79
    264. –2030 (USD MILLION) 80
    265. MILLION) 80
    266. GERMANY METAVERSE MARKET, BY PLATFORM, 2022–2030 (USD MILLION) 80
    267. MARKET, BY TECHNOLOGY, 2022–2030 (USD MILLION) 81
    268. –2030 (USD MILLION) 81
    269. MILLION) 81
    270. GERMANY METAVERSE MARKET, BY ENTERPRISES, 2022–2030 (USD MILLION) 82
    271. MARKET, BY COMPONENT, 2022–2030 (USD MILLION) 82
    272. (USD MILLION) 83
    273. FRANCE METAVERSE MARKET, BY PLATFORM, 2022–2030 (USD MILLION) 83
    274. MARKET, BY TECHNOLOGY, 2022–2030 (USD MILLION) 83
    275. –2030 (USD MILLION) 84
    276. MILLION) 84
    277. FRANCE METAVERSE MARKET, BY ENTERPRISES, 2022–2030 (USD MILLION) 84
    278. MARKET, BY COMPONENT, 2022–2030 (USD MILLION) 85
    279. (USD MILLION) 85
    280. UK METAVERSE MARKET, BY PLATFORM, 2022–2030 (USD MILLION) 85
    281. MARKET, BY TECHNOLOGY, 2022–2030 (USD MILLION) 86
    282. (USD MILLION) 86
    283. UK METAVERSE MARKET, BY END USER, 2022–2030 (USD MILLION) 86
    284. MARKET, BY ENTERPRISES, 2022–2030 (USD MILLION) 87
    285. –2030 (USD MILLION) 87
    286. (USD MILLION) 88
    287. REST OF EUROPE METAVERSE MARKET, BY PLATFORM, 2022–2030 (USD MILLION) 88
    288. METAVERSE MARKET, BY TECHNOLOGY, 2022–2030 (USD MILLION) 88
    289. MARKET, BY APPLICATION, 2022–2030 (USD MILLION) 89
    290. USER, 2022–2030 (USD MILLION) 89
    291. –2030 (USD MILLION) 89
    292. (USD MILLION) 91
    293. ASIA-PACIFIC METAVERSE MARKET, BY COMPONENT, 2022–2030 (USD MILLION) 91
    294. METAVERSE MARKET, BY HARDWARE, 2022–2030 (USD MILLION) 92
    295. MARKET, BY PLATFORM, 2022–2030 (USD MILLION) 92
    296. –2030 (USD MILLION) 93
    297. (USD MILLION) 94
    298. ASIA-PACIFIC METAVERSE MARKET, BY END USER, 2022–2030 (USD MILLION) 95
    299. METAVERSE MARKET, BY ENTERPRISES, 2022–2030 (USD MILLION) 95
    300. BY COMPONENT, 2022–2030 (USD MILLION) 96
    301. (USD MILLION) 96
    302. CHINA METAVERSE MARKET, BY PLATFORM, 2022–2030 (USD MILLION) 96
    303. MARKET, BY TECHNOLOGY, 2022–2030 (USD MILLION) 97
    304. –2030 (USD MILLION) 97
    305. MILLION) 97
    306. CHINA METAVERSE MARKET, BY ENTERPRISES, 2022–2030 (USD MILLION) 98
    307. MARKET, BY COMPONENT, 2022–2030 (USD MILLION) 98
    308. (USD MILLION) 99
    309. INDIA METAVERSE MARKET, BY PLATFORM, 2022–2030 (USD MILLION) 99
    310. MARKET, BY TECHNOLOGY, 2022–2030 (USD MILLION) 99
    311. –2030 (USD MILLION) 100
    312. MILLION) 100
    313. INDIA METAVERSE MARKET, BY ENTERPRISES, 2022–2030 (USD MILLION) 100
    314. MARKET, BY COMPONENT, 2022–2030 (USD MILLION) 101
    315. (USD MILLION) 101
    316. JAPAN METAVERSE MARKET, BY PLATFORM, 2022–2030 (USD MILLION) 101
    317. MARKET, BY TECHNOLOGY, 2022–2030 (USD MILLION) 102
    318. –2030 (USD MILLION) 102
    319. MILLION) 102
    320. JAPAN METAVERSE MARKET, BY ENTERPRISES, 2022–2030 (USD MILLION) 103
    321. METAVERSE MARKET, BY COMPONENT, 2022–2030 (USD MILLION) 103
    322. METAVERSE MARKET, BY HARDWARE, 2022–2030 (USD MILLION) 104
    323. METAVERSE MARKET, BY PLATFORM, 2022–2030 (USD MILLION) 104
    324. METAVERSE MARKET, BY TECHNOLOGY, 2022–2030 (USD MILLION) 104
    325. METAVERSE MARKET, BY APPLICATION, 2022–2030 (USD MILLION) 105
    326. METAVERSE MARKET, BY END USER, 2022–2030 (USD MILLION) 105
    327. METAVERSE MARKET, BY ENTERPRISES, 2022–2030 (USD MILLION) 105
    328. METAVERSE MARKET, BY COMPONENT, 2022–2030 (USD MILLION) 106
    329. METAVERSE MARKET, BY HARDWARE, 2022–2030 (USD MILLION) 107
    330. METAVERSE MARKET, BY PLATFORM, 2022–2030 (USD MILLION) 107
    331. METAVERSE MARKET, BY TECHNOLOGY, 2022–2030 (USD MILLION) 108
    332. METAVERSE MARKET, BY APPLICATION, 2022–2030 (USD MILLION) 109
    333. METAVERSE MARKET, BY END USER, 2022–2030 (USD MILLION) 110
    334. METAVERSE MARKET, BY ENTERPRISES, 2022–2030 (USD MILLION) 110
    335. MARKET, BY COMPONENT, 2022–2030 (USD MILLION) 111
    336. –2030 (USD MILLION) 112
    337. (USD MILLION) 112
    338. SOUTH AMERICA METAVERSE MARKET, BY TECHNOLOGY, 2022–2030 (USD MILLION)
    339. SOUTH AMERICA METAVERSE MARKET, BY APPLICATION, 2022–2030 (USD MILLION) 114
    340. METAVERSE MARKET, BY END USER, 2022–2030 (USD MILLION) 115
    341. MARKET, BY ENTERPRISES, 2022–2030 (USD MILLION) 115
    342. GUIDELINES OF INTERNATIONAL ORGANIZATION 118
    343. PARTNERSHIPS/AGREEMENTS/CONTRACTS/COLLABORATIONS 120
    344. META PLATFORMS INC.: PRODUCTS/SOLUTIONS/SERVICES OFFERED 124
    345. ANALYSIS 127
    346. NVIDIA: KEY DEVELOPMENTS 128
    347. KEY DEVELOPMENTS 131
    348. TENCENT HOLDINGS LTD.: PRODUCTS OFFERED 133
    349. BYTEDANCE.: PRODUCTS OFFERED 135
    350. KEY DEVELOPMENTS 137
    351. NETEASE INC.: PRODUCTS OFFERED 140
    352. ROBLOX CORPORATION.: KEY DEVELOPMENTS 143
    353. SOLUTIONS INC.: PRODUCTS OFFERED 146
    354. INC.: PRODUCTS OFFERED 149
    355. ANALYSIS: GLOBAL METAVERSE MARKET 21
    356. TOP-DOWN APPROACHES 29
    357. PORTER''S FIVE FORCES ANALYSIS OF THE GLOBAL METAVERSE MARKET 38
    358. 2030 (MILLION) 41
    359. GLOBAL METAVERSE MARKET, BY COMPONENT, 2024 (% SHARE) 42
    360. VS 2030 (USD MILLION) 42
    361. MARKET, BY PLATFORM, 2022 VS 2030 (USD MILLION) 45
    362. (% SHARE) 47
    363. GLOBAL METAVERSE MARKET, BY TECHNOLOGY, 2022 VS 2030 (USD MILLION) 47
    364. MARKET, BY APPLICATION, 2024 (% SHARE) 50
    365. VS 2030 (USD MILLION) 50
    366. MARKET, BY END USER, 2022 VS 2030 (USD MILLION) 53
    367. (% SHARE) 54
    368. GLOBAL METAVERSE MARKET, BY ENTERPRISES, 2022 VS 2030 (USD MILLION) 55
    369. MARKET, BY REGION, 2024 (% SHARE) 58
    370. (USD MILLION) 59
    371. NORTH AMERICA METAVERSE MARKET, BY COUNTRY, 2024 (% SHARE) 60
    372. MARKET, BY COUNTRY, 2022 VS 2030 (USD MILLION) 60
    373. 2030 (USD MILLION) 61
    374. MILLION) 62
    375. NORTH AMERICA METAVERSE MARKET, BY TECHNOLOGY, 2022-2030 (USD MILLION) 63
    376. METAVERSE MARKET, BY APPLICATION, 2022-2030 (USD MILLION) 64
    377. USER, 2022-2030 (USD MILLION) 65
    378. MARKET, BY COUNTRY, 2022 VS 2030 (USD MILLION) 74
    379. 2030 (USD MILLION) 75
    380. EUROPE METAVERSE MARKET, BY TECHNOLOGY, 2022-2030 (USD MILLION) 77
    381. BY APPLICATION, 2022-2030 (USD MILLION) 78
    382. (USD MILLION) 79
    383. ASIA-PACIFIC METAVERSE MARKET, BY COUNTRY, 2024 (% SHARE) 90
    384. MARKET, BY COUNTRY, 2022 VS 2030 (USD MILLION) 90
    385. 2030 (USD MILLION) 91
    386. MILLION) 92
    387. ASIA-PACIFIC METAVERSE MARKET, BY TECHNOLOGY, 2022-2030 (USD MILLION) 93
    388. METAVERSE MARKET, BY APPLICATION, 2022-2030 (USD MILLION) 94
    389. 2030 (USD MILLION) 95
    390. 2030 (USD MILLION) 106
    391. (USD MILLION) 107
    392. MIDDLE EAST & AFRICA METAVERSE MARKET, BY TECHNOLOGY, 2022-2030 (USD MILLION)
    393. MIDDLE EAST & AFRICA METAVERSE MARKET, BY APPLICATION, 2022-2030 (USD MILLION)
    394. MIDDLE EAST & AFRICA METAVERSE MARKET, BY END USER, 2022-2030 (USD MILLION)
    395. SOUTH AMERICA METAVERSE MARKET, BY COMPONENT, 2022-2030 (USD MILLION) 111
    396. METAVERSE MARKET, BY PLATFORM, 2022-2030 (USD MILLION) 112
    397. 2030 (USD MILLION) 113
    398. (USD MILLION) 114
    399. SOUTH AMERICA METAVERSE MARKET, BY END USER, 2022-2030 (USD MILLION) 115
    400. MARKET: COMPETITIVE BENCHMARKING 116
    401. META PLATFORMS INC.: SWOT ANALYSIS 125
    402. ANALYSIS 128
    403. MICROSOFT CORPORATION: FINANCIAL OVERVIEW SNAPSHOT 130
    404. LTD.: FINANCIAL OVERVIEW SNAPSHOT 133
    405. SWOT ANALYSIS 136
    406. EPIC GAMES: SWOT ANALYSIS 138
    407. ANALYSIS 141
    408. ROBLOX CORPORATION.: FINANCIAL OVERVIEW SNAPSHOT 142
    409. SOLUTIONS INC.: FINANCIAL OVERVIEW SNAPSHOT 145
    410. UNITY SOFTWARE INC.: FINANCIAL OVERVIEW 148

    Metaverse Market Segmentation

    Metaverse Component Outlook (USD Billion, 2018-2030)

    • Hardware
    • Software

    Metaverse Platform Outlook (USD Billion, 2018-2030)

    • Desktop/Laptops
    • Mobile
    • Wearables

    Metaverse Technology Outlook (USD Billion, 2018-2030)

    • Blockchain
    • VR & AR
    • Mixed Reality
    • Others

    Metaverse Application Outlook (USD Billion, 2018-2030)

    • Gaming
    • Online Shopping
    • Content Creation
    • Social Media
    • Others

    Metaverse End User Outlook (USD Billion, 2018-2030)

    • Consumer
    • Enterprises

    Metaverse Regional Outlook (USD Billion, 2018-2030)

    • North America Outlook (USD Billion, 2018-2030)
      • North America Metaverse by Component
        • Hardware
        • Software
      • North America Metaverse by Platform
        • Desktop/Laptops
        • Mobile
        • Wearables
      • North America Metaverse by End User
        • Consumer
        • Enterprises
      • North America Metaverse by Technology
        • Blockchain
        • VR & AR
        • Mixed Reality
        • Others
      • North America Metaverse by Application
        • Gaming
        • Online Shopping
        • Content Creation
        • Social Media
        • Others
      • US Outlook (USD Billion, 2018-2030)
      • US Metaverse by Component
        • Hardware
        • Software
      • US Metaverse by Platform
        • Desktop/Laptops
        • Mobile
        • Wearables
      • US Metaverse by End User
        • Consumer
        • Enterprises
      • US Metaverse by Technology
        • Blockchain
        • VR & AR
        • Mixed Reality
        • Others
      • US Metaverse by Application
        • Gaming
        • Online Shopping
        • Content Creation
        • Social Media
        • Others
      • CANADA Outlook (USD Billion, 2018-2030)
      • CANADA Metaverse by Component
        • Hardware
        • Software
      • CANADA Metaverse by Platform
        • Desktop/Laptops
        • Mobile
        • Wearables
      • CANADA Metaverse by End User
        • Consumer
        • Enterprises
      • CANADA Metaverse by Technology
        • Blockchain
        • VR & AR
        • Mixed Reality
        • Others
      • CANADA Metaverse by Application
        • Gaming
        • Online Shopping
        • Content Creation
        • Social Media
        • Others
      • Europe Outlook (USD Billion, 2018-2030)
        • Europe Metaverse by Component
          • Hardware
          • Software
        • Europe Metaverse by Platform
          • Desktop/Laptops
          • Mobile
          • Wearables
        • Europe Metaverse by End User
          • Consumer
          • Enterprises
        • Europe Metaverse by Technology
          • Blockchain
          • VR & AR
          • Mixed Reality
          • Others
        • Europe Metaverse by Application
          • Gaming
          • Online Shopping
          • Content Creation
          • Social Media
          • Others
        • Germany Outlook (USD Billion, 2018-2030)
        • Germany Metaverse by Component
          • Hardware
          • Software
        • Germany Metaverse by Platform
          • Desktop/Laptops
          • Mobile
          • Wearables
        • Germany Metaverse by End User
          • Consumer
          • Enterprises
        • Germany Metaverse by Technology
          • Blockchain
          • VR & AR
          • Mixed Reality
          • Others
        • Germany Metaverse by Application
          • Gaming
          • Online Shopping
          • Content Creation
          • Social Media
          • Others
        • France Outlook (USD Billion, 2018-2030)
        • France Metaverse by Component
          • Hardware
          • Software
        • France Metaverse by Platform
          • Desktop/Laptops
          • Mobile
          • Wearables
        • France Metaverse by End User
          • Consumer
          • Enterprises
        • France Metaverse by Technology
          • Blockchain
          • VR & AR
          • Mixed Reality
          • Others
        • France Metaverse by Application
          • Gaming
          • Online Shopping
          • Content Creation
          • Social Media
          • Others
        • UK Outlook (USD Billion, 2018-2030)
        • UK Metaverse by Component
          • Hardware
          • Software
        • UK Metaverse by Platform
          • Desktop/Laptops
          • Mobile
          • Wearables
        • UK Metaverse by End User
          • Consumer
          • Enterprises
        • UK Metaverse by Technology
          • Blockchain
          • VR & AR
          • Mixed Reality
          • Others
        • UK Metaverse by Application
          • Gaming
          • Online Shopping
          • Content Creation
          • Social Media
          • Others
        • ITALY Outlook (USD Billion, 2018-2030)
        • ITALY Metaverse by Component
          • Hardware
          • Software
        • ITALY Metaverse by Platform
          • Desktop/Laptops
          • Mobile
          • Wearables
        • ITALY Metaverse by End User
          • Consumer
          • Enterprises
        • ITALY Metaverse by Technology
          • Blockchain
          • VR & AR
          • Mixed Reality
          • Others
        • ITALY Metaverse by Application
          • Gaming
          • Online Shopping
          • Content Creation
          • Social Media
          • Others


    • SPAIN Outlook (USD Billion, 2018-2030)
    • Spain Metaverse by Component
      • Hardware
      • Software
    • Spain Metaverse by Platform
      • Desktop/Laptops
      • Mobile
      • Wearables
    • Spain Metaverse by End User
      • Consumer
      • Enterprises
    • Spain Metaverse by Technology
      • Blockchain
      • VR & AR
      • Mixed Reality
      • Others
    • Spain Metaverse by Application
      • Gaming
      • Online Shopping
      • Content Creation
      • Social Media
      • Others
    • Rest Of Europe Outlook (USD Billion, 2018-2030)
    • Rest Of Europe Metaverse by Component
      • Hardware
      • Software
    • REST OF EUROPE Metaverse by Platform
      • Desktop/Laptops
      • Mobile
      • Wearables
    • REST OF EUROPE Metaverse by End User
      • Consumer
      • Enterprises
    • REST OF EUROPE Metaverse by Technology
      • Blockchain
      • VR & AR
      • Mixed Reality
      • Others
    • REST OF EUROPE Metaverse by Application
      • Gaming
      • Online Shopping
      • Content Creation
      • Social Media
      • Others
    • Asia-Pacific Outlook (USD Billion, 2018-2030)
      • Asia-Pacific Metaverse by Component
        • Hardware
        • Software
      • Asia-Pacific Metaverse by Platform
        • Desktop/Laptops
        • Mobile
        • Wearables
      • Asia-Pacific Metaverse by End User
        • Consumer
        • Enterprises
      • Asia-Pacific Metaverse by Technology
        • Blockchain
        • VR & AR
        • Mixed Reality
        • Others
      • Asia-Pacific Metaverse by Application
        • Gaming
        • Online Shopping
        • Content Creation
        • Social Media
        • Others
      • China Outlook (USD Billion, 2018-2030)
      • China Metaverse by Component
        • Hardware
        • Software
      • China Metaverse by Platform
        • Desktop/Laptops
        • Mobile
        • Wearables
      • China Metaverse by End User
        • Consumer
        • Enterprises
      • China Metaverse by Technology
        • Blockchain
        • VR & AR
        • Mixed Reality
        • Others
      • China Metaverse by Application
        • Gaming
        • Online Shopping
        • Content Creation
        • Social Media
        • Others
      • Japan Outlook (USD Billion, 2018-2030)
      • Japan Metaverse by Component
        • Hardware
        • Software
      • Japan Metaverse by Platform
        • Desktop/Laptops
        • Mobile
        • Wearables
      • Japan Metaverse by End User
        • Consumer
        • Enterprises
      • Japan Metaverse by Technology
        • Blockchain
        • VR & AR
        • Mixed Reality
        • Others
      • Japan Metaverse by Application
        • Gaming
        • Online Shopping
        • Content Creation
        • Social Media
        • Others
      • India Outlook (USD Billion, 2018-2030)
      • India Metaverse by Component
        • Hardware
        • Software
      • India Metaverse by Platform
        • Desktop/Laptops
        • Mobile
        • Wearables
      • India Metaverse by End User
        • Consumer
        • Enterprises
      • India Metaverse by Technology
        • Blockchain
        • VR & AR
        • Mixed Reality
        • Others
      • India Metaverse by Application
        • Gaming
        • Online Shopping
        • Content Creation
        • Social Media
        • Others
      • Australia Outlook (USD Billion, 2018-2030)
      • Australia Metaverse by Component
        • Hardware
        • Software
      • Australia Metaverse by Platform
        • Desktop/Laptops
        • Mobile
        • Wearables
      • Australia Metaverse by End User
        • Consumer
        • Enterprises
      • Australia Metaverse by Technology
        • Blockchain
        • VR & AR
        • Mixed Reality
        • Others
      • Australia Metaverse by Application
        • Gaming
        • Online Shopping
        • Content Creation
        • Social Media
        • Others
      • Rest of Asia-Pacific Outlook (USD Billion, 2018-2030)
      • Rest of Asia-Pacific Metaverse by Component
        • Hardware
        • Software
      • Rest of Asia-Pacific Metaverse by Platform
        • Desktop/Laptops
        • Mobile
        • Wearables
      • Rest of Asia-Pacific Metaverse by End User
        • Consumer
        • Enterprises
      • Rest of Asia-Pacific Metaverse by Technology
        • Blockchain
        • VR & AR
        • Mixed Reality
        • Others
      • Rest of Asia Pacific Metaverse by Application
        • Gaming
        • Online Shopping
        • Content Creation
        • Social Media
        • Others
      • Rest of the World Outlook (USD Billion, 2018-2030)
        • Rest of the World Metaverse by Component
          • Hardware
          • Software
        • Rest of the World Metaverse by Platform
          • Desktop/Laptops
          • Mobile
          • Wearables
        • Rest of the World Metaverse by End User
          • Consumer
          • Enterprises
        • Rest of the World Metaverse by Technology
          • Blockchain
          • VR & AR
          • Mixed Reality
          • Others
        • Rest of the World Metaverse by Application
          • Gaming
          • Online Shopping
          • Content Creation
          • Social Media
          • Others


    • Middle East Outlook (USD Billion, 2018-2030)
    • Middle East Metaverse by Component
      • Hardware
      • Software
    • Middle East Metaverse by Platform
      • Desktop/Laptops
      • Mobile
      • Wearables
    • Middle East Metaverse by End User
      • Consumer
      • Enterprises
    • Middle East Metaverse by Technology
      • Blockchain
      • VR & AR
      • Mixed Reality
      • Others
    • Middle East Metaverse by Application
      • Gaming
      • Online Shopping
      • Content Creation
      • Social Media
      • Others
    • Africa Outlook (USD Billion, 2018-2030)
    • Africa Metaverse by Component
      • Hardware
      • Software
    • Africa Metaverse by Platform
      • Desktop/Laptops
      • Mobile
      • Wearables
    • Africa Metaverse by End User
      • Consumer
      • Enterprises
    • Africa Metaverse by Technology
      • Blockchain
      • VR & AR
      • Mixed Reality
      • Others
    • Africa Metaverse by Application
      • Gaming
      • Online Shopping
      • Content Creation
      • Social Media
      • Others
    • Latin America Outlook (USD Billion, 2018-2030)
    • Latin America Metaverse by Component
      • Hardware
      • Software
    • Latin America Metaverse by Platform
      • Desktop/Laptops
      • Mobile
      • Wearables
    • Latin America Metaverse by End User
      • Consumer
      • Enterprises
    • Latin America Metaverse by Technology
      • Blockchain
      • VR & AR
      • Mixed Reality
      • Others
    • Latin America Metaverse by Application
      • Gaming
      • Online Shopping
      • Content Creation
      • Social Media
      • Others


    Metaverse Market Research Report - Global Forecast till 2030 Infographic
    Free Sample Request

    Kindly complete the form below to receive a free sample of this Report

    Customer Strories

    “I am very pleased with how market segments have been defined in a relevant way for my purposes (such as "Portable Freezers & refrigerators" and "last-mile"). In general the report is well structured. Thanks very much for your efforts.”

    Victoria Milne Founder
    Case Study

    Chemicals and Materials