• Cat-intel
  • MedIntelliX
  • Resources
  • About Us
  • Request Free Sample ×

    Kindly complete the form below to receive a free sample of this Report

    Leading companies partner with us for data-driven Insights

    clients tt-cursor

    Augmented Analytics Market

    ID: MRFR/ICT/5995-HCR
    100 Pages
    Shubham Munde
    September 2025

    Augmented Analytics Market Research Report: By Deployment Mode (Cloud, On-Premises, Hybrid), By Component (Software, Services, Platforms), By End User (BFSI, Healthcare, Retail, Manufacturing, IT and Telecommunications), By Function (Data Discovery, Data Preparation, Data Visualization, Data Integration) and By Regional (North America, Europe, South America, Asia Pacific, Middle East and Africa) - Forecast to 2032.

    Share:
    Download PDF ×

    We do not share your information with anyone. However, we may send you emails based on your report interest from time to time. You may contact us at any time to opt-out.

    Augmented Analytics Market Research Report - Global Forecast till 2032 Infographic
    Purchase Options
    $ 4,950.0
    $ 5,950.0
    $ 7,250.0
    Table of Contents

    Augmented Analytics Market Summary

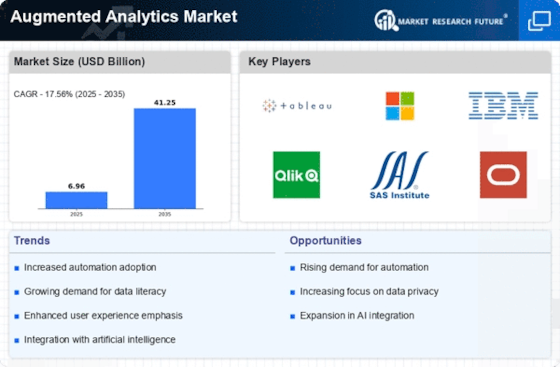
    The Global Augmented Analytics Market is projected to grow significantly from 6.97 USD Billion in 2024 to 41.3 USD Billion by 2035.

    Key Market Trends & Highlights

    Augmented Analytics Key Trends and Highlights

    • The market is expected to experience a compound annual growth rate (CAGR) of 17.54% from 2025 to 2035.
    • By 2035, the market valuation is anticipated to reach 41.3 USD Billion, indicating robust growth potential.
    • In 2024, the market is valued at 6.97 USD Billion, laying a strong foundation for future expansion.
    • Growing adoption of augmented analytics due to increasing demand for data-driven decision making is a major market driver.

    Market Size & Forecast

    2024 Market Size 6.97 (USD Billion)
    2035 Market Size 41.3 (USD Billion)
    CAGR (2025-2035) 17.54%

    Major Players

    Domo, Salesforce, Looker, Tableau Software, Sisense, Qlik, TIBCO Software, SAP, Oracle, Alteryx, Zoho, IBM, Microsoft, ThoughtSpot, MicroStrategy

    Augmented Analytics Market Trends

    The Global Augmented Analytics Market is experiencing significant growth driven by the increasing need for data-driven decision-making among businesses. Organizations are leveraging augmented analytics to automate data preparation and enable faster insights with less reliance on data scientists. The rise in data volume and complexity, coupled with the need for real-time analytics, is propelling businesses to adopt advanced analytics solutions.

    Furthermore, the integration of artificial intelligence and machine learning into analytics tools is enhancing the ability to identify trends and patterns that may not be readily visible to human analysts.Opportunities abound for businesses looking to capture market share in augmented analytics through the development of user-friendly platforms that cater to both technical and non-technical users. As remote work and digital transformation continue to accelerate, organizations are eager for solutions that provide seamless access to data insights from anywhere.

    There is also a growing demand for industry-specific analytics tools that can address unique challenges and optimize operational efficiencies, which presents an avenue for innovation and market growth. Recent trends indicate a shift towards self-service analytics, allowing users to create reports and derive insights without extensive technical training.This democratization of data is making analytics more accessible and fostering a culture of data-driven decision-making within organizations. The rise of cloud-based analytics solutions is also notable, as they offer scalability and flexibility, which is important for organizations looking to adapt quickly in a dynamic business environment.

    Additionally, the focus on data privacy and security is becoming increasingly vital, prompting solutions that not only provide analytics but also ensure compliance with regulatory requirements. Overall, the market for augmented analytics is poised for robust growth, with various opportunities waiting to be tapped.

    Fig 1: Augmented Analytics Market Overview

    Source: Primary Research, Secondary Research, Market Research Future Database and Analyst Review

    The integration of advanced machine learning techniques within augmented analytics is poised to transform data analysis, enabling organizations to derive actionable insights with unprecedented speed and accuracy.

    U.S. Department of Commerce

    Augmented Analytics Market Drivers

    Market Growth Projections

    The Global Augmented Analytics Market Industry is poised for substantial growth, with projections indicating a market size of 6.97 USD Billion in 2024 and an anticipated increase to 41.3 USD Billion by 2035. This growth trajectory suggests a compound annual growth rate of 17.54% from 2025 to 2035. Such figures reflect the increasing adoption of augmented analytics solutions across various sectors, driven by the need for data-driven decision-making and enhanced business intelligence capabilities. As organizations continue to recognize the value of leveraging advanced analytics, the market is expected to expand significantly in the coming years.

    Increasing Volume of Data Generated

    The exponential growth of data generated across industries is a crucial factor propelling the Global Augmented Analytics Market Industry. With the proliferation of IoT devices, social media, and digital transactions, organizations are inundated with vast amounts of data. This data deluge necessitates advanced analytics solutions capable of processing and deriving actionable insights from complex datasets. As businesses seek to harness the power of big data, the demand for augmented analytics tools is expected to rise. By 2035, the market is anticipated to reach 41.3 USD Billion, underscoring the critical role of augmented analytics in managing and interpreting large volumes of information.

    Rising Demand for Data-Driven Decision Making

    The Global Augmented Analytics Market Industry is experiencing a surge in demand for data-driven decision-making processes. Organizations across various sectors are increasingly recognizing the value of leveraging data analytics to enhance operational efficiency and strategic planning. In 2024, the market is projected to reach 6.97 USD Billion, reflecting a growing trend towards integrating advanced analytics tools. This shift is driven by the need for real-time insights and predictive analytics, which enable businesses to respond swiftly to market changes. As companies strive to maintain a competitive edge, the adoption of augmented analytics solutions is likely to accelerate, fostering innovation and growth.

    Need for Enhanced Business Intelligence Solutions

    The Global Augmented Analytics Market Industry is driven by the increasing need for enhanced business intelligence solutions. Organizations are striving to improve their decision-making processes by utilizing advanced analytics tools that provide deeper insights into business performance. Traditional business intelligence methods often fall short in delivering real-time analytics and predictive capabilities. Augmented analytics addresses these limitations by automating data preparation and analysis, enabling users to uncover insights without requiring extensive technical expertise. This democratization of data analytics is likely to attract a broader range of users, further fueling market growth as companies seek to leverage data for strategic advantage.

    Growing Focus on Customer Experience and Personalization

    A growing focus on customer experience and personalization is significantly influencing the Global Augmented Analytics Market Industry. Businesses are increasingly leveraging data analytics to understand customer preferences and behaviors, allowing for tailored marketing strategies and improved service delivery. By utilizing augmented analytics, organizations can analyze customer data in real-time, enabling them to make informed decisions that enhance customer satisfaction. This trend is particularly evident in sectors such as retail and e-commerce, where personalized experiences are paramount. As companies prioritize customer-centric approaches, the demand for augmented analytics solutions is likely to rise, driving market expansion.

    Advancements in Artificial Intelligence and Machine Learning

    Technological advancements in artificial intelligence and machine learning are pivotal drivers of the Global Augmented Analytics Market Industry. These technologies enhance data processing capabilities, allowing for more sophisticated analysis and interpretation of large datasets. The integration of AI and ML into analytics platforms enables organizations to automate insights generation, thereby reducing the time required for data analysis. This trend is expected to contribute significantly to the market's growth, with projections indicating a compound annual growth rate of 17.54% from 2025 to 2035. As businesses increasingly adopt AI-driven analytics solutions, the demand for augmented analytics is likely to expand.

    Market Segment Insights

    Augmented Analytics Market Deployment Mode Insights

    The Deployment Mode segment of the Global Augmented Analytics Market reflects significant growth dynamics, highlighting the importance of different deployment models in how analytics solutions are operated and utilized. In the year 2023, the Global Augmented Analytics Market was valued at 5.92 USD Billion, with the Deployment Mode segment playing a crucial role in this valuation. By 2032, this valuation is projected to escalate substantially, emphasizing the growth and transformation within the industry.

    Among the various deployment models, the Cloud segment stands out as a major contributor, with a market value of 2.2 USD Billion in 2023, anticipated to grow to 10.0 USD Billion by 2032. This growth is driven by organizations seeking scalability, cost-effectiveness, and ease of access to analytics tools without substantial hardware investments. The adoption of cloud-based solutions fosters collaboration and remote access, aligning with modern business practices.

    In contrast, the On-Premises segment showed a valuation of 2.0 USD Billion in 2023 and is expected to rise to 8.5 USD Billion by 2032. This segment remains significant for organizations that require strict data governance, control, and customization typical of their unique operational environments. Companies in regulated sectors may lean towards on-premises solutions due to security and compliance concerns, fundamentally supporting its persistent demand despite the overarching trend towards cloud solutions.

    Additionally, the Hybrid deployment model, valued at 1.72 USD Billion in 2023 and projected to reach 6.9 USD Billion by 2032, reflects a blend of both cloud and on-premises solutions. This model presents advantages, as it allows businesses to enjoy the flexibility and scalability of cloud services while retaining critical and sensitive data on-premises. The importance of the Hybrid model is becoming apparent as organizations look to create resilient architectures that leverage the strengths of both deployment methods.

    Each model is becoming increasingly significant in their respective environments; the Cloud model demonstrates dominance in terms of market value and adoption trends, while On-Premises caters to specific industry needs.

    Hybrid deployment leads to versatility, accommodating diverse business needs, which is pivotal in driving innovations within the Global Augmented Analytics Market. These deployment modes reflect a broader trend in the market growth that is shaped by evolving business requirements, technological advancements, and changing user preferences, providing various opportunities for organizations to optimize their augmented analytics strategies. The interest in such models highlights the critical role of Deployment Mode in the overall landscape of the Global Augmented Analytics Market revenue and segmentation.

    Fig 2: Augmented Analytics Market Insights

    Augmented Analytics Market Insights

    Source: Primary Research, Secondary Research, Market Research Future Database and Analyst Review

    Augmented Analytics Market Component Insights

    This segment encompasses various elements, including Software, Services and Platforms, each playing a crucial role in enhancing data analysis through augmented technologies. Software solutions are essential as they enable organizations to automate data-driven insights, aiding decision-making and operational efficiency. Services, meanwhile, provide critical support and expertise, which are vital for the successful implementation and maintenance of augmented analytics tools, allowing businesses to harness maximum value from their data.Platforms represent a significant area of focus, offering comprehensive environments where these analytics tools can operate seamlessly, thereby facilitating integration and scalability.

    As businesses increasingly recognize the importance of leveraging data for strategic decisions, the Global Augmented Analytics Market segmentation illustrates a comprehensive approach to digital transformation, reflecting market growth opportunities that arise from the ongoing demand for advanced data capabilities. The strong trajectory of this market is bolstered by advancements in technology and rising data volumes.

    Augmented Analytics Market End User Insights

    This growth is propelled by the increasing demand for data-driven decision-making and advanced analytics capabilities across multiple industries. In particular, the BFSI sector plays a crucial role in adopting augmented analytics to enhance risk management and customer experience, thereby revolutionizing traditional banking practices. Similarly, the healthcare industry is utilizing these tools to improve patient outcomes by leveraging data for efficient care delivery.The retail sector benefits from augmented analytics by optimizing inventory management and personalizing customer experiences, demonstrating a move towards a more customer-centric approach. Moreover, manufacturing is embracing these technologies to streamline operations and reduce costs through predictive maintenance.

    The IT and telecommunications industries represent a growing segment focusing on enhancing operational efficiency and service delivery through improved data insights. Each of these sectors contributes to the Global Augmented Analytics Market revenue, underscoring their importance in the overall market landscape.As the market evolves through 2032, the burgeoning demand in these sectors is expected to create numerous opportunities while presenting challenges related to data security and integration.

    Augmented Analytics Market Function Insights

    The market growth is primarily driven by the increasing demand for advanced data analysis tools that facilitate informed decision-making across industries. Key functions in this market include Data Discovery, Data Preparation, Data Visualization and Data Integration. Data Discovery plays a significant role in enabling organizations to uncover hidden patterns and insights within their data, enhancing strategic planning.Data Preparation is crucial for ensuring that data is clean and usable, thereby optimizing analysis processes. Data Visualization presents complex data in an understandable manner, helping stakeholders to grasp insights effortlessly, which is key in a visually driven world.

    In addition, Data Integration dominates as organizations increasingly seek to unify disparate data sources for comprehensive analytics. These functions are essential to the overall growth of the Global Augmented Analytics Market, as they cater to the rising need for effective and insightful data usage in business strategies.Market data indicates that ongoing advancements will continue to shape these functions, expanding their relevance in the coming years. The expected growth of the market underscores the importance of these functions in addressing the challenges faced by various industries in leveraging data effectively.

    Regional Insights

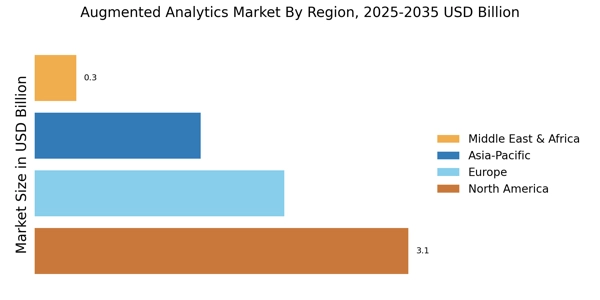
    Among the regions, North America holds a majority share with a valuation of 2.44 USD Billion in 2023, growing to 10.7 USD Billion in 2032, driven by advanced technological adoption and significant investments in data analytics. Europe follows closely, valued at 1.32 USD Billion in 2023 and expected to reach 5.9 USD Billion by 2032, as organizations prioritize data intelligence.

    The APAC region, valued at 1.2 USD Billion in 2023 and projected to climb to 5.4 USD Billion, indicates increasing digital transformation efforts among businesses, while South America, with a 2023 valuation of 0.5 USD Billion, is set to grow to 2.2 USD Billion, reflecting emerging market trends.Meanwhile, the MEA region begins at 0.46 USD Billion and is anticipated to reach 1.9 USD Billion, emphasizing the gradual adoption of augmentation strategies in a traditionally slower market.

    Overall, the regional distribution showcases the varying dynamics and strategic importance of each area, catering to different aspects of the Global Augmented Analytics Market revenue landscape.

    Fig 3: Augmented Analytics Market Regional Insights

    Augmented Analytics Market Regional Insights

    Source: Primary Research, Secondary Research, Market Research Future Database and Analyst Review

    Key Players and Competitive Insights

    The Global Augmented Analytics Market has become increasingly competitive as businesses strive to leverage advanced analytics and artificial intelligence to extract valuable insights from data. This market is characterized by rapid innovation and the introduction of platforms that enhance data preparation, data visualization, and predictive analytics capabilities. The integration of machine learning and natural language processing in analytics tools has created an environment where organizations can automate data discovery, empowering users with self-service capabilities.

    The competitive landscape is defined by key players that encompass a mix of established firms and emergent startups, each vying for market share by offering unique solutions tailored to meet the diverse needs of various industries. Understanding the strengths and strategies of these players is crucial to navigating this dynamic landscape.Domo has established itself as a strong contender in the Global Augmented Analytics Market through its innovative approach to business intelligence and data visualization. The platform is known for its ability to connect a wide array of data sources, enabling users to visualize and interpret complex datasets effortlessly.

    By providing real-time insights and customizable dashboards, Domo allows organizations to make data-driven decisions quickly and efficiently. The company's strength lies in its user-friendly interface and robust features that cater to both technical and business users. Additionally, Domo's focus on collaboration tools further enhances its appeal, enabling teams to work together in analyzing data and sharing insights seamlessly.

    As organizations increasingly prioritize data accessibility and collaborative analytics, Domo's offerings position it favorably within the competitive landscape.Salesforce is another significant player within the Global Augmented Analytics Market, offering a suite of analytics solutions that integrate seamlessly with its customer relationship management platform. Known for its cloud-based approach, Salesforce provides organizations with powerful tools to analyze customer data, identify trends, and predict future behaviors. The company’s strengths lie in its comprehensive data analytics capabilities, which include AI-driven insights and advanced reporting features that simplify data analysis for users.

    Salesforce's emphasis on creating a holistic view of customer interactions allows businesses to gain actionable insights that improve customer relationships and drive revenue growth. Furthermore, Salesforce's continual investment in innovation ensures its analytics solutions remain at the forefront of technological advancements, solidifying its competitive standing in the market.

    Key Companies in the Augmented Analytics Market market include

    Industry Developments

    Recent developments in the Global Augmented Analytics Market indicate a growing trend toward AI-driven data analytics solutions, with companies such as Microsoft, IBM, and Tableau Software enhancing their offerings through innovative technologies that streamline data processing and visualization. Salesforce has also made strides by integrating AI capabilities into its analytics tools to enable better business decision-making processes. Current affairs point towards heightened competition among major players like Qlik, TIBCO Software, and Oracle, which are continuously evolving their platforms to incorporate machine learning for predictive insights.

    Additionally, Sisense has gained attention with its strong performance in cloud analytics, while Alteryx is focused on simplifying complex data preparation tasks. Noteworthy is the acquisition of Looker by Google, which has significantly enhanced Google Cloud's analytics capabilities, further impacting overall market dynamics. Domo and Zoho continue to expand their market presence by innovating and adapting to customer needs. Overall, these developments highlight a rapidly evolving landscape with substantial investments aimed at improving analytics capabilities across industries, which is anticipated to drive significant market growth in the coming years.

    Future Outlook

    Augmented Analytics Market Future Outlook

    The Augmented Analytics Market is projected to grow at a 17.54% CAGR from 2024 to 2035, driven by advancements in AI, increased data volume, and demand for real-time insights.

    New opportunities lie in:

    • Develop AI-driven tools for automated data preparation and visualization.
    • Create industry-specific analytics solutions to enhance decision-making processes.
    • Leverage cloud technologies to offer scalable analytics platforms for SMEs.

    By 2035, the Augmented Analytics Market is expected to be a pivotal force in data-driven decision-making globally.

    Market Segmentation

    Augmented Analytics Market End User Outlook

    • BFSI
    • Healthcare
    • Retail
    • Manufacturing
    • IT and Telecommunications

    Augmented Analytics Market Function Outlook

    • Data Discovery
    • Data Preparation
    • Data Visualization
    • Data Integration

    Augmented Analytics Market Regional Outlook

    • North America
    • Europe
    • South America
    • Asia Pacific
    • Middle East and Africa

    Augmented Analytics Market Component Outlook

    • Software
    • Services
    • Platforms

    Augmented Analytics Market Deployment Mode Outlook

    • Cloud
    • On-Premises
    • Hybrid

    Report Scope

    Report Attribute/Metric Details
    Market Size 2022 5.04(USD Billion)
    Market Size 2023 5.92(USD Billion)
    Market Size 2032 25.4(USD Billion)
    Compound Annual Growth Rate (CAGR) 17.56% (2024 - 2032)
    Report Coverage Revenue Forecast, Competitive Landscape, Growth Factors, and Trends
    Base Year 2023
    Market Forecast Period 2024 - 2032
    Historical Data 2019 - 2023
    Market Forecast Units USD Billion
    Key Companies Profiled Domo, Salesforce, Looker, Tableau Software, Sisense, Qlik, TIBCO Software, SAP, Oracle, Alteryx, Zoho, IBM, Microsoft, ThoughtSpot, MicroStrategy
    Segments Covered Deployment Mode, Component, End User, Function, Regional
    Key Market Opportunities Increased demand for data democratization, Adoption of AI-driven insights, Growth in cloud-based analytics, Rise of self-service BI tools, Enhanced customer experience analytics
    Key Market Dynamics Rapid data generation, Increasing demand for automation, Shift towards self-service analytics, Growing adoption of AI technologies, Rising importance of data-driven decision-making
    Countries Covered North America, Europe, APAC, South America, MEA

    Market Highlights

    Author
    Shubham Munde
    Research Analyst Level II

    With a technical background in information technology & semiconductors, Shubham has 4.5+ years of experience in market research and analytics with the tasks of data mining, analysis, and project execution. He is the POC for our clients, for their consulting projects running under the ICT/Semiconductor domain. Shubham holds a Bachelor’s in Information and Technology and a Master of Business Administration (MBA). Shubham has executed over 150 research projects for our clients under the brand name Market Research Future in the last 2 years. His core skill is building the research respondent relation for gathering the primary information from industry and market estimation for niche markets. He is having expertise in conducting secondary & primary research, market estimations, market projections, competitive analysis, analysing current market trends and market dynamics, deep-dive analysis on market scenarios, consumer behaviour, technological impact analysis, consulting, analytics, etc. He has worked on fortune 500 companies' syndicate and consulting projects along with several government projects. He has worked on the projects of top tech brands such as IBM, Google, Microsoft, AWS, Meta, Oracle, Cisco Systems, Samsung, Accenture, VMware, Schneider Electric, Dell, HP, Ericsson, and so many others. He has worked on Metaverse, Web 3.0, Zero-Trust security, cyber-security, blockchain, quantum computing, robotics, 5G technology, High-Performance computing, data centers, AI, automation, IT equipment, sensors, semiconductors, consumer electronics and so many tech domain projects.

    Leave a Comment

    FAQs

    What is the expected market size of the Global Augmented Analytics Market in 2032?

    The Global Augmented Analytics Market is expected to be valued at 25.4 USD Billion by the year 2032.

    What is the projected CAGR for the Global Augmented Analytics Market from 2024 to 2032?

    The projected CAGR for the Global Augmented Analytics Market from 2024 to 2032 is 17.56%.

    Which region is expected to dominate the Global Augmented Analytics Market by 2032?

    North America is expected to dominate the Global Augmented Analytics Market with a valuation of 10.7 USD Billion in 2032.

    What is the market size of the Global Augmented Analytics Market in the Cloud segment in 2032?

    The Cloud segment of the Global Augmented Analytics Market is projected to reach 10.0 USD Billion in the year 2032.

    Who are the major players in the Global Augmented Analytics Market?

    Major players in the Global Augmented Analytics Market include Domo, Salesforce, Looker, Tableau Software and IBM, among others.

    What is the anticipated market size for the On-Premises segment in 2032?

    The anticipated market size for the On-Premises segment in the Global Augmented Analytics Market is 8.5 USD Billion by 2032.

    How much is the Global Augmented Analytics Market in the APAC region expected to grow by 2032?

    The APAC region is expected to grow to 5.4 USD Billion in the Global Augmented Analytics Market by 2032.

    What challenges does the Global Augmented Analytics Market face in its growth?

    The Global Augmented Analytics Market faces challenges related to data privacy and integration with existing systems.

    What is the market size for the Hybrid segment in the Global Augmented Analytics Market by 2032?

    The Hybrid segment is expected to reach a market size of 6.9 USD Billion by 2032.

    What is the market size for South America in the Global Augmented Analytics Market by 2032?

    The market size for South America in the Global Augmented Analytics Market is projected to reach 2.2 USD Billion by 2032.

    1. 'Table
    2. of Contents
    3. EXECUTIVE SUMMARY
      1. Market
    4. Overview
      1. Key Findings
      2. Market Segmentation
      3. Competitive Landscape
    5. Challenges and Opportunities
      1. Future Outlook
    6. MARKET INTRODUCTION
      1. Definition
      2. Scope of the study
        1. Research
    7. Objective
      1. Assumption
        1. Limitations
    8. RESEARCH METHODOLOGY
    9. Overview
      1. Data Mining
      2. Secondary Research
      3. Primary Research
    10. Primary Interviews and Information Gathering Process
      1. Breakdown of Primary Respondents
      2. Forecasting Model
      3. Market Size Estimation
        1. Bottom-Up Approach
    11. Top-Down Approach
      1. Data Triangulation
      2. Validation
    12. MARKET DYNAMICS
      1. Overview
      2. Drivers
      3. Restraints
      4. Opportunities
    13. MARKET FACTOR ANALYSIS
      1. Value chain Analysis
    14. Porter''s Five Forces Analysis
      1. Bargaining Power of Suppliers
    15. Bargaining Power of Buyers
      1. Threat of New Entrants
        1. Threat
    16. of Substitutes
      1. Intensity of Rivalry
      2. COVID-19 Impact Analysis
        1. Market Impact Analysis
        2. Regional Impact
        3. Opportunity
    17. and Threat Analysis
    18. Augmented Analytics Market, BY Deployment
    19. Mode (USD Billion)
      1. Cloud
      2. On-Premises
      3. Hybrid
    20. Augmented
    21. Analytics Market, BY Component (USD Billion)
      1. Software
      2. Services
      3. Platforms
    22. Augmented Analytics Market, BY End User (USD
    23. Billion)
      1. BFSI
      2. Healthcare
      3. Retail
      4. Manufacturing
    24. IT and Telecommunications
    25. Augmented Analytics Market, BY Function (USD
    26. Billion)
      1. Data Discovery
      2. Data Preparation
      3. Data Visualization
    27. Data Integration
    28. Augmented Analytics Market, BY Regional (USD Billion)
    29. North America
      1. US
        1. Canada
      2. Europe
        1. Germany
        2. UK
        3. France
        4. Russia
        5. Italy
        6. Spain
        7. Rest of Europe
      3. APAC
        1. China
        2. India
        3. Japan
        4. South Korea
        5. Malaysia
        6. Thailand
        7. Indonesia
        8. Rest of APAC
      4. South America
    30. Brazil
      1. Mexico
        1. Argentina
        2. Rest of South America
      2. MEA
        1. GCC Countries
        2. South Africa
    31. Rest of MEA
    32. Competitive Landscape
      1. Overview
      2. Competitive
    33. Analysis
      1. Market share Analysis
      2. Major Growth Strategy in the Augmented
    34. Analytics Market
      1. Competitive Benchmarking
      2. Leading Players in Terms
    35. of Number of Developments in the Augmented Analytics Market
      1. Key developments and growth
    36. strategies
      1. New Product Launch/Service Deployment
        1. Merger
    37. & Acquisitions
      1. Joint Ventures
      2. Major Players Financial
    38. Matrix
      1. Sales and Operating Income
        1. Major Players R&D
    39. Expenditure. 2023
    40. Company Profiles
      1. Domo
        1. Financial
    41. Overview
      1. Products Offered
        1. Key Developments
        2. SWOT
    42. Analysis
      1. Key Strategies
      2. Salesforce
        1. Financial Overview
    43. Products Offered
      1. Key Developments
        1. SWOT Analysis
    44. Key Strategies
      1. Looker
        1. Financial Overview
        2. Products Offered
    45. Key Developments
      1. SWOT Analysis
        1. Key Strategies
        2. Financial Overview
        3. Products Offered
    46. Key Developments
      1. SWOT Analysis
        1. Key Strategies
    47. Sisense
      1. Financial Overview
        1. Products Offered
        2. Key
    48. Developments
      1. SWOT Analysis
        1. Key Strategies
    49. Qlik
      1. Financial Overview
        1. Products Offered
        2. Key
    50. Developments
      1. SWOT Analysis
        1. Key Strategies
    51. TIBCO Software
      1. Financial Overview
        1. Products Offered
    52. Key Developments
      1. SWOT Analysis
        1. Key Strategies
    53. SAP
      1. Financial Overview
        1. Products Offered
        2. Key
    54. Developments
      1. SWOT Analysis
        1. Key Strategies
    55. Oracle
      1. Financial Overview
        1. Products Offered
        2. Key
    56. Developments
      1. SWOT Analysis
        1. Key Strategies
    57. Alteryx
      1. Financial Overview
        1. Products Offered
    58. Key Developments
      1. SWOT Analysis
        1. Key Strategies
    59. Zoho
      1. Financial Overview
        1. Products Offered
    60. Key Developments
      1. SWOT Analysis
        1. Key Strategies
    61. IBM
      1. Financial Overview
        1. Products Offered
    62. Key Developments
      1. SWOT Analysis
        1. Key Strategies
    63. Microsoft
      1. Financial Overview
        1. Products Offered
    64. Key Developments
      1. SWOT Analysis
        1. Key Strategies
    65. ThoughtSpot
      1. Financial Overview
        1. Products Offered
    66. Key Developments
      1. SWOT Analysis
        1. Key Strategies
    67. MicroStrategy
      1. Financial Overview
        1. Products Offered
    68. Key Developments
      1. SWOT Analysis
        1. Key Strategies
      2. References
      3. Related Reports
    69. LIST OF ASSUMPTIONS
    70. SIZE ESTIMATES & FORECAST, BY DEPLOYMENT MODE, 2019-2032 (USD Billions)
    71. North America Augmented Analytics Market SIZE ESTIMATES & FORECAST, BY COMPONENT,
    72. 2032 (USD Billions)
    73. SIZE ESTIMATES & FORECAST, BY END USER, 2019-2032 (USD Billions)
    74. North America Augmented Analytics Market SIZE ESTIMATES & FORECAST, BY FUNCTION,
    75. 2032 (USD Billions)
    76. SIZE ESTIMATES & FORECAST, BY REGIONAL, 2019-2032 (USD Billions)
    77. US Augmented Analytics Market SIZE ESTIMATES & FORECAST, BY DEPLOYMENT MODE,
    78. 2032 (USD Billions)
    79. & FORECAST, BY COMPONENT, 2019-2032 (USD Billions)
    80. Market SIZE ESTIMATES & FORECAST, BY END USER, 2019-2032 (USD Billions)
    81. US Augmented Analytics Market SIZE ESTIMATES & FORECAST, BY FUNCTION, 2019-2032
    82. (USD Billions)
    83. FORECAST, BY REGIONAL, 2019-2032 (USD Billions)
    84. Market SIZE ESTIMATES & FORECAST, BY DEPLOYMENT MODE, 2019-2032 (USD Billions)
    85. BY COMPONENT, 2019-2032 (USD Billions)
    86. Market SIZE ESTIMATES & FORECAST, BY END USER, 2019-2032 (USD Billions)
    87. Canada Augmented Analytics Market SIZE ESTIMATES & FORECAST, BY FUNCTION,
    88. 2032 (USD Billions)
    89. ESTIMATES & FORECAST, BY REGIONAL, 2019-2032 (USD Billions)
    90. Europe Augmented Analytics Market SIZE ESTIMATES & FORECAST, BY DEPLOYMENT MODE,
    91. 2032 (USD Billions)
    92. ESTIMATES & FORECAST, BY COMPONENT, 2019-2032 (USD Billions)
    93. Europe Augmented Analytics Market SIZE ESTIMATES & FORECAST, BY END USER, 2019-2032
    94. (USD Billions)
    95. FORECAST, BY FUNCTION, 2019-2032 (USD Billions)
    96. Market SIZE ESTIMATES & FORECAST, BY REGIONAL, 2019-2032 (USD Billions)
    97. Germany Augmented Analytics Market SIZE ESTIMATES & FORECAST, BY DEPLOYMENT
    98. MODE, 2019-2032 (USD Billions)
    99. ESTIMATES & FORECAST, BY COMPONENT, 2019-2032 (USD Billions)
    100. Germany Augmented Analytics Market SIZE ESTIMATES & FORECAST, BY END USER, 2019-2032
    101. (USD Billions)
    102. & FORECAST, BY FUNCTION, 2019-2032 (USD Billions)
    103. Market SIZE ESTIMATES & FORECAST, BY REGIONAL, 2019-2032 (USD Billions)
    104. UK Augmented Analytics Market SIZE ESTIMATES & FORECAST, BY DEPLOYMENT MODE,
    105. 2032 (USD Billions)
    106. & FORECAST, BY COMPONENT, 2019-2032 (USD Billions)
    107. Market SIZE ESTIMATES & FORECAST, BY END USER, 2019-2032 (USD Billions)
    108. UK Augmented Analytics Market SIZE ESTIMATES & FORECAST, BY FUNCTION, 2019-2032
    109. (USD Billions)
    110. FORECAST, BY REGIONAL, 2019-2032 (USD Billions)
    111. Market SIZE ESTIMATES & FORECAST, BY DEPLOYMENT MODE, 2019-2032 (USD Billions)
    112. BY COMPONENT, 2019-2032 (USD Billions)
    113. Market SIZE ESTIMATES & FORECAST, BY END USER, 2019-2032 (USD Billions)
    114. France Augmented Analytics Market SIZE ESTIMATES & FORECAST, BY FUNCTION,
    115. 2032 (USD Billions)
    116. ESTIMATES & FORECAST, BY REGIONAL, 2019-2032 (USD Billions)
    117. Russia Augmented Analytics Market SIZE ESTIMATES & FORECAST, BY DEPLOYMENT MODE,
    118. 2032 (USD Billions)
    119. ESTIMATES & FORECAST, BY COMPONENT, 2019-2032 (USD Billions)
    120. Russia Augmented Analytics Market SIZE ESTIMATES & FORECAST, BY END USER, 2019-2032
    121. (USD Billions)
    122. FORECAST, BY FUNCTION, 2019-2032 (USD Billions)
    123. Market SIZE ESTIMATES & FORECAST, BY REGIONAL, 2019-2032 (USD Billions)
    124. Italy Augmented Analytics Market SIZE ESTIMATES & FORECAST, BY DEPLOYMENT
    125. MODE, 2019-2032 (USD Billions)
    126. ESTIMATES & FORECAST, BY COMPONENT, 2019-2032 (USD Billions)
    127. Italy Augmented Analytics Market SIZE ESTIMATES & FORECAST, BY END USER, 2019-2032
    128. (USD Billions)
    129. FORECAST, BY FUNCTION, 2019-2032 (USD Billions)
    130. Market SIZE ESTIMATES & FORECAST, BY REGIONAL, 2019-2032 (USD Billions)
    131. Spain Augmented Analytics Market SIZE ESTIMATES & FORECAST, BY DEPLOYMENT
    132. MODE, 2019-2032 (USD Billions)
    133. ESTIMATES & FORECAST, BY COMPONENT, 2019-2032 (USD Billions)
    134. Spain Augmented Analytics Market SIZE ESTIMATES & FORECAST, BY END USER, 2019-2032
    135. (USD Billions)
    136. FORECAST, BY FUNCTION, 2019-2032 (USD Billions)
    137. Market SIZE ESTIMATES & FORECAST, BY REGIONAL, 2019-2032 (USD Billions)
    138. Rest of Europe Augmented Analytics Market SIZE ESTIMATES & FORECAST, BY
    139. DEPLOYMENT MODE, 2019-2032 (USD Billions)
    140. Analytics Market SIZE ESTIMATES & FORECAST, BY COMPONENT, 2019-2032 (USD Billions)
    141. FORECAST, BY END USER, 2019-2032 (USD Billions)
    142. Analytics Market SIZE ESTIMATES & FORECAST, BY FUNCTION, 2019-2032 (USD Billions)
    143. FORECAST, BY REGIONAL, 2019-2032 (USD Billions)
    144. Market SIZE ESTIMATES & FORECAST, BY DEPLOYMENT MODE, 2019-2032 (USD Billions)
    145. BY COMPONENT, 2019-2032 (USD Billions)
    146. SIZE ESTIMATES & FORECAST, BY END USER, 2019-2032 (USD Billions)
    147. APAC Augmented Analytics Market SIZE ESTIMATES & FORECAST, BY FUNCTION,
    148. 2032 (USD Billions)
    149. & FORECAST, BY REGIONAL, 2019-2032 (USD Billions)
    150. Market SIZE ESTIMATES & FORECAST, BY DEPLOYMENT MODE, 2019-2032 (USD Billions)
    151. BY COMPONENT, 2019-2032 (USD Billions)
    152. SIZE ESTIMATES & FORECAST, BY END USER, 2019-2032 (USD Billions)
    153. China Augmented Analytics Market SIZE ESTIMATES & FORECAST, BY FUNCTION,
    154. 2032 (USD Billions)
    155. ESTIMATES & FORECAST, BY REGIONAL, 2019-2032 (USD Billions)
    156. India Augmented Analytics Market SIZE ESTIMATES & FORECAST, BY DEPLOYMENT MODE,
    157. 2032 (USD Billions)
    158. ESTIMATES & FORECAST, BY COMPONENT, 2019-2032 (USD Billions)
    159. India Augmented Analytics Market SIZE ESTIMATES & FORECAST, BY END USER, 2019-2032
    160. (USD Billions)
    161. FORECAST, BY FUNCTION, 2019-2032 (USD Billions)
    162. Market SIZE ESTIMATES & FORECAST, BY REGIONAL, 2019-2032 (USD Billions)
    163. Japan Augmented Analytics Market SIZE ESTIMATES & FORECAST, BY DEPLOYMENT
    164. MODE, 2019-2032 (USD Billions)
    165. ESTIMATES & FORECAST, BY COMPONENT, 2019-2032 (USD Billions)
    166. Japan Augmented Analytics Market SIZE ESTIMATES & FORECAST, BY END USER, 2019-2032
    167. (USD Billions)
    168. FORECAST, BY FUNCTION, 2019-2032 (USD Billions)
    169. Market SIZE ESTIMATES & FORECAST, BY REGIONAL, 2019-2032 (USD Billions)
    170. South Korea Augmented Analytics Market SIZE ESTIMATES & FORECAST, BY DEPLOYMENT
    171. MODE, 2019-2032 (USD Billions)
    172. SIZE ESTIMATES & FORECAST, BY COMPONENT, 2019-2032 (USD Billions)
    173. South Korea Augmented Analytics Market SIZE ESTIMATES & FORECAST, BY END
    174. USER, 2019-2032 (USD Billions)
    175. SIZE ESTIMATES & FORECAST, BY FUNCTION, 2019-2032 (USD Billions)
    176. South Korea Augmented Analytics Market SIZE ESTIMATES & FORECAST, BY REGIONAL,
    177. 2032 (USD Billions)
    178. ESTIMATES & FORECAST, BY DEPLOYMENT MODE, 2019-2032 (USD Billions)
    179. Malaysia Augmented Analytics Market SIZE ESTIMATES & FORECAST, BY COMPONENT,
    180. 2032 (USD Billions)
    181. ESTIMATES & FORECAST, BY END USER, 2019-2032 (USD Billions)
    182. Malaysia Augmented Analytics Market SIZE ESTIMATES & FORECAST, BY FUNCTION,
    183. 2032 (USD Billions)
    184. ESTIMATES & FORECAST, BY REGIONAL, 2019-2032 (USD Billions)
    185. Thailand Augmented Analytics Market SIZE ESTIMATES & FORECAST, BY DEPLOYMENT
    186. MODE, 2019-2032 (USD Billions)
    187. ESTIMATES & FORECAST, BY COMPONENT, 2019-2032 (USD Billions)
    188. Thailand Augmented Analytics Market SIZE ESTIMATES & FORECAST, BY END USER,
    189. 2032 (USD Billions)
    190. ESTIMATES & FORECAST, BY FUNCTION, 2019-2032 (USD Billions)
    191. Thailand Augmented Analytics Market SIZE ESTIMATES & FORECAST, BY REGIONAL,
    192. 2032 (USD Billions)
    193. ESTIMATES & FORECAST, BY DEPLOYMENT MODE, 2019-2032 (USD Billions)
    194. Indonesia Augmented Analytics Market SIZE ESTIMATES & FORECAST, BY COMPONENT,
    195. 2032 (USD Billions)
    196. ESTIMATES & FORECAST, BY END USER, 2019-2032 (USD Billions)
    197. Indonesia Augmented Analytics Market SIZE ESTIMATES & FORECAST, BY FUNCTION,
    198. 2032 (USD Billions)
    199. ESTIMATES & FORECAST, BY REGIONAL, 2019-2032 (USD Billions)
    200. Rest of APAC Augmented Analytics Market SIZE ESTIMATES & FORECAST, BY DEPLOYMENT
    201. MODE, 2019-2032 (USD Billions)
    202. SIZE ESTIMATES & FORECAST, BY COMPONENT, 2019-2032 (USD Billions)
    203. Rest of APAC Augmented Analytics Market SIZE ESTIMATES & FORECAST, BY END
    204. USER, 2019-2032 (USD Billions)
    205. SIZE ESTIMATES & FORECAST, BY FUNCTION, 2019-2032 (USD Billions)
    206. Rest of APAC Augmented Analytics Market SIZE ESTIMATES & FORECAST, BY REGIONAL,
    207. 2032 (USD Billions)
    208. SIZE ESTIMATES & FORECAST, BY DEPLOYMENT MODE, 2019-2032 (USD Billions)
    209. South America Augmented Analytics Market SIZE ESTIMATES & FORECAST, BY
    210. COMPONENT, 2019-2032 (USD Billions)
    211. Market SIZE ESTIMATES & FORECAST, BY END USER, 2019-2032 (USD Billions)
    212. South America Augmented Analytics Market SIZE ESTIMATES & FORECAST, BY
    213. FUNCTION, 2019-2032 (USD Billions)
    214. Market SIZE ESTIMATES & FORECAST, BY REGIONAL, 2019-2032 (USD Billions)
    215. Brazil Augmented Analytics Market SIZE ESTIMATES & FORECAST, BY DEPLOYMENT
    216. MODE, 2019-2032 (USD Billions)
    217. ESTIMATES & FORECAST, BY COMPONENT, 2019-2032 (USD Billions)
    218. Brazil Augmented Analytics Market SIZE ESTIMATES & FORECAST, BY END USER, 2019-2032
    219. (USD Billions)
    220. & FORECAST, BY FUNCTION, 2019-2032 (USD Billions)
    221. Market SIZE ESTIMATES & FORECAST, BY REGIONAL, 2019-2032 (USD Billions)
    222. Mexico Augmented Analytics Market SIZE ESTIMATES & FORECAST, BY DEPLOYMENT
    223. MODE, 2019-2032 (USD Billions)
    224. ESTIMATES & FORECAST, BY COMPONENT, 2019-2032 (USD Billions)
    225. Mexico Augmented Analytics Market SIZE ESTIMATES & FORECAST, BY END USER, 2019-2032
    226. (USD Billions)
    227. & FORECAST, BY FUNCTION, 2019-2032 (USD Billions)
    228. Market SIZE ESTIMATES & FORECAST, BY REGIONAL, 2019-2032 (USD Billions)
    229. Argentina Augmented Analytics Market SIZE ESTIMATES & FORECAST, BY DEPLOYMENT
    230. MODE, 2019-2032 (USD Billions)
    231. SIZE ESTIMATES & FORECAST, BY COMPONENT, 2019-2032 (USD Billions)
    232. Argentina Augmented Analytics Market SIZE ESTIMATES & FORECAST, BY END
    233. USER, 2019-2032 (USD Billions)
    234. SIZE ESTIMATES & FORECAST, BY FUNCTION, 2019-2032 (USD Billions)
    235. Argentina Augmented Analytics Market SIZE ESTIMATES & FORECAST, BY REGIONAL,
    236. 2032 (USD Billions)
    237. Market SIZE ESTIMATES & FORECAST, BY DEPLOYMENT MODE, 2019-2032 (USD Billions)
    238. & FORECAST, BY COMPONENT, 2019-2032 (USD Billions)
    239. Augmented Analytics Market SIZE ESTIMATES & FORECAST, BY END USER, 2019-2032
    240. (USD Billions)
    241. SIZE ESTIMATES & FORECAST, BY FUNCTION, 2019-2032 (USD Billions)
    242. Rest of South America Augmented Analytics Market SIZE ESTIMATES & FORECAST,
    243. BY REGIONAL, 2019-2032 (USD Billions)
    244. SIZE ESTIMATES & FORECAST, BY DEPLOYMENT MODE, 2019-2032 (USD Billions)
    245. MEA Augmented Analytics Market SIZE ESTIMATES & FORECAST, BY COMPONENT,
    246. 2032 (USD Billions)
    247. & FORECAST, BY END USER, 2019-2032 (USD Billions)
    248. Market SIZE ESTIMATES & FORECAST, BY FUNCTION, 2019-2032 (USD Billions)
    249. MEA Augmented Analytics Market SIZE ESTIMATES & FORECAST, BY REGIONAL,
    250. 2032 (USD Billions)
    251. SIZE ESTIMATES & FORECAST, BY DEPLOYMENT MODE, 2019-2032 (USD Billions)
    252. GCC Countries Augmented Analytics Market SIZE ESTIMATES & FORECAST, BY
    253. COMPONENT, 2019-2032 (USD Billions)
    254. Market SIZE ESTIMATES & FORECAST, BY END USER, 2019-2032 (USD Billions)
    255. GCC Countries Augmented Analytics Market SIZE ESTIMATES & FORECAST, BY
    256. FUNCTION, 2019-2032 (USD Billions)
    257. Market SIZE ESTIMATES & FORECAST, BY REGIONAL, 2019-2032 (USD Billions)
    258. South Africa Augmented Analytics Market SIZE ESTIMATES & FORECAST, BY DEPLOYMENT
    259. MODE, 2019-2032 (USD Billions)
    260. SIZE ESTIMATES & FORECAST, BY COMPONENT, 2019-2032 (USD Billions)
    261. South Africa Augmented Analytics Market SIZE ESTIMATES & FORECAST, BY END
    262. USER, 2019-2032 (USD Billions)
    263. SIZE ESTIMATES & FORECAST, BY FUNCTION, 2019-2032 (USD Billions)
    264. South Africa Augmented Analytics Market SIZE ESTIMATES & FORECAST, BY REGIONAL,
    265. 2032 (USD Billions)
    266. SIZE ESTIMATES & FORECAST, BY DEPLOYMENT MODE, 2019-2032 (USD Billions)
    267. Rest of MEA Augmented Analytics Market SIZE ESTIMATES & FORECAST, BY COMPONENT,
    268. 2032 (USD Billions)
    269. SIZE ESTIMATES & FORECAST, BY END USER, 2019-2032 (USD Billions)
    270. Rest of MEA Augmented Analytics Market SIZE ESTIMATES & FORECAST, BY FUNCTION,
    271. 2032 (USD Billions)
    272. SIZE ESTIMATES & FORECAST, BY REGIONAL, 2019-2032 (USD Billions)
    273. PRODUCT LAUNCH/PRODUCT DEVELOPMENT/APPROVAL
    274. ANALYTICS MARKET ANALYSIS
    275. BY DEPLOYMENT MODE
    276. US AUGMENTED ANALYTICS MARKET ANALYSIS BY FUNCTION
    277. MARKET ANALYSIS BY REGIONAL
    278. BY DEPLOYMENT MODE
    279. CANADA AUGMENTED ANALYTICS MARKET ANALYSIS BY FUNCTION
    280. MARKET ANALYSIS BY REGIONAL
    281. GERMANY AUGMENTED ANALYTICS MARKET ANALYSIS BY END USER
    282. MARKET ANALYSIS BY FUNCTION
    283. BY REGIONAL
    284. MODE
    285. UK AUGMENTED ANALYTICS MARKET ANALYSIS BY END USER
    286. MARKET ANALYSIS BY FUNCTION
    287. BY REGIONAL
    288. MODE
    289. FRANCE AUGMENTED ANALYTICS MARKET ANALYSIS BY END USER
    290. MARKET ANALYSIS BY FUNCTION
    291. BY REGIONAL
    292. MODE
    293. RUSSIA AUGMENTED ANALYTICS MARKET ANALYSIS BY END USER
    294. MARKET ANALYSIS BY FUNCTION
    295. BY REGIONAL
    296. MODE
    297. ITALY AUGMENTED ANALYTICS MARKET ANALYSIS BY END USER
    298. MARKET ANALYSIS BY FUNCTION
    299. BY REGIONAL
    300. MODE
    301. SPAIN AUGMENTED ANALYTICS MARKET ANALYSIS BY END USER
    302. MARKET ANALYSIS BY FUNCTION
    303. BY REGIONAL
    304. BY DEPLOYMENT MODE
    305. BY COMPONENT
    306. BY END USER
    307. BY FUNCTION
    308. BY REGIONAL
    309. CHINA AUGMENTED ANALYTICS MARKET ANALYSIS BY DEPLOYMENT MODE
    310. CHINA AUGMENTED ANALYTICS MARKET ANALYSIS BY COMPONENT
    311. MARKET ANALYSIS BY END USER
    312. BY FUNCTION
    313. INDIA AUGMENTED ANALYTICS MARKET ANALYSIS BY END USER
    314. MARKET ANALYSIS BY FUNCTION
    315. BY REGIONAL
    316. MODE
    317. JAPAN AUGMENTED ANALYTICS MARKET ANALYSIS BY END USER
    318. MARKET ANALYSIS BY FUNCTION
    319. BY REGIONAL
    320. DEPLOYMENT MODE
    321. COMPONENT
    322. MALAYSIA AUGMENTED ANALYTICS MARKET ANALYSIS BY END USER
    323. MALAYSIA AUGMENTED ANALYTICS MARKET ANALYSIS BY FUNCTION
    324. ANALYTICS MARKET ANALYSIS BY REGIONAL
    325. MARKET ANALYSIS BY DEPLOYMENT MODE
    326. MARKET ANALYSIS BY COMPONENT
    327. BY END USER
    328. INDONESIA AUGMENTED ANALYTICS MARKET ANALYSIS BY DEPLOYMENT MODE
    329. INDONESIA AUGMENTED ANALYTICS MARKET ANALYSIS BY COMPONENT
    330. INDONESIA AUGMENTED ANALYTICS MARKET ANALYSIS BY END USER
    331. ANALYTICS MARKET ANALYSIS BY FUNCTION
    332. MARKET ANALYSIS BY REGIONAL
    333. ANALYSIS BY DEPLOYMENT MODE
    334. ANALYSIS BY COMPONENT
    335. BY END USER
    336. BY FUNCTION
    337. BY REGIONAL
    338. BRAZIL AUGMENTED ANALYTICS MARKET ANALYSIS BY END USER
    339. MARKET ANALYSIS BY FUNCTION
    340. BY REGIONAL
    341. MODE
    342. MEXICO AUGMENTED ANALYTICS MARKET ANALYSIS BY END USER
    343. MARKET ANALYSIS BY FUNCTION
    344. BY REGIONAL
    345. DEPLOYMENT MODE
    346. COMPONENT
    347. ARGENTINA AUGMENTED ANALYTICS MARKET ANALYSIS BY FUNCTION
    348. ARGENTINA AUGMENTED ANALYTICS MARKET ANALYSIS BY REGIONAL
    349. AUGMENTED ANALYTICS MARKET ANALYSIS BY DEPLOYMENT MODE
    350. AUGMENTED ANALYTICS MARKET ANALYSIS BY COMPONENT
    351. AUGMENTED ANALYTICS MARKET ANALYSIS BY END USER
    352. AUGMENTED ANALYTICS MARKET ANALYSIS BY FUNCTION
    353. AUGMENTED ANALYTICS MARKET ANALYSIS BY REGIONAL
    354. MARKET ANALYSIS
    355. BY DEPLOYMENT MODE
    356. BY COMPONENT
    357. BY END USER
    358. BY FUNCTION
    359. BY REGIONAL
    360. BY DEPLOYMENT MODE
    361. BY COMPONENT
    362. BY END USER
    363. BY FUNCTION
    364. BY REGIONAL
    365. BY DEPLOYMENT MODE
    366. BY COMPONENT
    367. BY END USER
    368. BY FUNCTION
    369. BY REGIONAL
    370. ANALYTICS MARKET
    371. SUPPLY / VALUE CHAIN: AUGMENTED ANALYTICS MARKET
    372. MARKET, BY DEPLOYMENT MODE, 2024 (% SHARE)
    373. MARKET, BY DEPLOYMENT MODE, 2019 TO 2032 (USD Billions)
    374. MARKET, BY COMPONENT, 2024 (% SHARE)
    375. BY COMPONENT, 2019 TO 2032 (USD Billions)
    376. MARKET, BY END USER, 2024 (% SHARE)
    377. BY END USER, 2019 TO 2032 (USD Billions)
    378. MARKET, BY FUNCTION, 2024 (% SHARE)
    379. BY FUNCTION, 2019 TO 2032 (USD Billions)
    380. MARKET, BY REGIONAL, 2024 (% SHARE)
    381. BY REGIONAL, 2019 TO 2032 (USD Billions)
    382. COMPETITORS '

    Augmented Analytics Market Segmentation


    • Augmented Analytics Market By Deployment Mode (USD Billion, 2019-2032)

      • Cloud

      • On-Premises

      • Hybrid

    • Augmented Analytics Market By Component (USD Billion, 2019-2032)

      • Software

      • Services

      • Platforms

    • Augmented Analytics Market By End User (USD Billion, 2019-2032)

      • BFSI

      • Healthcare

      • Retail

      • Manufacturing

      • IT and Telecommunications

    • Augmented Analytics Market By Function (USD Billion, 2019-2032)

      • Data Discovery

      • Data Preparation

      • Data Visualization

      • Data Integration

    • Augmented Analytics Market By Regional (USD Billion, 2019-2032)

      • North America

      • Europe

      • South America

      • Asia Pacific

      • Middle East and Africa

    Augmented Analytics Market Regional Outlook (USD Billion, 2019-2032)


    • North America Outlook (USD Billion, 2019-2032)

      • North America Augmented Analytics Market by Deployment Mode Type

        • Cloud

        • On-Premises

        • Hybrid

      • North America Augmented Analytics Market by Component Type

        • Software

        • Services

        • Platforms

      • North America Augmented Analytics Market by End User Type

        • BFSI

        • Healthcare

        • Retail

        • Manufacturing

        • IT and Telecommunications

      • North America Augmented Analytics Market by Function Type

        • Data Discovery

        • Data Preparation

        • Data Visualization

        • Data Integration

      • North America Augmented Analytics Market by Regional Type

        • US

        • Canada

      • US Outlook (USD Billion, 2019-2032)

      • US Augmented Analytics Market by Deployment Mode Type

        • Cloud

        • On-Premises

        • Hybrid

      • US Augmented Analytics Market by Component Type

        • Software

        • Services

        • Platforms

      • US Augmented Analytics Market by End User Type

        • BFSI

        • Healthcare

        • Retail

        • Manufacturing

        • IT and Telecommunications

      • US Augmented Analytics Market by Function Type

        • Data Discovery

        • Data Preparation

        • Data Visualization

        • Data Integration

      • CANADA Outlook (USD Billion, 2019-2032)

      • CANADA Augmented Analytics Market by Deployment Mode Type

        • Cloud

        • On-Premises

        • Hybrid

      • CANADA Augmented Analytics Market by Component Type

        • Software

        • Services

        • Platforms

      • CANADA Augmented Analytics Market by End User Type

        • BFSI

        • Healthcare

        • Retail

        • Manufacturing

        • IT and Telecommunications

      • CANADA Augmented Analytics Market by Function Type

        • Data Discovery

        • Data Preparation

        • Data Visualization

        • Data Integration

    • Europe Outlook (USD Billion, 2019-2032)

      • Europe Augmented Analytics Market by Deployment Mode Type

        • Cloud

        • On-Premises

        • Hybrid

      • Europe Augmented Analytics Market by Component Type

        • Software

        • Services

        • Platforms

      • Europe Augmented Analytics Market by End User Type

        • BFSI

        • Healthcare

        • Retail

        • Manufacturing

        • IT and Telecommunications

      • Europe Augmented Analytics Market by Function Type

        • Data Discovery

        • Data Preparation

        • Data Visualization

        • Data Integration

      • Europe Augmented Analytics Market by Regional Type

        • Germany

        • UK

        • France

        • Russia

        • Italy

        • Spain

        • Rest of Europe

      • GERMANY Outlook (USD Billion, 2019-2032)

      • GERMANY Augmented Analytics Market by Deployment Mode Type

        • Cloud

        • On-Premises

        • Hybrid

      • GERMANY Augmented Analytics Market by Component Type

        • Software

        • Services

        • Platforms

      • GERMANY Augmented Analytics Market by End User Type

        • BFSI

        • Healthcare

        • Retail

        • Manufacturing

        • IT and Telecommunications

      • GERMANY Augmented Analytics Market by Function Type

        • Data Discovery

        • Data Preparation

        • Data Visualization

        • Data Integration

      • UK Outlook (USD Billion, 2019-2032)

      • UK Augmented Analytics Market by Deployment Mode Type

        • Cloud

        • On-Premises

        • Hybrid

      • UK Augmented Analytics Market by Component Type

        • Software

        • Services

        • Platforms

      • UK Augmented Analytics Market by End User Type

        • BFSI

        • Healthcare

        • Retail

        • Manufacturing

        • IT and Telecommunications

      • UK Augmented Analytics Market by Function Type

        • Data Discovery

        • Data Preparation

        • Data Visualization

        • Data Integration

      • FRANCE Outlook (USD Billion, 2019-2032)

      • FRANCE Augmented Analytics Market by Deployment Mode Type

        • Cloud

        • On-Premises

        • Hybrid

      • FRANCE Augmented Analytics Market by Component Type

        • Software

        • Services

        • Platforms

      • FRANCE Augmented Analytics Market by End User Type

        • BFSI

        • Healthcare

        • Retail

        • Manufacturing

        • IT and Telecommunications

      • FRANCE Augmented Analytics Market by Function Type

        • Data Discovery

        • Data Preparation

        • Data Visualization

        • Data Integration

      • RUSSIA Outlook (USD Billion, 2019-2032)

      • RUSSIA Augmented Analytics Market by Deployment Mode Type

        • Cloud

        • On-Premises

        • Hybrid

      • RUSSIA Augmented Analytics Market by Component Type

        • Software

        • Services

        • Platforms

      • RUSSIA Augmented Analytics Market by End User Type

        • BFSI

        • Healthcare

        • Retail

        • Manufacturing

        • IT and Telecommunications

      • RUSSIA Augmented Analytics Market by Function Type

        • Data Discovery

        • Data Preparation

        • Data Visualization

        • Data Integration

      • ITALY Outlook (USD Billion, 2019-2032)

      • ITALY Augmented Analytics Market by Deployment Mode Type

        • Cloud

        • On-Premises

        • Hybrid

      • ITALY Augmented Analytics Market by Component Type

        • Software

        • Services

        • Platforms

      • ITALY Augmented Analytics Market by End User Type

        • BFSI

        • Healthcare

        • Retail

        • Manufacturing

        • IT and Telecommunications

      • ITALY Augmented Analytics Market by Function Type

        • Data Discovery

        • Data Preparation

        • Data Visualization

        • Data Integration

      • SPAIN Outlook (USD Billion, 2019-2032)

      • SPAIN Augmented Analytics Market by Deployment Mode Type

        • Cloud

        • On-Premises

        • Hybrid

      • SPAIN Augmented Analytics Market by Component Type

        • Software

        • Services

        • Platforms

      • SPAIN Augmented Analytics Market by End User Type

        • BFSI

        • Healthcare

        • Retail

        • Manufacturing

        • IT and Telecommunications

      • SPAIN Augmented Analytics Market by Function Type

        • Data Discovery

        • Data Preparation

        • Data Visualization

        • Data Integration

      • REST OF EUROPE Outlook (USD Billion, 2019-2032)

      • REST OF EUROPE Augmented Analytics Market by Deployment Mode Type

        • Cloud

        • On-Premises

        • Hybrid

      • REST OF EUROPE Augmented Analytics Market by Component Type

        • Software

        • Services

        • Platforms

      • REST OF EUROPE Augmented Analytics Market by End User Type

        • BFSI

        • Healthcare

        • Retail

        • Manufacturing

        • IT and Telecommunications

      • REST OF EUROPE Augmented Analytics Market by Function Type

        • Data Discovery

        • Data Preparation

        • Data Visualization

        • Data Integration

    • APAC Outlook (USD Billion, 2019-2032)

      • APAC Augmented Analytics Market by Deployment Mode Type

        • Cloud

        • On-Premises

        • Hybrid

      • APAC Augmented Analytics Market by Component Type

        • Software

        • Services

        • Platforms

      • APAC Augmented Analytics Market by End User Type

        • BFSI

        • Healthcare

        • Retail

        • Manufacturing

        • IT and Telecommunications

      • APAC Augmented Analytics Market by Function Type

        • Data Discovery

        • Data Preparation

        • Data Visualization

        • Data Integration

      • APAC Augmented Analytics Market by Regional Type

        • China

        • India

        • Japan

        • South Korea

        • Malaysia

        • Thailand

        • Indonesia

        • Rest of APAC

      • CHINA Outlook (USD Billion, 2019-2032)

      • CHINA Augmented Analytics Market by Deployment Mode Type

        • Cloud

        • On-Premises

        • Hybrid

      • CHINA Augmented Analytics Market by Component Type

        • Software

        • Services

        • Platforms

      • CHINA Augmented Analytics Market by End User Type

        • BFSI

        • Healthcare

        • Retail

        • Manufacturing

        • IT and Telecommunications

      • CHINA Augmented Analytics Market by Function Type

        • Data Discovery

        • Data Preparation

        • Data Visualization

        • Data Integration

      • INDIA Outlook (USD Billion, 2019-2032)

      • INDIA Augmented Analytics Market by Deployment Mode Type

        • Cloud

        • On-Premises

        • Hybrid

      • INDIA Augmented Analytics Market by Component Type

        • Software

        • Services

        • Platforms

      • INDIA Augmented Analytics Market by End User Type

        • BFSI

        • Healthcare

        • Retail

        • Manufacturing

        • IT and Telecommunications

      • INDIA Augmented Analytics Market by Function Type

        • Data Discovery

        • Data Preparation

        • Data Visualization

        • Data Integration

      • JAPAN Outlook (USD Billion, 2019-2032)

      • JAPAN Augmented Analytics Market by Deployment Mode Type

        • Cloud

        • On-Premises

        • Hybrid

      • JAPAN Augmented Analytics Market by Component Type

        • Software

        • Services

        • Platforms

      • JAPAN Augmented Analytics Market by End User Type

        • BFSI

        • Healthcare

        • Retail

        • Manufacturing

        • IT and Telecommunications

      • JAPAN Augmented Analytics Market by Function Type

        • Data Discovery

        • Data Preparation

        • Data Visualization

        • Data Integration

      • SOUTH KOREA Outlook (USD Billion, 2019-2032)

      • SOUTH KOREA Augmented Analytics Market by Deployment Mode Type

        • Cloud

        • On-Premises

        • Hybrid

      • SOUTH KOREA Augmented Analytics Market by Component Type

        • Software

        • Services

        • Platforms

      • SOUTH KOREA Augmented Analytics Market by End User Type

        • BFSI

        • Healthcare

        • Retail

        • Manufacturing

        • IT and Telecommunications

      • SOUTH KOREA Augmented Analytics Market by Function Type

        • Data Discovery

        • Data Preparation

        • Data Visualization

        • Data Integration

      • MALAYSIA Outlook (USD Billion, 2019-2032)

      • MALAYSIA Augmented Analytics Market by Deployment Mode Type

        • Cloud

        • On-Premises

        • Hybrid

      • MALAYSIA Augmented Analytics Market by Component Type

        • Software

        • Services

        • Platforms

      • MALAYSIA Augmented Analytics Market by End User Type

        • BFSI

        • Healthcare

        • Retail

        • Manufacturing

        • IT and Telecommunications

      • MALAYSIA Augmented Analytics Market by Function Type

        • Data Discovery

        • Data Preparation

        • Data Visualization

        • Data Integration

      • THAILAND Outlook (USD Billion, 2019-2032)

      • THAILAND Augmented Analytics Market by Deployment Mode Type

        • Cloud

        • On-Premises

        • Hybrid

      • THAILAND Augmented Analytics Market by Component Type

        • Software

        • Services

        • Platforms

      • THAILAND Augmented Analytics Market by End User Type

        • BFSI

        • Healthcare

        • Retail

        • Manufacturing

        • IT and Telecommunications

      • THAILAND Augmented Analytics Market by Function Type

        • Data Discovery

        • Data Preparation

        • Data Visualization

        • Data Integration

      • INDONESIA Outlook (USD Billion, 2019-2032)

      • INDONESIA Augmented Analytics Market by Deployment Mode Type

        • Cloud

        • On-Premises

        • Hybrid

      • INDONESIA Augmented Analytics Market by Component Type

        • Software

        • Services

        • Platforms

      • INDONESIA Augmented Analytics Market by End User Type

        • BFSI

        • Healthcare

        • Retail

        • Manufacturing

        • IT and Telecommunications

      • INDONESIA Augmented Analytics Market by Function Type

        • Data Discovery

        • Data Preparation

        • Data Visualization

        • Data Integration

      • REST OF APAC Outlook (USD Billion, 2019-2032)

      • REST OF APAC Augmented Analytics Market by Deployment Mode Type

        • Cloud

        • On-Premises

        • Hybrid

      • REST OF APAC Augmented Analytics Market by Component Type

        • Software

        • Services

        • Platforms

      • REST OF APAC Augmented Analytics Market by End User Type

        • BFSI

        • Healthcare

        • Retail

        • Manufacturing

        • IT and Telecommunications

      • REST OF APAC Augmented Analytics Market by Function Type

        • Data Discovery

        • Data Preparation

        • Data Visualization

        • Data Integration

    • South America Outlook (USD Billion, 2019-2032)

      • South America Augmented Analytics Market by Deployment Mode Type

        • Cloud

        • On-Premises

        • Hybrid

      • South America Augmented Analytics Market by Component Type

        • Software

        • Services

        • Platforms

      • South America Augmented Analytics Market by End User Type

        • BFSI

        • Healthcare

        • Retail

        • Manufacturing

        • IT and Telecommunications

      • South America Augmented Analytics Market by Function Type

        • Data Discovery

        • Data Preparation

        • Data Visualization

        • Data Integration

      • South America Augmented Analytics Market by Regional Type

        • Brazil

        • Mexico

        • Argentina

        • Rest of South America

      • BRAZIL Outlook (USD Billion, 2019-2032)

      • BRAZIL Augmented Analytics Market by Deployment Mode Type

        • Cloud

        • On-Premises

        • Hybrid

      • BRAZIL Augmented Analytics Market by Component Type

        • Software

        • Services

        • Platforms

      • BRAZIL Augmented Analytics Market by End User Type

        • BFSI

        • Healthcare

        • Retail

        • Manufacturing

        • IT and Telecommunications

      • BRAZIL Augmented Analytics Market by Function Type

        • Data Discovery

        • Data Preparation

        • Data Visualization

        • Data Integration

      • MEXICO Outlook (USD Billion, 2019-2032)

      • MEXICO Augmented Analytics Market by Deployment Mode Type

        • Cloud

        • On-Premises

        • Hybrid

      • MEXICO Augmented Analytics Market by Component Type

        • Software

        • Services

        • Platforms

      • MEXICO Augmented Analytics Market by End User Type

        • BFSI

        • Healthcare

        • Retail

        • Manufacturing

        • IT and Telecommunications

      • MEXICO Augmented Analytics Market by Function Type

        • Data Discovery

        • Data Preparation

        • Data Visualization

        • Data Integration

      • ARGENTINA Outlook (USD Billion, 2019-2032)

      • ARGENTINA Augmented Analytics Market by Deployment Mode Type

        • Cloud

        • On-Premises

        • Hybrid

      • ARGENTINA Augmented Analytics Market by Component Type

        • Software

        • Services

        • Platforms

      • ARGENTINA Augmented Analytics Market by End User Type

        • BFSI

        • Healthcare

        • Retail

        • Manufacturing

        • IT and Telecommunications

      • ARGENTINA Augmented Analytics Market by Function Type

        • Data Discovery

        • Data Preparation

        • Data Visualization

        • Data Integration

      • REST OF SOUTH AMERICA Outlook (USD Billion, 2019-2032)

      • REST OF SOUTH AMERICA Augmented Analytics Market by Deployment Mode Type

        • Cloud

        • On-Premises

        • Hybrid

      • REST OF SOUTH AMERICA Augmented Analytics Market by Component Type

        • Software

        • Services

        • Platforms

      • REST OF SOUTH AMERICA Augmented Analytics Market by End User Type

        • BFSI

        • Healthcare

        • Retail

        • Manufacturing

        • IT and Telecommunications

      • REST OF SOUTH AMERICA Augmented Analytics Market by Function Type

        • Data Discovery

        • Data Preparation

        • Data Visualization

        • Data Integration

    • MEA Outlook (USD Billion, 2019-2032)

      • MEA Augmented Analytics Market by Deployment Mode Type

        • Cloud

        • On-Premises

        • Hybrid

      • MEA Augmented Analytics Market by Component Type

        • Software

        • Services

        • Platforms

      • MEA Augmented Analytics Market by End User Type

        • BFSI

        • Healthcare

        • Retail

        • Manufacturing

        • IT and Telecommunications

      • MEA Augmented Analytics Market by Function Type

        • Data Discovery

        • Data Preparation

        • Data Visualization

        • Data Integration

      • MEA Augmented Analytics Market by Regional Type

        • GCC Countries

        • South Africa

        • Rest of MEA

      • GCC COUNTRIES Outlook (USD Billion, 2019-2032)

      • GCC COUNTRIES Augmented Analytics Market by Deployment Mode Type

        • Cloud

        • On-Premises

        • Hybrid

      • GCC COUNTRIES Augmented Analytics Market by Component Type

        • Software

        • Services

        • Platforms

      • GCC COUNTRIES Augmented Analytics Market by End User Type

        • BFSI

        • Healthcare

        • Retail

        • Manufacturing

        • IT and Telecommunications

      • GCC COUNTRIES Augmented Analytics Market by Function Type

        • Data Discovery

        • Data Preparation

        • Data Visualization

        • Data Integration

      • SOUTH AFRICA Outlook (USD Billion, 2019-2032)

      • SOUTH AFRICA Augmented Analytics Market by Deployment Mode Type

        • Cloud

        • On-Premises

        • Hybrid

      • SOUTH AFRICA Augmented Analytics Market by Component Type

        • Software

        • Services

        • Platforms

      • SOUTH AFRICA Augmented Analytics Market by End User Type

        • BFSI

        • Healthcare

        • Retail

        • Manufacturing

        • IT and Telecommunications

      • SOUTH AFRICA Augmented Analytics Market by Function Type

        • Data Discovery

        • Data Preparation

        • Data Visualization

        • Data Integration

      • REST OF MEA Outlook (USD Billion, 2019-2032)

      • REST OF MEA Augmented Analytics Market by Deployment Mode Type

        • Cloud

        • On-Premises

        • Hybrid

      • REST OF MEA Augmented Analytics Market by Component Type

        • Software

        • Services

        • Platforms

      • REST OF MEA Augmented Analytics Market by End User Type

        • BFSI

        • Healthcare

        • Retail

        • Manufacturing

        • IT and Telecommunications

      • REST OF MEA Augmented Analytics Market by Function Type

        • Data Discovery

        • Data Preparation

        • Data Visualization

        • Data Integration

    Augmented Analytics Market Research Report - Global Forecast till 2032 Infographic
    Free Sample Request

    Kindly complete the form below to receive a free sample of this Report

    Customer Strories

    “I am very pleased with how market segments have been defined in a relevant way for my purposes (such as "Portable Freezers & refrigerators" and "last-mile"). In general the report is well structured. Thanks very much for your efforts.”

    Victoria Milne Founder
    Case Study

    Chemicals and Materials