• Cat-intel
  • MedIntelliX
  • Resources
  • About Us
  • Request Free Sample ×

    Kindly complete the form below to receive a free sample of this Report

    Leading companies partner with us for data-driven Insights

    clients tt-cursor

    US Augmented Analytics Market

    ID: MRFR/ICT/13891-HCR
    100 Pages
    Garvit Vyas
    September 2025

    US Augmented Analytics Market Research Report: By Deployment Mode (Cloud, On-Premises, Hybrid), By Component (Software, Services, Platforms), By End User (BFSI, Healthcare, Retail, Manufacturing, IT, Telecommunications) and By Function (Data Discovery, Data Preparation, Data Visualization, Data Integration) - Forecast to 2035

    Share:
    Download PDF ×

    We do not share your information with anyone. However, we may send you emails based on your report interest from time to time. You may contact us at any time to opt-out.

    US Augmented Analytics Market Research Report - Forecast till 2035 Infographic
    Purchase Options
    $ 4,950.0
    $ 5,950.0
    $ 7,250.0
    Table of Contents

    US Augmented Analytics Market Summary

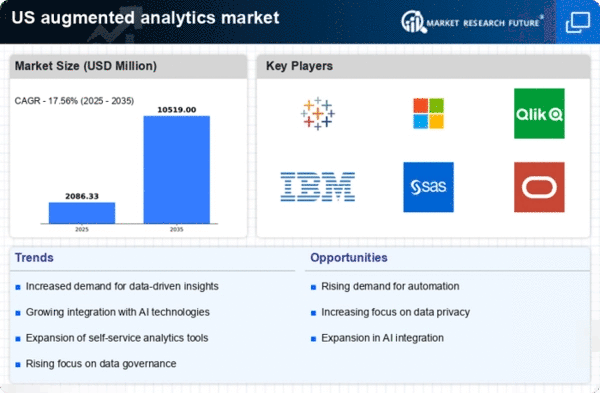
    The US Augmented Analytics market is poised for substantial growth, expanding from 1.85 USD Billion in 2024 to 12.7 USD Billion by 2035.

    Key Market Trends & Highlights

    US Augmented Analytics Key Trends and Highlights

    • The market is projected to grow at a compound annual growth rate (CAGR) of 19.12 percent from 2025 to 2035.
    • By 2035, the market value is expected to reach 12.7 USD Billion, indicating a robust upward trajectory.
    • In 2024, the market is valued at 1.85 USD Billion, reflecting the increasing demand for advanced analytics solutions.
    • Growing adoption of augmented analytics due to the need for data-driven decision making is a major market driver.

    Market Size & Forecast

    2024 Market Size 1.85 (USD Billion)
    2035 Market Size 12.7 (USD Billion)
    CAGR (2025-2035) 19.12%

    Major Players

    SAP, Palantir Technologies, Zoho, SAS, Oracle, MicroStrategy, Domo, Qlik, IBM, Tableau, Microsoft, ThoughtSpot, TIBCO Software, Sisense

    US Augmented Analytics Market Trends

    The US Augmented Analytics Market is witnessing significant growth driven by the increasing demand for data-driven insights across various sectors, including healthcare, finance, and retail. Companies are increasingly adopting advanced analytics tools to enhance decision-making and operational efficiency. The growing emphasis on data democratization is also a key market driver, as organizations strive to empower employees at all levels to access and analyze data without extensive technical training. Furthermore, the rise of artificial intelligence and machine learning technologies is transforming how organizations process and interpret large datasets, thereby improving predictive capabilities.

    Opportunities within the US market include the integration of augmented analytics with emerging technologies such as the Internet of Things (IoT) and cloud computing. These technologies provide a platform for enhanced data connectivity, enabling real-time analytics. Additionally, the focus on cybersecurity solutions is also a growing area, as organizations look to safeguard their data amid increasing threats. The trend of remote work has also catalyzed the need for robust analytics tools that can support decentralized teams in different geographic locations. Recently, there has been a trend toward creating more intuitive user interfaces and improving user experience in augmented analytics tools.

    This shift aims to cater to a broader audience by making analytics accessible not only to data scientists but also to business users. Organizations in the US are increasingly investing in self-service analytics, which allows users to generate insights on demand, reducing reliance on IT departments. As the analytics landscape continues to evolve, maintaining data governance and compliance with regulations, such as those set forth by the Federal Trade Commission, is becoming essential for leveraging augmented analytics effectively.

    US Augmented Analytics Market Drivers

    Market Segment Insights

    Growing Need for Real-Time Data Insights

    Rising Demand for Business Intelligence Tools

    The necessity for real-time data insights is a key driver for the growth of the US Augmented Analytics Market Industry. Businesses are increasingly realizing the importance of immediate access to data trends for enhanced operational efficiency and competitive advantage. A survey conducted by the Federal Reserve indicated that over 75% of US businesses that leverage analytics report improved performance. This growth in demand is prompting organizations to adopt advanced analytics tools that facilitate real-time data analysis, thus impacting their strategic business decisions positively.

    Leading firms, like Salesforce and Tableau, are adapting to this trend by offering solutions that integrate real-time analytics, driving further expansion within the market.

    The surge in demand for sophisticated Business Intelligence (BI) tools directly contributes to the growth of the US Augmented Analytics Market Industry. As organizations shift towards data-driven strategies, the need for comprehensive BI solutions has grown. According to the US Census Bureau, approximately 60% of enterprises in various sectors are actively investing in BI tools to enhance their data analytics capabilities. Notable companies such as Qlik and Sisense are innovating their BI offerings to provide users with augmented analytics features, promoting better data interpretation and visualization.

    As businesses in the US continue to prioritize data analytics for decision-making, the market for augmented analytics is anticipated to expand further.

    US Augmented Analytics Market Segment Insights:

    Augmented Analytics Market Deployment Mode Insights

    The US Augmented Analytics Market, focusing on the Deployment Mode segment, is experiencing rapid growth due to the increasing demand for data-driven decision-making in various industries. The market encompasses diverse deployment methods, primarily Cloud, On-Premises, and Hybrid configurations, each playing a significant role in shaping the landscape of analytics solutions within the region. The Cloud deployment mode is gaining significant traction owing to its flexibility, scalability, and cost-effectiveness, allowing organizations to integrate advanced analytics capabilities seamlessly into their operations.

    This method also facilitates easier access to real-time data analytics, thus enhancing the overall decision-making process. Conversely, On-Premises deployment offers organizations greater control over their data security and compliance, which is particularly essential for industries with stringent regulatory requirements. This deployment model allows companies to tailor their analytics solutions according to their specific operational needs, ensuring that sensitive data remains securely managed within their corporate infrastructure. The Hybrid model is also becoming increasingly popular, combining the benefits of both Cloud and On-Premises deployments.

    This approach provides organizations with the flexibility to manage varying workloads and data sensitivity levels effectively, allowing them to leverage the cloud for less sensitive data while maintaining more critical operations on-premises. The US Augmented Analytics Market segmentation by Deployment Mode showcases a dynamic shift in how organizations are leveraging analytics technologies to gain a competitive edge.

    Factors such as the widespread digital transformation, advancements in machine learning and artificial intelligence, and the growing need for faster and more accurate data insights are propelling the adoption of these diverse deployment models.However, organizations also face challenges such as data privacy concerns and the complexities associated with integrating new technologies into existing systems. The ongoing transformation of the analytics landscape highlights abundant opportunities for innovation, particularly in enhancing deployment models that cater to the diverse needs of US businesses.

    As organizations continue to prioritize data-driven strategies, the Deployment Mode segment will play a crucial role in shaping the future of the US Augmented Analytics Market, ensuring that firms can harness actionable insights to navigate their operational challenges effectively.

    Source: Primary Research, Secondary Research, Market Research Future Database and Analyst Review

    Augmented Analytics Market Component Insights

    The Component segment of the US Augmented Analytics Market encompasses critical elements such as Software, Services, and Platforms, each playing a pivotal role in advancing data-driven decision-making. The importance of Software in this segment is underscored by its capability to enhance data visualization and predictive analytics, thereby enabling organizations to derive actionable insights. Services, on the other hand, include consulting and implementation assistance, which are essential for organizations seeking to seamlessly integrate augmented analytics into their existing processes.

    Platforms serve as the backbone, providing users with access to a suite of tools that facilitate data integration, analysis, and collaboration among various stakeholders. With the growing emphasis on data democratization and self-service analytics, these components enable a more agile approach to data handling in businesses. Moreover, as organizations in the US continue to prioritize digital transformation, the demand for these components is expected to rise, fostering a robust environment for innovations in the augmented analytics space.

    The supportive regulatory climate and investment in technology infrastructure further bolster the significance of the Components in the market, positioning them as indispensable in driving overall market growth.

    Augmented Analytics Market End User Insights

    The US Augmented Analytics Market has diversified into various sectors, where the End User segment plays a crucial role in driving adoption and innovation. Key industries such as Banking, Financial Services, and Insurance (BFSI) utilize augmented analytics to streamline operations and enhance decision-making, predominantly responding to ever-evolving regulatory requirements and customer demands. In Healthcare, the technology aids in analyzing patient data to improve outcomes and operational efficiency, capitalizing on the industry's push towards data-driven solutions.

    Retail has seen heightened adoption to optimize supply chains and personalize customer experiences in an increasingly competitive landscape. The Manufacturing sector leverages augmented analytics for predictive maintenance and quality assurance, enhancing productivity through automation and data insights. Information Technology (IT) serves as the backbone of augmented analytics deployment, ensuring robust infrastructure and cybersecurity measures are in place.

    Telecommunications companies also use these tools to analyze network performance and customer usage patterns, thus enhancing service delivery and customer satisfaction.As firms across these sectors recognize the importance of data-driven decision-making, the US Augmented Analytics Market is expected to witness significant advancements and opportunities for growth.

    Augmented Analytics Market Function Insights

    The US Augmented Analytics Market, focusing on the Function segment, is characterized by a robust framework that includes key components like Data Discovery, Data Preparation, Data Visualization, and Data Integration. Data Discovery facilitates the identification of patterns and insights from complex datasets, which is vital for making informed decisions. Likewise, Data Preparation plays a critical role by enabling users to cleanse and organize data for accurate analysis, improving the overall quality of insights derived. Data Visualization enhances the communicative aspect of analytics by transforming data into visual formats, making it easier for stakeholders to grasp trends and anomalies quickly.

    Meanwhile, Data Integration is essential for combining data from various sources, ensuring a cohesive picture of the organization’s data landscape. Collectively, these functions contribute significantly to the US Augmented Analytics Market, leveraging advanced technologies to empower businesses in leveraging their data effectively. The growing demand for data-driven insights across industries highlights the importance of these functional areas to enhance operational efficiency and drive strategic decision-making. This trend is bolstered by an increasing emphasis on real-time analytics, which further elevates the significance of seamless data flow and comprehensive visualization in the market.

    Get more detailed insights about US Augmented Analytics Market Research Report - Forecast till 2035

    Regional Insights

    Key Players and Competitive Insights

    The US Augmented Analytics Market has become a dynamic and rapidly evolving sector characterized by fierce competition and a diverse array of offerings designed to enhance data analysis and visualization. Companies in this space are focusing on leveraging advanced technologies such as artificial intelligence, machine learning, and natural language processing to provide deeper insights, streamline decision-making, and empower non-technical users to interact with data more intuitively. As the demand for advanced data analytics increases across various industries, organizations are striving to differentiate their products by offering enhanced functionalities, user-friendly interfaces, and customizable solutions that cater to specific business needs.

    This competitive landscape is marked by continual innovation, strategic partnerships, and significant investments aimed at capturing market share and responding to evolving customer preferences.SAP holds a significant position within the US Augmented Analytics Market, showcasing its robust capabilities in delivering integrated analytics solutions that empower organizations to glean actionable insights from their data. The strength of SAP lies in its comprehensive suite of applications that seamlessly integrate with existing enterprise resource planning systems, enabling businesses to leverage their data assets effectively.

    SAP’s cloud-based offerings allow for greater scalability and flexibility, attracting a wide range of customers from small to large enterprises. Additionally, the company has invested heavily in improving user experience through intuitive design and interactive dashboards, making data analytics accessible to a broader audience. SAP’s long-standing reputation in the enterprise software sector further solidifies its market presence, as businesses trust its solutions to enhance reporting and analytics processes, thereby creating a strong competitive edge in the US augmented analytics landscape.

    Palantir Technologies is another key player making waves in the US Augmented Analytics Market, known for its strong focus on big data analytics and providing sophisticated data integration capabilities. The company’s flagship products, such as Palantir Foundry and Palantir Gotham, are designed to assist organizations in making sense of large and complex datasets. Palantir Technologies excels in offering tailored solutions for government and commercial sectors, and its analytics platforms are built to support advanced data modeling, visualization, and collaboration.

    The company has a strategic approach to partnerships and collaborations, which enhances its market presence and enables it to rapidly adapt to evolving customer needs. Palantir Technologies has also been involved in several key mergers and acquisitions, expanding its technological capabilities and strengthening its market position in the US. The ability to transform data into actionable intelligence through powerful analytics solutions establishes Palantir Technologies as a formidable competitor in the US augmented analytics space.

    Key Companies in the US Augmented Analytics Market market include

    Industry Developments

    The US Augmented Analytics Market has witnessed significant developments recently, with notable advancements from major companies like SAP, Oracle, and Microsoft. In September 2023, SAP announced enhancements to its Business Technology Platform, allowing businesses to leverage augmented analytics more effectively through integrated machine learning capabilities. Microsoft has also been actively expanding its Azure-based analytics solutions, supporting enterprises in automating data insights. In terms of mergers and acquisitions, in July 2023, Palantir Technologies completed a strategic acquisition of a data integration firm to enhance its data analytics offerings.

    Similarly, Qlik announced in June 2023 the acquisition of a business intelligence company to bolster its augmented analytics capabilities. The market's growth is also reflected in the increasing valuation of firms like IBM and Tableau, as demand for data-driven decision-making continues to surge across industries. The US government has recognized the importance of data analytics in improving public sector efficiencies, leading to increased investments in technology infrastructure. Over the last two years, companies have been rapidly adapting to the growing need for real-time analytics, which has been significantly amplified due to the shifting business landscape driven by the pandemic.

    Market Segmentation

    Outlook

    • Data Discovery
    • Data Preparation
    • Data Visualization
    • Data Integration

    Report Scope

    Report Scope:
    Report Attribute/Metric Source: Details
    MARKET SIZE 2018 1.51(USD Billion)
    MARKET SIZE 2024 1.85(USD Billion)
    MARKET SIZE 2035 12.68(USD Billion)
    COMPOUND ANNUAL GROWTH RATE (CAGR) 19.123% (2025 - 2035)
    REPORT COVERAGE Revenue Forecast, Competitive Landscape, Growth Factors, and Trends
    BASE YEAR 2024
    MARKET FORECAST PERIOD 2025 - 2035
    HISTORICAL DATA 2019 - 2024
    MARKET FORECAST UNITS USD Billion
    KEY COMPANIES PROFILED SAP, Palantir Technologies, Zoho, SAS, Oracle, MicroStrategy, Domo, Qlik, IBM, Tableau, Microsoft, ThoughtSpot, TIBCO Software, Sisense
    SEGMENTS COVERED Deployment Mode, Component, End User, Function
    KEY MARKET OPPORTUNITIES Increased demand for data-driven decisions, Integration with AI and machine learning, Rising importance of self-service analytics, Enhanced data visualization tools, Growth in cloud-based analytics solutions
    KEY MARKET DYNAMICS increasing data volume, rising AI adoption, growing demand for self-service analytics, enhanced data visualization tools, regulatory compliance pressures
    COUNTRIES COVERED US

    Market Highlights

    Author
    Garvit Vyas
    Analyst

    Explore the profile of Garvit Vyas, one of our esteemed authors at Market Research Future, and access their expert research contributions in the field of market research and industry analysis

    Leave a Comment

    FAQs

    What is the expected market size of the US Augmented Analytics Market in 2024?

    The US Augmented Analytics Market is expected to be valued at 1.85 USD Billion in 2024.

    What is the projected market value of the US Augmented Analytics Market by 2035?

    By 2035, the US Augmented Analytics Market is projected to reach a value of 12.68 USD Billion.

    What is the compound annual growth rate (CAGR) for the US Augmented Analytics Market from 2025 to 2035?

    The market is anticipated to grow at a CAGR of 19.123% from 2025 to 2035.

    Which deployment mode holds the largest market share in the US Augmented Analytics Market by 2024?

    The Cloud deployment mode is expected to hold the largest share, valued at 0.7 USD Billion in 2024.

    What is the expected value of the On-Premises deployment mode in the US Augmented Analytics Market by 2035?

    The On-Premises deployment mode is projected to reach a value of 2.8 USD Billion by 2035.

    What are the key players in the US Augmented Analytics Market?

    Major players include SAP, Palantir Technologies, Zoho, SAS, and Oracle among others.

    What is the expected market size for the Hybrid deployment mode by 2035?

    The Hybrid deployment mode is expected to be valued at 4.88 USD Billion by 2035.

    What is the anticipated growth rate for the Cloud deployment mode between 2025 and 2035?

    The Cloud deployment mode is expected to show significant growth, reaching 5.0 USD Billion by 2035.

    What are the key applications driving the US Augmented Analytics Market?

    Key applications include business intelligence, data visualization, and predictive analytics.

    What challenges are currently facing the US Augmented Analytics Market?

    Major challenges include data privacy concerns and the integration of disparate data sources.

    1. EXECUTIVE SUMMARY
    2. Market Overview
    3. Key Findings
    4. Market Segmentation
    5. Competitive Landscape
    6. Challenges and Opportunities
    7. Future Outlook
    8. MARKET INTRODUCTION
    9. Definition
    10. Scope of the study
    11. Research Objective
    12. Assumption
    13. Limitations
    14. RESEARCH METHODOLOGY
    15. Overview
    16. Data Mining
    17. Secondary Research
    18. Primary Research
    19. Primary Interviews and Information Gathering Process
    20. Breakdown of Primary Respondents
    21. Forecasting Model
    22. Market Size Estimation
    23. Bottom-Up Approach
    24. Top-Down Approach
    25. Data Triangulation
    26. Validation
    27. MARKET DYNAMICS
    28. Overview
    29. Drivers
    30. Restraints
    31. Opportunities
    32. MARKET FACTOR ANALYSIS
    33. Value chain Analysis
    34. Porter's Five Forces Analysis
    35. Bargaining Power of Suppliers
    36. Bargaining Power of Buyers
    37. Threat of New Entrants
    38. Threat of Substitutes
    39. Intensity of Rivalry
    40. COVID-19 Impact Analysis
    41. Market Impact Analysis
    42. Regional Impact
    43. Opportunity and Threat Analysis
    44. US Augmented Analytics Market, BY Deployment Mode (USD Billion)
    45. Cloud
    46. On-Premises
    47. Hybrid
    48. US Augmented Analytics Market, BY Component (USD Billion)
    49. Software
    50. Services
    51. Platforms
    52. US Augmented Analytics Market, BY End User (USD Billion)
    53. BFSI
    54. Healthcare
    55. Retail
    56. Manufacturing
    57. IT
    58. Telecommunications
    59. US Augmented Analytics Market, BY Function (USD Billion)
    60. Data Discovery
    61. Data Preparation
    62. Data Visualization
    63. Data Integration
    64. Competitive Landscape
    65. Overview
    66. Competitive Analysis
    67. Market share Analysis
    68. Major Growth Strategy in the Augmented Analytics Market
    69. Competitive Benchmarking
    70. Leading Players in Terms of Number of Developments in the Augmented Analytics Market
    71. Key developments and growth strategies
    72. New Product Launch/Service Deployment
    73. Merger & Acquisitions
    74. Joint Ventures
    75. Major Players Financial Matrix
    76. Sales and Operating Income
    77. Major Players R&D Expenditure. 2023
    78. Company Profiles
    79. SAP
    80. Financial Overview
    81. Products Offered
    82. Key Developments
    83. SWOT Analysis
    84. Key Strategies
    85. Palantir Technologies
    86. Financial Overview
    87. Products Offered
    88. Key Developments
    89. SWOT Analysis
    90. Key Strategies
    91. Zoho
    92. Financial Overview
    93. Products Offered
    94. Key Developments
    95. SWOT Analysis
    96. Key Strategies
    97. SAS
    98. Financial Overview
    99. Products Offered
    100. Key Developments
    101. SWOT Analysis
    102. Key Strategies
    103. Oracle
    104. Financial Overview
    105. Products Offered
    106. Key Developments
    107. SWOT Analysis
    108. Key Strategies
    109. MicroStrategy
    110. Financial Overview
    111. Products Offered
    112. Key Developments
    113. SWOT Analysis
    114. Key Strategies
    115. Domo
    116. Financial Overview
    117. Products Offered
    118. Key Developments
    119. SWOT Analysis
    120. Key Strategies
    121. Qlik
    122. Financial Overview
    123. Products Offered
    124. Key Developments
    125. SWOT Analysis
    126. Key Strategies
    127. IBM
    128. Financial Overview
    129. Products Offered
    130. Key Developments
    131. SWOT Analysis
    132. Key Strategies
    133. Financial Overview
    134. Products Offered
    135. Key Developments
    136. SWOT Analysis
    137. Key Strategies
    138. Microsoft
    139. Financial Overview
    140. Products Offered
    141. Key Developments
    142. SWOT Analysis
    143. Key Strategies
    144. ThoughtSpot
    145. Financial Overview
    146. Products Offered
    147. Key Developments
    148. SWOT Analysis
    149. Key Strategies
    150. TIBCO Software
    151. Financial Overview
    152. Products Offered
    153. Key Developments
    154. SWOT Analysis
    155. Key Strategies
    156. Sisense
    157. Financial Overview
    158. Products Offered
    159. Key Developments
    160. SWOT Analysis
    161. Key Strategies
    162. References
    163. Related Reports
    164. US Augmented Analytics Market SIZE ESTIMATES & FORECAST, BY DEPLOYMENT MODE, 2019-2035 (USD Billions)
    165. US Augmented Analytics Market SIZE ESTIMATES & FORECAST, BY COMPONENT, 2019-2035 (USD Billions)
    166. US Augmented Analytics Market SIZE ESTIMATES & FORECAST, BY END USER, 2019-2035 (USD Billions)
    167. US Augmented Analytics Market SIZE ESTIMATES & FORECAST, BY FUNCTION, 2019-2035 (USD Billions)
    168. PRODUCT LAUNCH/PRODUCT DEVELOPMENT/APPROVAL
    169. ACQUISITION/PARTNERSHIP
    170. MARKET SYNOPSIS
    171. US AUGMENTED ANALYTICS MARKET ANALYSIS BY DEPLOYMENT MODE
    172. US AUGMENTED ANALYTICS MARKET ANALYSIS BY COMPONENT
    173. US AUGMENTED ANALYTICS MARKET ANALYSIS BY END USER
    174. US AUGMENTED ANALYTICS MARKET ANALYSIS BY FUNCTION
    175. KEY BUYING CRITERIA OF AUGMENTED ANALYTICS MARKET
    176. RESEARCH PROCESS OF MRFR
    177. DRO ANALYSIS OF AUGMENTED ANALYTICS MARKET
    178. DRIVERS IMPACT ANALYSIS: AUGMENTED ANALYTICS MARKET
    179. RESTRAINTS IMPACT ANALYSIS: AUGMENTED ANALYTICS MARKET
    180. SUPPLY / VALUE CHAIN: AUGMENTED ANALYTICS MARKET
    181. AUGMENTED ANALYTICS MARKET, BY DEPLOYMENT MODE, 2025 (% SHARE)
    182. AUGMENTED ANALYTICS MARKET, BY DEPLOYMENT MODE, 2019 TO 2035 (USD Billions)
    183. AUGMENTED ANALYTICS MARKET, BY COMPONENT, 2025 (% SHARE)
    184. AUGMENTED ANALYTICS MARKET, BY COMPONENT, 2019 TO 2035 (USD Billions)
    185. AUGMENTED ANALYTICS MARKET, BY END USER, 2025 (% SHARE)
    186. AUGMENTED ANALYTICS MARKET, BY END USER, 2019 TO 2035 (USD Billions)
    187. AUGMENTED ANALYTICS MARKET, BY FUNCTION, 2025 (% SHARE)
    188. AUGMENTED ANALYTICS MARKET, BY FUNCTION, 2019 TO 2035 (USD Billions)
    189. BENCHMARKING OF MAJOR COMPETITORS

    US Augmented Analytics Market Segmentation


    • Augmented Analytics Market By Deployment Mode (USD Billion, 2019-2035)

      • Cloud
      • On-Premises
      • Hybrid


    • Augmented Analytics Market By Component (USD Billion, 2019-2035)

      • Software
      • Services
      • Platforms


    • Augmented Analytics Market By End User (USD Billion, 2019-2035)

      • BFSI
      • Healthcare
      • Retail
      • Manufacturing
      • IT
      • Telecommunications


    • Augmented Analytics Market By Function (USD Billion, 2019-2035)

      • Data Discovery
      • Data Preparation
      • Data Visualization
      • Data Integration


    Report Infographic
    Free Sample Request

    Kindly complete the form below to receive a free sample of this Report

    Customer Strories

    “I am very pleased with how market segments have been defined in a relevant way for my purposes (such as "Portable Freezers & refrigerators" and "last-mile"). In general the report is well structured. Thanks very much for your efforts.”

    Victoria Milne Founder
    Case Study

    Chemicals and Materials