• Cat-intel
  • MedIntelliX
  • Resources
  • About Us
  • Request Free Sample ×

    Kindly complete the form below to receive a free sample of this Report

    Leading companies partner with us for data-driven Insights

    clients tt-cursor

    Vitamins D Market

    ID: MRFR/F-B & N/10454-CR
    167 Pages
    Pradeep Nandi
    July 2023

    Vitamins D Market Research Report Information by Type (Vitamins D3, and Mineral D2), Application (Bakery & Confectionery, Dairy & Frozen Desserts, Meat Alternatives, Oils & Fats, Sports Nutrition, Dairy Alternatives, Dietary Supplements, Breakfast Cereals, and Others), And by Region (North America, Europe, Asia-Pacific, Latin America, Middle East, and Africa) - Forecast Till 2032

    Share:
    Download PDF ×

    We do not share your information with anyone. However, we may send you emails based on your report interest from time to time. You may contact us at any time to opt-out.

    Vitamins D Market Research Report—Global Forecast till 2032 Infographic
    Purchase Options
    $ 4,950.0
    $ 5,950.0
    $ 7,250.0
    Table of Contents

    Vitamins D Market Summary

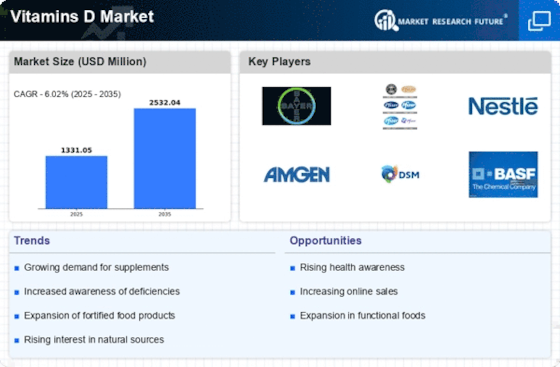
    The Global Vitamins D Market is projected to grow from 1.33 USD Billion in 2024 to 2.42 USD Billion by 2035, reflecting a robust growth trajectory.

    Key Market Trends & Highlights

    Vitamins D Key Trends and Highlights

    • The market is expected to experience a compound annual growth rate (CAGR) of 5.6 percent from 2025 to 2035.
    • By 2035, the market valuation is anticipated to reach 2.42 USD Billion, indicating substantial growth potential.
    • In 2024, the market is valued at 1.33 USD Billion, laying a strong foundation for future expansion.
    • Growing adoption of dietary supplements due to increasing awareness of health benefits is a major market driver.

    Market Size & Forecast

    2024 Market Size 1.33 (USD Million)
    2035 Market Size 2.42 (USD Million)
    CAGR (2025-2035) 5.6%

    Major Players

    DSM N.V. (Netherlands), BASF SE (Germany), Farbest Brands (US), Zhejiang Garden Biochemical High-tech Co., Ltd. (China), Pharmavit (Netherlands), Prinova Group LLC. (US), Piramal Pharma Solutions (India), SternVitamin GmbH & Co. KG (Germany), Fermenta Biotech Limited (India), Glanbia plc. (Ireland)

    Vitamins D Market Trends

      • Increasing Prevalence of Vitamin D deficiency

    The prevalence of vitamin D deficiency is increasing in various nations. According to the data published by PubMed in 2019, Serum 25 (OH)D is considered a marker for assessing vitamin D status. A range of below 75 nmol/L (or 30 ng/ml) of serum/plasma 25 (OH)D concentration is considered vitamin D deficiency. A cutoff of <25 or <30 nmol/L (or 10/12 ng/ml) increases the risk of nutritional rickets and osteomalacia, considered severe vitamin D deficiency. Vitamin D deficiency majorly causes rickets in children and osteoporosis in adults. It is also linked to high blood pressure, common malignancies, and viral illnesses.

    Additionally, vitamin D is essential for the development of skeletal structure and dental enamel in children. It can cause numerous problems in newborns, such as irritability, development failure, and a higher risk of respiratory infections later in life.

    Furthermore, according to the data published by PubMed in 2019, prevalence rates of severe vitamin D deficiency, defined as 25 (OH)D <30 nmol/L, were reported as 5.9% in the US, 7.4% in Canada, and 13% in Europe. The prevalence of 25 (OH)D levels <50 nmol/L has been reported as 24% in the US, 37% in Canada, and 40% in Europe. The increasing prevalence and awareness regarding the risks associated with vitamin D deficiency are expected to be a major factor driving the growth of the global vitamin D market for the forecast period.

    The growing recognition of Vitamin D's role in immune function and overall health suggests a sustained increase in consumer demand for supplementation, particularly in regions with limited sunlight exposure.

    National Institutes of Health

    Vitamins D Market Drivers

    Rising Awareness of Health Benefits

    The Global Vitamins D Market Industry experiences a notable driver in the increasing awareness regarding the health benefits associated with Vitamin D. This vitamin is crucial for bone health, immune function, and overall well-being. As consumers become more informed about the potential risks of Vitamin D deficiency, there is a growing demand for supplements. In 2024, the market is projected to reach 1.33 USD Billion, reflecting a shift in consumer behavior towards preventive health measures. This trend is likely to continue as educational campaigns and healthcare recommendations emphasize the importance of adequate Vitamin D levels.

    Market Segment Insights

    Get more detailed insights about Vitamins D Market Research Report—Global Forecast till 2032

    Regional Insights

    Key Companies in the Vitamins D Market market include

    Industry Developments

    March 2021: koninklijke dsm n.v launched ampli-D, a vitamin D under the brand name FORTARO for dietary supplements in Australia. This product launch extended company's nutrition portfolio.

    December 2021: Prinova acquired Lakeshore Technologies, contract manufacturer experts in powder micronizing, blending, and repacking. This acquisition helped Prinova to build a more sustainable operation.

    January 2021: The Kellogg company expanded its raisin bran line portfolio with raisin bran toasted oats and honey.

    May 2021: The Kellogg company collaborated with McKee Foods' Little Debbie brand to launch new cosmic brownies cereal. This launch expanded its portfolio.

    Future Outlook

    Vitamins D Market Future Outlook

    The Global Vitamins D Market is projected to grow at a 5.6% CAGR from 2024 to 2035, driven by rising health awareness, increasing supplementation demand, and regulatory support.

    New opportunities lie in:

    • Develop innovative delivery formats to enhance bioavailability and consumer appeal.
    • Expand product lines targeting specific demographics, such as children and seniors.
    • Leverage digital marketing strategies to educate consumers on the benefits of Vitamin D.

    By 2035, the market is expected to demonstrate robust growth, reflecting evolving consumer preferences and enhanced product offerings.

    Market Segmentation

    Vitamins D Regional Outlook

    • US
    • Canada

    Vitamins D Application Outlook

    • Bakery & Confectionery
    • Dairy & Frozen Desserts
    • Meat Alternatives
    • Oils & Fats
    • Sports Nutrition
    • Dairy Alternatives
    • Dietary Supplements
    • Breakfast Cereals
    • Others

    Vitamins D Type of Cover Outlook

    • Vitamins D3
    • Vitamins D2

    Report Scope

    Report Attribute/Metric Details
    Market Size 2023 USD 1263.45 Million
    Market Size 2024 USD 1331.05 Million
    Market Size 2032 USD 2034.60 Million
    Compound Annual Growth Rate (CAGR) 6.0% (2024-2032)
    Base Year 2023
    Forecast Period 2024-2032
    Historical Data 2019 & 2023
    Forecast Units Value (USD Billion) and Volume (Billion Sq. Meter)
    Report Coverage Revenue Forecast, Competitive Landscape, Growth Factors, and Trends
    Segments Covered Type, Form, End User, Application, Distribution Channel, and Region
    Geographies Covered North America, Europe, Asia Pacific, and Rest of the World
    Countries Covered The U.S., Canada, Germany, France, UK, Italy, Spain, China, Japan, India, Mexico, GCC Countries, and South Africa.
    Key Companies Profiled Koninklijke DSM N.V. (Netherlands), BASF SE (Germany), Farbest Brands (US), Zhejiang Garden Biochemical High-tech Co., Ltd. (China), Pharmavit (Netherlands), Prinova Group LLC. (US), Piramal Pharma Solutions (India), SternVitamin GmbH & Co. KG (Germany), Fermenta Biotech Limited (India), Glanbia plc. (Ireland), The Coca-Cola Company (US), Creamline Dairy Products Ltd (India), Mother Dairy (India), Pepsico (US), Nestle (Switzerland), Chlorophyll Water (US), The Kellogg Company (US), The Hain Celestial Group, Inc. (US), General Mills Inc. (US), and Danone S.A (France).
    Key Market Opportunities Rising demand for naturally sourced vitamins in end-use industries
    Key Market Dynamics Increasing prevalence of vitamin D deficiency Increasing demand for vitamin D ingredients in the cosmetics industry Increasing health consciousness among the population

    Market Highlights

    Author
    Pradeep Nandi
    Senior Research Analyst

    I have a bachelor's degree in mechanical engineering and an MBA. I have more than two years of expertise in the retail, food, and beverage, chemical, and material industries, and hence have developed a sound cross-domain expertise. A firm believer in lifelong learning and sharing of knowledge. Having a proclivity for hatching ideas and trying to absorb as much information as possible in a short amount of time. Introducing corporates to the data and insight, which enables them to move from probability to possibility, has been my key areas of interest. 

    Leave a Comment

    FAQs

    How much is the vitamin D market worth?

    The global vitamin D market is pegged at USD 2034.60 million as of 2032.

    How Big is the U.S. vitamin D market?

    The US vitamin D market is poised to grow at 75.44 % market share during 2023.

    What is the growth rate of the vitamin D market?

    The global vitamin D market is poised to grow at 6.00% CAGR during 2024-2032.

    Which region held the largest market share in the vitamin D market?

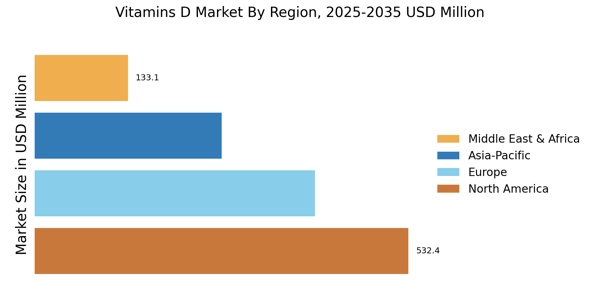
    Europe region held the largest market share in the global vitamin D market and a market share of 33.01% in 2023.

    Who are the key players in the vitamin D market?

    Koninklijke DSM N.V. (Netherlands), BASF SE (Germany), Farbest Brands (US), Zhejiang Garden Biochemical High-tech Co., Ltd. (China), Pharmavit (Netherlands), Prinova Group LLC. (US), Piramal Pharma Solutions (India), SternVitamin GmbH &amp; Co. KG (Germany), Fermenta Biotech Limited (India), Glanbia plc. (Ireland), The Coca-Cola Company (US), Creamline Dairy Products Ltd (India), Mother Dairy (India), Pepsico (US), Nestle (Switzerland), Chlorophyll Water (US), The Kellogg Company (US), The Hain Celestial Group, Inc. (US), General Mills Inc. (US), and Danone S.A (France) are some of the vital players operating in the vitamins D market.

    Which type led the vitamin D market?

    Usage of Vitamin D3 is poised to drive the vitamin D market, which is poised to grow at a market share of 74.92% during 2022-2030

    Which application had the largest market share in the vitamin D market?

    Dietary Supplements are poised to hold an upper hand when it comes to sales of vitamin D across diverse geographies.

    1. EXECUTIVE SUMMARY 17
      1. GLOBAL VITAMIN & MINERAL
    2. SUPPLEMENTS MARKET, BY TYPE 20
      1. GLOBAL
    3. VITAMIN & MINERAL SUPPLEMENTS MARKET, BY FORM 21
    4. GLOBAL VITAMIN & MINERAL SUPPLEMENTS MARKET, BY END-USER 22
      1. GLOBAL VITAMIN & MINERAL SUPPLEMENTS MARKET, BY APPLICATION
      2. GLOBAL VITAMIN & MINERAL SUPPLEMENTS
    5. MARKET, BY DISTRIBUTION CHANNEL 24
      1. GLOBAL
    6. VITAMIN & MINERAL SUPPLEMENTS MARKET, BY REGION 25
    7. MARKET INTRODUCTION 26
      1. DEFINITION 26
      2. SCOPE OF THE STUDY 26
    8. RESEARCH OBJECTIVE 26
      1. MARKET STRUCTURE 27
    9. RESEARCH METHODOLOGY 28
    10. RESEARCH PROCESS 28
      1. PRIMARY RESEARCH 29
      2. SECONDARY RESEARCH 30
    11. MARKET SIZE ESTIMATION 31
      1. FORECAST
    12. MODEL 32
      1. LIST OF ASSUMPTIONS &
    13. LIMITATIONS 33
    14. MARKET DYNAMICS 34
      1. INTRODUCTION 34
      2. DRIVERS
        1. GROWING DEMAND FOR IMMUNITY-BOOSTING
    15. PRODUCTS 35
      1. US GYM MEMBERSHIP BY GENERATION,
        1. INCREASING HEALTHCARE COSTS
        2. DRIVERS IMPACT ANALYSIS 37
      2. RESTRAINT 37
        1. RISE
    16. OF COUNTERFEIT AND FAKE PRODUCTS SUPPLY 37
    17. RESTRAINT IMPACT ANALYSIS 38
      1. OPPORTUNITIES
        1. STRONG GROWTH OF THE GERIATRIC
    18. POPULATION 38
      1. GROWTH OF E-COMMERCE SALES
    19. IN THE DIETARY SUPPLEMENTS INDUSTRY 39
      1. CHALLENGES
        1. VARYING GOVERNMENT REGULATIONS
    20. RELATED TO LABELING AND CLAIMS 40
    21. MARKET FACTOR ANALYSIS 41
      1. VALUE CHAIN ANALYSIS 41
        1. RAW MATERIAL PROCUREMENT 42
    22. PROCESSING 42
      1. PACKING 42
      2. SUPPLY CHAIN ANALYSIS 43
    23. RAW MATERIAL SOURCING 44
      1. MANUFACTURING 44
        1. DISTRIBUTION 44
    24. END-USER 44
      1. PORTER'S FIVE FORCES MODEL
        1. THREAT OF NEW ENTRANTS 45
        2. BARGAINING POWER OF SUPPLIERS 46
    25. THREAT OF SUBSTITUTES 46
      1. BARGAINING POWER OF BUYERS
        1. INTENSITY OF RIVALRY 46
      2. IMPACT OF COVID-19 ON THE GLOBAL VITAMIN AND MINERAL SUPPLEMENTS
    26. MARKET 47
      1. IMPACT ON RAW MATERIAL
    27. AVAILABILITY & PRODUCTION 47
      1. IMPACT
    28. ON CONSUMER BUYING BEHAVIOUR 48
      1. IMPACT
    29. ON ONLINE VS STORE-BASED SALES 48
      1. IMPACT
    30. ON PRICING 48
    31. GLOBAL VITAMIN & MINERAL
    32. SUPPLEMENTS MARKET, BY TYPE 49
      1. OVERVIEW
        1. GLOBAL VITAMIN & MINERAL SUPPLEMENTS
    33. MARKET ESTIMATES & FORECAST, BY TYPE, 2024–2032 50
    34. VITAMINS 51
      1. VITAMINS: MARKET ESTIMATES
    35. & FORECAST, BY REGION, 2024–2032 52
    36. MINERALS 52
      1. MINERALS: MARKET ESTIMATES
    37. & FORECAST, BY REGION, 2024–2032 53
    38. GLOBAL VITAMIN & MINERAL SUPPLEMENTS MARKET, BY FORM 54
    39. OVERVIEW 54
      1. GLOBAL VITAMIN & MINERAL
    40. SUPPLEMENTS MARKET ESTIMATES & FORECAST, BY FORM, 2024–2032 55
      1. POWDER 55
        1. POWDER:
    41. MARKET ESTIMATES & FORECAST, BY REGION, 2024–2032 55
      1. CAPSULE & TABLETS 56
    42. CAPSULE & TABLETS: MARKET ESTIMATES & FORECAST, BY REGION, 2024–2032
      1. LIQUID 57
    43. LIQUID: MARKET ESTIMATES & FORECAST, BY REGION, 2024–2032 57
      1. OTHERS 58
        1. OTHERS:
    44. MARKET ESTIMATES & FORECAST, BY REGION, 2024–2032 58
    45. GLOBAL VITAMIN & MINERAL SUPPLEMENTS MARKET, BY END USER
      1. OVERVIEW 59
    46. GLOBAL VITAMIN & MINERAL SUPPLEMENTS MARKET ESTIMATES & FORECAST, BY END
    47. USER, 2024–2032 60
      1. MEN 60
    48. MEN: MARKET ESTIMATES & FORECAST, BY REGION, 2024–2032 60
      1. WOMEN 61
        1. WOMEN:
    49. MARKET ESTIMATES & FORECAST, BY REGION, 2024–2032 61
      1. UNISEX 62
        1. UNISEX:
    50. MARKET ESTIMATES & FORECAST, BY REGION, 2024–2032 62
    51. GLOBAL VITAMIN & MINERAL SUPPLEMENTS MARKET, BY APPLICATION
      1. OVERVIEW 63
    52. GLOBAL VITAMIN & MINERAL SUPPLEMENTS MARKET ESTIMATES & FORECAST, BY APPLICATION,
      1. ENERGY/SPORTS NUTRITION 65
        1. ENERGY/ SPORTS NUTRITION: MARKET ESTIMATES & FORECAST,
    53. BY REGION, 2024–2032 65
      1. WEIGHT
    54. MANAGEMENT 66
      1. WEIGHT MANAGEMENT: MARKET
    55. ESTIMATES & FORECAST, BY REGION, 2024–2032 66
    56. IMMUNITY AND DIGESTIVE HEALTH 67
      1. IMMUNITY
    57. AND DIGESTIVE HEALTH: MARKET ESTIMATES & FORECAST, BY REGION, 2024–2032
      1. ANTI-CANCER 68
        1. ANTI-CANCER: MARKET ESTIMATES & FORECAST, BY REGION,
      2. SKIN CARE 69
        1. SKIN CARE: MARKET ESTIMATES & FORECAST, BY REGION,
      3. GLYCEMIC & DIABETES MANAGEMENT
        1. GLYCEMIC & DIABETES MANAGEMENT:
    58. MARKET ESTIMATES & FORECAST, BY REGION, 2024–2032 70
      1. OTHER 71
        1. OTHER:
    59. MARKET ESTIMATES & FORECAST, BY REGION, 2024–2032 71
    60. GLOBAL VITAMIN & MINERAL SUPPLEMENTS MARKET, BY DISTRIBUTION
    61. CHANNEL 72
      1. OVERVIEW 72
        1. GLOBAL VITAMIN & MINERAL SUPPLEMENTS MARKET ESTIMATES
    62. & FORECAST, BY DISTRIBUTION CHANNEL, 2024–2032 73
    63. SUPERMARKET & HYPERMARKET 74
      1. SUPERMARKET
    64. & HYPERMARKET: MARKET ESTIMATES & FORECAST, BY REGION, 2024–2032 74
      1. CHEMIST/PHARMACIES 75
    65. CHEMIST/PHARMACIES: MARKET ESTIMATES & FORECAST, BY REGION, 2024–2032
      1. DRUGSTORES/PARAPHARAMCIES 76
        1. DRUGSTORES/PARAPHARAMCIES: MARKET ESTIMATES & FORECAST,
    66. BY REGION, 2024–2032 76
      1. ONLINE
        1. ONLINE: MARKET ESTIMATES &
    67. FORECAST, BY REGION, 2024–2032 77
      1. OTHERS
        1. OTHERS: MARKET ESTIMATES &
    68. FORECAST, BY REGION, 2024–2032 78
    69. GLOBAL
    70. VITAMIN & MINERAL SUPPLEMENT MARKET, BY REGION 79
    71. OVERVIEW 79
      1. NORTH AMERICA 81
        1. US 84
        2. CANADA
        3. MEXICO 88
    72. EUROPE 90
      1. GERMANY 93
        1. UK 95
        2. FRANCE
        3. SPAIN 99
    73. ITALY 101
      1. REST OF EUROPE 103
      2. ASIA-PACIFIC 106
    74. CHINA 109
      1. JAPAN 111
        1. INDIA 113
        2. AUSTRALIA
    75. & NEW ZEALAND 115
      1. REST OF ASIA-PACIFIC 117
      2. REST OF THE WORLD 119
    76. SOUTH AMERICA 122
      1. MIDDLE EAST 124
        1. AFRICA 126
    77. COMPETITIVE LANDSCAPE 128
      1. INTRODUCTION 128
      2. MARKET STRATEGY ANALYSIS 128
    78. COMPETITIVE BENCHMARKING 129
      1. KEY
    79. DEVELOPMENTS & GROWTH STRATEGIES 131
      1. PRODUCT
    80. LAUNCH 131
      1. EXPANSION 132
        1. ACQUISITION 133
    81. JOINT VENTURE 133
    82. COMPANY PROFILES 134
      1. BAYER AG 134
        1. COMPANY
    83. OVERVIEW 134
      1. FINANCIAL OVERVIEW 135
        1. PRODUCTS OFFERED 135
    84. KEY DEVELOPMENTS 136
      1. SWOT ANALYSIS 136
        1. KEY STRATEGIES 137
    85. GLANBIA PLC 138
      1. COMPANY OVERVIEW 138
        1. FINANCIAL OVERVIEW 139
    86. PRODUCTS OFFERED 140
      1. KEY DEVELOPMENTS 140
        1. SWOT ANALYSIS 141
    87. KEY STRATEGIES 141
      1. ABBOTT 142
        1. COMPANY OVERVIEW 142
    88. FINANCIAL OVERVIEW 143
      1. PRODUCTS OFFERED 143
        1. KEY DEVELOPMENTS 144
    89. SWOT ANALYSIS 145
      1. KEY STRATEGIES 145
      2. PFIZER INC. 146
        1. COMPANY
    90. OVERVIEW 146
      1. FINANCIAL OVERVIEW 146
        1. PRODUCTS OFFERED 147
    91. KEY DEVELOPMENTS 147
      1. SWOT ANALYSIS 148
        1. KEY STRATEGIES 148
    92. AMWAY CORP. 149
      1. COMPANY OVERVIEW 149
        1. FINANCIAL OVERVIEW 149
    93. PRODUCTS OFFERED 150
      1. KEY DEVELOPMENTS 150
        1. SWOT ANALYSIS 151
    94. KEY STRATEGIES 151
      1. GSK PLC. 152
        1. COMPANY OVERVIEW 152
    95. FINANCIAL OVERVIEW 153
      1. PRODUCTS OFFERED 153
        1. KEY DEVELOPMENTS 154
    96. KEY STRATEGIES 154
      1. HERBALIFE INTERNATIONAL
    97. OF AMERICA, INC. 155
      1. COMPANY OVERVIEW 155
        1. FINANCIAL OVERVIEW 156
    98. PRODUCTS OFFERED 156
      1. KEY DEVELOPMENTS 157
        1. KEY STRATEGIES 157
    99. OTSUKA PHARMACEUTICAL CO., LTD. 158
      1. COMPANY
    100. OVERVIEW 158
      1. FINANCIAL OVERVIEW 158
        1. PRODUCTS OFFERED 159
    101. KEY DEVELOPMENTS 160
      1. KEY STRATEGIES 160
      2. NATURE'S WAY BRANDS 161
    102. COMPANY OVERVIEW 161
      1. FINANCIAL OVERVIEW 161
        1. PRODUCTS OFFERED 161
    103. KEY DEVELOPMENTS 162
      1. KEY STRATEGIES 162
      2. NATURE'S BOUNTY 163
    104. COMPANY OVERVIEW 163
      1. FINANCIAL OVERVIEW 163
        1. PRODUCTS OFFERED 163
    105. KEY DEVELOPMENTS 164
      1. KEY STRATEGIES 164
      2. GLOBAL CALCIUM PVT LTD 165
    106. COMPANY OVERVIEW 165
      1. FINANCIAL OVERVIEW 165
        1. PRODUCTS OFFERED 165
    107. KEY DEVELOPMENTS 166
      1. SWOT ANALYSIS 166
        1. KEY STRATEGIES 166
    108. LEHMANN&VOSS&CO. (LEHVOSS) 167
    109. COMPANY OVERVIEW 167
      1. FINANCIAL OVERVIEW 167
        1. PRODUCTS OFFERED 167
    110. KEY DEVELOPMENTS 168
      1. SWOT ANALYSIS 169
        1. KEY STRATEGIES 169
    111. ZINPRO CORP. 170
      1. COMPANY OVERVIEW 170
        1. FINANCIAL OVERVIEW 170
    112. PRODUCTS OFFERED 170
      1. KEY DEVELOPMENTS 171
        1. SWOT ANALYSIS 171
    113. KEY STRATEGIES 171
      1. NOVOTECH NUTRACEUTICALS,
    114. INC. 172
      1. COMPANY OVERVIEW 172
        1. FINANCIAL OVERVIEW 172
    115. PRODUCTS OFFERED 172
      1. KEY DEVELOPMENTS 172
        1. SWOT ANALYSIS 173
    116. KEY STRATEGIES 173
      1. AMERICA ALIMENTOS SA DE
    117. CV 174
      1. COMPANY OVERVIEW 174
        1. FINANCIAL OVERVIEW 174
    118. PRODUCTS OFFERED 174
      1. KEY DEVELOPMENTS 174
        1. SWOT ANALYSIS 175
    119. KEY STRATEGIES 175
      1. JOST CHEMICAL CO. 176
        1. COMPANY OVERVIEW 176
    120. FINANCIAL OVERVIEW 176
      1. PRODUCTS OFFERED 176
        1. KEY DEVELOPMENTS 177
    121. KEY STRATEGIES 177
    122. APPENDIX 178
      1. REFERENCES 178
      2. RELATED
    123. REPORTS 178
    124. LIST
    125. OF TABLES
    126. & FORECAST, BY TYPE, 2024–2032 (USD MILLION) 50
    127. VITAMINS: MARKET ESTIMATES & FORECAST, BY REGION, 2024–2032 (USD MILLION)
    128. FORECAST, BY REGION, 2024–2032 (USD MILLION) 53
    129. GLOBAL VITAMIN & MINERAL SUPPLEMENTS MARKET ESTIMATES & FORECAST, BY FORM,
    130. –2032 (USD MILLION) 55
    131. POWDER: MARKET ESTIMATES & FORECAST, BY REGION, 2024–2032 (USD MILLION)
    132. ESTIMATES & FORECAST, BY REGION, 2024–2032 (USD MILLION) 56
    133. –2032 (USD MILLION) 57
    134. OTHERS: MARKET ESTIMATES & FORECAST, BY REGION, 2024–2032 (USD MILLION)
    135. SUPPLEMENTS MARKET ESTIMATES & FORECAST, BY END USER, 2024–2032 (USD MILLION)
    136. FORECAST, BY REGION, 2024–2032 (USD MILLION) 60
    137. WOMEN: MARKET ESTIMATES & FORECAST, BY REGION, 2024–2032 (USD MILLION)
    138. FORECAST, BY REGION, 2024–2032 (USD MILLION) 62
    139. GLOBAL VITAMIN & MINERAL SUPPLEMENTS MARKET ESTIMATES & FORECAST, BY
    140. APPLICATION, 2024–2032 (USD MILLION) 64
    141. ENERGY/ SPORTS NUTRITION: MARKET ESTIMATES & FORECAST, BY REGION, 2024–2032
    142. (USD MILLION) 65
    143. ESTIMATES & FORECAST, BY REGION, 2024–2032 (USD MILLION) 66
    144. FORECAST, BY REGION, 2024–2032 (USD MILLION) 67
    145. ANTI-CANCER: MARKET ESTIMATES & FORECAST, BY REGION, 2024–2032 (USD
    146. MILLION) 68
    147. & FORECAST, BY REGION, 2024–2032 (USD MILLION) 69
    148. GLYCEMIC & DIABETES MANAGEMENT: MARKET ESTIMATES & FORECAST, BY REGION,
    149. –2032 (USD MILLION) 70
    150. OTHER: MARKET ESTIMATES & FORECAST, BY REGION, 2024–2032 (USD MILLION)
    151. SUPPLEMENTS MARKET ESTIMATES & FORECAST, BY DISTRIBUTION CHANNEL, 2024–2032
    152. (USD MILLION) 73
    153. MARKET ESTIMATES & FORECAST, BY REGION, 2024–2032 (USD MILLION) 74
    154. BY REGION, 2024–2032 (USD MILLION) 75
    155. DRUGSTORES/PARAPHARAMCIES: MARKET ESTIMATES & FORECAST, BY REGION, 2024–2032
    156. (USD MILLION) 76
    157. & FORECAST, BY REGION, 2024–2032 (USD MILLION) 77
    158. OTHERS: MARKET ESTIMATES & FORECAST, BY REGION, 2024–2032 (USD MILLION)
    159. SUPPLEMENT MARKET ESTIMATES & FORECAST, BY REGION, 2024–2032 (USD MILLION)
    160. MINERAL SUPPLEMENT MARKET ESTIMATES & FORECAST, BY COUNTRY, 2024–2032
    161. (USD MILLION) 81
    162. & MINERAL SUPPLEMENT MARKET, BY TYPE, 2024–2032 (USD MILLION) 82
    163. BY FORM, 2024–2032 (USD MILLION) 82
    164. NORTH AMERICA: VITAMIN & MINERAL SUPPLEMENT MARKET, BY END USER, 2024–2032
    165. (USD MILLION) 83
    166. & MINERAL SUPPLEMENT MARKET, BY APPLICATION, 2024–2032 (USD MILLION) 83
    167. BY DISTRIBUTION CHANNEL, 2024–2032 (USD MILLION) 83
    168. US: VITAMIN & MINERAL SUPPLEMENT MARKET, BY TYPE, 2024–2032 (USD MILLION)
    169. MARKET, BY FORM, 2024–2032 (USD MILLION) 84
    170. US: VITAMIN & MINERAL SUPPLEMENT MARKET, BY END USER, 2024–2032 (USD
    171. MILLION) 85
    172. SUPPLEMENT MARKET, BY APPLICATION, 2024–2032 (USD MILLION) 85
    173. CHANNEL, 2024–2032 (USD MILLION) 85
    174. CANADA: VITAMIN & MINERAL SUPPLEMENT MARKET, BY TYPE, 2024–2032 (USD MILLION)
    175. SUPPLEMENT MARKET, BY FORM, 2024–2032 (USD MILLION) 86
    176. CANADA: VITAMIN & MINERAL SUPPLEMENT MARKET, BY END USER, 2024–2032
    177. (USD MILLION) 87
    178. MINERAL SUPPLEMENT MARKET, BY APPLICATION, 2024–2032 (USD MILLION) 87
    179. DISTRIBUTION CHANNEL, 2024–2032 (USD MILLION) 87
    180. MEXICO: VITAMIN & MINERAL SUPPLEMENT MARKET, BY TYPE, 2024–2032 (USD
    181. MILLION) 88
    182. MINERAL SUPPLEMENT MARKET, BY FORM, 2024–2032 (USD MILLION) 88
    183. END USER, 2024–2032 (USD MILLION) 89
    184. MEXICO: VITAMIN & MINERAL SUPPLEMENT MARKET, BY APPLICATION, 2024–2032
    185. (USD MILLION) 89
    186. MINERAL SUPPLEMENT MARKET, BY DISTRIBUTION CHANNEL, 2024–2032 (USD MILLION)
    187. SUPPLEMENT MARKET ESTIMATES & FORECAST, BY COUNTRY, 2019–2030 (USD MILLION)
    188. SUPPLEMENT MARKET, BY TYPE, 2024–2032 (USD MILLION) 91
    189. EUROPE: VITAMIN & MINERAL SUPPLEMENT MARKET, BY FORM, 2024–2032 (USD
    190. MILLION) 92
    191. MINERAL SUPPLEMENT MARKET, BY END USER, 2024–2032 (USD MILLION) 92
    192. APPLICATION, 2024–2032 (USD MILLION) 92
    193. EUROPE: VITAMIN & MINERAL SUPPLEMENT MARKET, BY DISTRIBUTION CHANNEL, 2024–2032
    194. (USD MILLION) 93
    195. MINERAL SUPPLEMENT MARKET, BY TYPE, 2024–2032 (USD MILLION) 93
    196. BY FORM, 2024–2032 (USD MILLION) 94
    197. GERMANY: VITAMIN & MINERAL SUPPLEMENT MARKET, BY END USER, 2024–2032 (USD
    198. MILLION) 94
    199. MINERAL SUPPLEMENT MARKET, BY APPLICATION, 2024–2032 (USD MILLION) 94
    200. BY DISTRIBUTION CHANNEL, 2024–2032 (USD MILLION) 95
    201. UK: VITAMIN & MINERAL SUPPLEMENT MARKET, BY TYPE, 2024–2032 (USD MILLION)
    202. MARKET, BY FORM, 2024–2032 (USD MILLION) 96
    203. UK: VITAMIN & MINERAL SUPPLEMENT MARKET, BY END USER, 2024–2032 (USD
    204. MILLION) 96
    205. SUPPLEMENT MARKET, BY APPLICATION, 2024–2032 (USD MILLION) 96
    206. CHANNEL, 2024–2032 (USD MILLION) 97
    207. FRANCE: VITAMIN & MINERAL SUPPLEMENT MARKET, BY TYPE, 2024–2032 (USD MILLION)
    208. SUPPLEMENT MARKET, BY FORM, 2024–2032 (USD MILLION) 98
    209. FRANCE: VITAMIN & MINERAL SUPPLEMENT MARKET, BY END USER, 2024–2032
    210. (USD MILLION) 98
    211. MINERAL SUPPLEMENT MARKET, BY APPLICATION, 2024–2032 (USD MILLION) 98
    212. DISTRIBUTION CHANNEL, 2024–2032 (USD MILLION) 99
    213. SPAIN: VITAMIN & MINERAL SUPPLEMENT MARKET, BY TYPE, 2024–2032 (USD
    214. MILLION) 99
    215. MINERAL SUPPLEMENT MARKET, BY FROM, 2024–2032 (USD MILLION) 100
    216. END USER, 2024–2032 (USD MILLION) 100
    217. SPAIN: VITAMIN & MINERAL SUPPLEMENT MARKET, BY APPLICATION, 2024–2032
    218. (USD MILLION) 100
    219. MINERAL SUPPLEMENT MARKET, BY DISTRIBUTION CHANNEL, 2024–2032 (USD MILLION)
    220. SUPPLEMENT MARKET, BY TYPE, 2024–2032 (USD MILLION) 101
    221. ITALY: VITAMIN & MINERAL SUPPLEMENT MARKET, BY FROM, 2024–2032 (USD
    222. MILLION) 102
    223. MINERAL SUPPLEMENT MARKET, BY END USER, 2024–2032 (USD MILLION) 102
    224. APPLICATION, 2024–2032 (USD MILLION) 102
    225. ITALY: VITAMIN & MINERAL SUPPLEMENT MARKET, BY DISTRIBUTION CHANNEL, 2024–2032
    226. (USD MILLION) 103
    227. & MINERAL SUPPLEMENT MARKET, BY TYPE, 2024–2032 (USD MILLION) 103
    228. BY FORM, 2024–2032 (USD MILLION) 104
    229. REST OF EUROPE: VITAMIN & MINERAL SUPPLEMENT MARKET, BY END USER, 2024–2032
    230. (USD MILLION) 104
    231. & MINERAL SUPPLEMENT MARKET, BY APPLICATION, 2024–2032 (USD MILLION) 104
    232. BY DISTRIBUTION CHANNEL, 2024–2032 (USD MILLION) 105
    233. ASIA-PACIFIC: VITAMIN & MINERAL SUPPLEMENT MARKET ESTIMATES & FORECAST,
    234. BY COUNTRY, 2019–2030 (USD MILLION) 106
    235. ASIA-PACIFIC: VITAMIN & MINERAL SUPPLEMENT MARKET, BY TYPE, 2024–2032
    236. (USD MILLION) 107
    237. & MINERAL SUPPLEMENT MARKET, BY FROM, 2024–2032 (USD MILLION) 107
    238. BY END USER, 2024–2032 (USD MILLION) 108
    239. ASIA-PACIFIC: VITAMIN & MINERAL SUPPLEMENT MARKET, BY APPLICATION, 2024–2032
    240. (USD MILLION) 108
    241. & MINERAL SUPPLEMENT MARKET, BY DISTRIBUTION CHANNEL, 2024–2032 (USD MILLION)
    242. SUPPLEMENT MARKET, BY TYPE, 2024–2032 (USD MILLION) 109
    243. CHINA: VITAMIN & MINERAL SUPPLEMENT MARKET, BY FROM, 2024–2032 (USD
    244. MILLION) 109
    245. MINERAL SUPPLEMENT MARKET, BY END USER, 2024–2032 (USD MILLION) 110
    246. APPLICATION, 2024–2032 (USD MILLION) 110
    247. CHINA: VITAMIN & MINERAL SUPPLEMENT MARKET, BY DISTRIBUTION CHANNEL, 2024–2032
    248. (USD MILLION) 110
    249. MINERAL SUPPLEMENT MARKET, BY TYPE, 2024–2032 (USD MILLION) 111
    250. FROM, 2024–2032 (USD MILLION) 111
    251. JAPAN: VITAMIN & MINERAL SUPPLEMENT MARKET, BY END USER, 2024–2032 (USD
    252. MILLION) 112
    253. MINERAL SUPPLEMENT MARKET, BY APPLICATION, 2024–2032 (USD MILLION) 112
    254. DISTRIBUTION CHANNEL, 2024–2032 (USD MILLION) 112
    255. INDIA: VITAMIN & MINERAL SUPPLEMENT MARKET, BY TYPE, 2024–2032 (USD
    256. MILLION) 113
    257. MINERAL SUPPLEMENT MARKET, BY FROM, 2024–2032 (USD MILLION) 113
    258. END USER, 2024–2032 (USD MILLION) 114
    259. INDIA: VITAMIN & MINERAL SUPPLEMENT MARKET, BY APPLICATION, 2024–2032
    260. (USD MILLION) 114
    261. MINERAL SUPPLEMENT MARKET, BY DISTRIBUTION CHANNEL, 2024–2032 (USD MILLION)
    262. VITAMIN & MINERAL SUPPLEMENT MARKET, BY TYPE, 2024–2032 (USD MILLION)
    263. VITAMIN & MINERAL SUPPLEMENT MARKET, BY FROM, 2024–2032 (USD MILLION)
    264. VITAMIN & MINERAL SUPPLEMENT MARKET, BY END USER, 2024–2032 (USD MILLION)
    265. VITAMIN & MINERAL SUPPLEMENT MARKET, BY APPLICATION, 2024–2032 (USD MILLION)
    266. VITAMIN & MINERAL SUPPLEMENT MARKET, BY DISTRIBUTION CHANNEL, 2024–2032
    267. (USD MILLION) 116
    268. VITAMIN & MINERAL SUPPLEMENT MARKET, BY TYPE, 2024–2032 (USD MILLION)
    269. & MINERAL SUPPLEMENT MARKET, BY FROM, 2024–2032 (USD MILLION) 117
    270. MARKET, BY END USER, 2024–2032 (USD MILLION) 118
    271. REST OF ASIA-PACIFIC: VITAMIN & MINERAL SUPPLEMENT MARKET, BY APPLICATION,
    272. –2032 (USD MILLION) 118
    273. REST OF ASIA-PACIFIC: VITAMIN & MINERAL SUPPLEMENT MARKET, BY DISTRIBUTION CHANNEL,
    274. –2032 (USD MILLION) 118
    275. REST OF THE WORLD: VITAMIN & MINERAL SUPPLEMENT MARKET ESTIMATES & FORECAST,
    276. BY REGION, 2019–2030 (USD MILLION) 119
    277. REST OF THE WORLD: VITAMIN & MINERAL SUPPLEMENT MARKET, BY TYPE, 2024–2032
    278. (USD MILLION) 120
    279. VITAMIN & MINERAL SUPPLEMENT MARKET, BY FROM, 2024–2032 (USD MILLION)
    280. & MINERAL SUPPLEMENT MARKET, BY END USER, 2024–2032 (USD MILLION) 121
    281. MARKET, BY APPLICATION, 2024–2032 (USD MILLION) 121
    282. REST OF THE WORLD: VITAMIN & MINERAL SUPPLEMENT MARKET, BY DISTRIBUTION
    283. CHANNEL, 2024–2032 (USD MILLION) 121
    284. SOUTH AMERICA: VITAMIN & MINERAL SUPPLEMENT MARKET, BY TYPE, 2024–2032
    285. (USD MILLION) 122
    286. & MINERAL SUPPLEMENT MARKET, BY FORM, 2024–2032 (USD MILLION) 122
    287. BY END USER, 2024–2032 (USD MILLION) 123
    288. SOUTH AMERICA: VITAMIN & MINERAL SUPPLEMENT MARKET, BY APPLICATION, 2024–2032
    289. (USD MILLION) 123
    290. & MINERAL SUPPLEMENT MARKET, BY DISTRIBUTION CHANNEL, 2024–2032 (USD MILLION)
    291. MINERAL SUPPLEMENT MARKET, BY TYPE, 2024–2032 (USD MILLION) 124
    292. BY FROM, 2024–2032 (USD MILLION) 124
    293. MIDDLE EAST: VITAMIN & MINERAL SUPPLEMENT MARKET, BY END USER, 2024–2032
    294. (USD MILLION) 125
    295. & MINERAL SUPPLEMENT MARKET, BY APPLICATION, 2024–2032 (USD MILLION) 125
    296. BY DISTRIBUTION CHANNEL, 2024–2032 (USD MILLION) 125
    297. AFRICA: VITAMIN & MINERAL SUPPLEMENT MARKET, BY TYPE, 2024–2032 (USD
    298. MILLION) 126
    299. MINERAL SUPPLEMENT MARKET, BY FORM, 2024–2032 (USD MILLION) 126
    300. BY END USER, 2024–2032 (USD MILLION) 127
    301. AFRICA: VITAMIN & MINERAL SUPPLEMENT MARKET, BY APPLICATION, 2024–2032
    302. (USD MILLION) 127
    303. MINERAL SUPPLEMENT MARKET, BY DISTRIBUTION CHANNEL, 2024–2032 (USD MILLION)
    304. ACQUISITION 133
    305. BAYER AG: KEY DEVELOPMENTS 136
    306. GLANBIA PLC: PRODUCTS OFFERED 140
    307. GLANBIA PLC: KEY DEVELOPMENTS 140
    308. ABBOTT: PRODUCTS OFFERED 143
    309. ABBOTT: KEY DEVELOPMENTS 144
    310. PFIZER INC.: PRODUCTS OFFERED 147
    311. PFIZER INC.: KEY DEVELOPMENTS 147
    312. AMWAY CORP.: PRODUCTS OFFERED 150
    313. AMWAY CORP.: KEY DEVELOPMENTS 150
    314. GSK PLC.: PRODUCTS OFFERED 153
    315. GSK PLC.: KEY DEVELOPMENTS 154
    316. HERBALIFE INTERNATIONAL OF AMERICA, INC.: PRODUCTS OFFERED 156
    317. LTD.: PRODUCTS OFFERED 159
    318. OTSUKA PHARMACEUTICAL CO., LTD.: KEY DEVELOPMENTS 160
    319. NATURE'S WAY BRANDS: PRODUCTS OFFERED 161
    320. NATURE'S WAY BRANDS: KEY DEVELOPMENTS 162
    321. NATURE'S BOUNTY: PRODUCTS OFFERED 163
    322. NATURE'S BOUNTY: KEY DEVELOPMENTS 164
    323. GLOBAL CALCIUM PVT LTD: PRODUCTS OFFERED 165
    324. LEHMANN&VOSS&CO. (LEHVOSS): PRODUCTS OFFERED 167
    325. ZINPRO CORP.: PRODUCTS OFFERED 170
    326. NOVOTECH NUTRACEUTICALS, INC.: PRODUCTS OFFERED 172
    327. AMERICA ALIMENTOS SA DE CV: PRODUCTS OFFERED 174
    328. JOST CHEMICAL CO.: PRODUCTS OFFERED 176
    329. MARKET SYNOPSIS 19
    330. MINERAL SUPPLEMENTS MARKET ANALYSIS BY TYPE 20
    331. GLOBAL VITAMIN & MINERAL SUPPLEMENTS MARKET ANALYSIS BY FORM 21
    332. BY END-USER 22
    333. MINERAL SUPPLEMENTS MARKET ANALYSIS BY APPLICATION 23
    334. GLOBAL VITAMIN & MINERAL SUPPLEMENTS MARKET ANALYSIS BY DISTRIBUTION CHANNEL
    335. SUPPLEMENTS MARKET ANALYSIS BY REGION 25
    336. GLOBAL VITAMIN & MINERAL SUPPLEMENTS MARKET: STRUCTURE 27
    337. RESEARCH PROCESS 28
    338. APPROACHES 31
    339. ON INSULIN FOR DIABETES 36
    340. DRIVERS IMPACT ANALYSIS: GLOBAL VITAMIN AND MINERAL SUPPLEMENTS MARKET 37
    341. SUPPLEMENTS MARKET 38
    342. VITAMIN AND MINERAL SUPPLEMENTS MARKET 41
    343. GLOBAL VITAMIN AND MINERAL SUPPLEMENTS MARKET: SUPPLY CHAIN ANALYSIS 43
    344. AND MINERAL SUPPLEMENTS MARKET 45
    345. GLOBAL VITAMIN & MINERAL SUPPLEMENTS MARKET, BY TYPE, 2022 (% SHARE) 49
    346. BY TYPE, 2024–2032 (USD MILLION) 49
    347. GLOBAL VITAMIN & MINERAL SUPPLEMENTS MARKET, BY FORM, 2022 (% SHARE) 54
    348. BY FORM, 2024–2032 (USD MILLION) 54
    349. GLOBAL VITAMIN & MINERAL SUPPLEMENTS MARKET, BY END USER, 2022 (% SHARE) 59
    350. BY END USER, 2024–2032 (USD MILLION) 59
    351. GLOBAL VITAMIN & MINERAL SUPPLEMENTS MARKET, BY APPLICATION, 2022 (% SHARE)
    352. SUPPLEMENTS MARKET, BY APPLICATION, 2024–2032 (USD MILLION) 64
    353. BY DISTRIBUTION CHANNEL, 2022 (% SHARE) 72
    354. GLOBAL VITAMIN & MINERAL SUPPLEMENTS MARKET, BY DISTRIBUTION CHANNEL, 2024–2032
    355. (USD MILLION) 73
    356. MINERAL SUPPLEMENT MARKET, BY REGION, 2024–2032 (USD MILLION) 79
    357. REGION, 2022 (% SHARE) 80
    358. NORTH AMERICA: VITAMIN & MINERAL SUPPLEMENT MARKET SHARE, BY COUNTRY, 2022 (%
    359. SHARE) 81
    360. MINERAL SUPPLEMENT MARKET SHARE, BY COUNTRY, 2022 (% SHARE) 90
    361. SHARE, BY COUNTRY, 2022 (% SHARE) 106
    362. REST OF THE WORLD: VITAMIN & MINERAL SUPPLEMENT MARKET SHARE, BY REGION, 2022
    363. (% SHARE) 119
    364. COMPETITORS 129
    365. OVERVIEW SNAPSHOT 135
    366. SNAPSHOT 139
    367. SNAPSHOT 143
    368. SNAPSHOT 146
    369. SNAPSHOT 149
    370. SNAPSHOT 153
    371. OF AMERICA, INC.: FINANCIAL OVERVIEW SNAPSHOT 156
    372. OTSUKA PHARMACEUTICAL CO., LTD.: FINANCIAL OVERVIEW SNAPSHOT 158
    373. SWOT ANALYSIS 173
    374. SA DE CV: SWOT ANALYSIS 175

    Vitamins D Market Segmentation

    Vitamins D Type Outlook (USD Million, 2019-2030)

    • Vitamins D3
    • Vitamins D2

    Vitamins D Application Outlook (USD Million, 2019-2030)

    • Bakery & Confectionery
    • Dairy & Frozen Desserts
    • Meat Alternatives
    • Oils & Fats
    • Sports Nutrition
    • Dairy Alternatives
    • Dietary Supplements
    • Breakfast Cereals
    • Others

    Vitamins D Regional Outlook (USD Million, 2019-2030)

    • North America Outlook (USD Million, 2019-2030)

      • North America Vitamins D by Type

        • Vitamins D3
        • Vitamins D2
      • North America Vitamins D by Application

        • Bakery & Confectionery
        • Dairy & Frozen Desserts
        • Meat Alternatives
        • Oils & Fats
        • Sports Nutrition
        • Dairy Alternatives
        • Dietary Supplements
        • Breakfast Cereals
        • Others
      • US Outlook (USD Million, 2019-2030)

      • US Vitamins D by Type

        • Vitamins D3
        • Vitamins D2
      • US Vitamins D by Application

        • Bakery & Confectionery
        • Dairy & Frozen Desserts
        • Meat Alternatives
        • Oils & Fats
        • Sports Nutrition
        • Dairy Alternatives
        • Dietary Supplements
        • Breakfast Cereals
        • Others
      • Canada Outlook (USD Million, 2019-2030)

      • Canada Vitamins D by Type

        • Vitamins D3
        • Vitamins D2
      • Canada Vitamins D by Application

        • Bakery & Confectionery
        • Dairy & Frozen Desserts
        • Meat Alternatives
        • Oils & Fats
        • Sports Nutrition
        • Dairy Alternatives
        • Dietary Supplements
        • Breakfast Cereals
        • Others
    • Europe Outlook (USD Million, 2019-2030)

      • Europe Vitamins D by Type

        • Vitamins D3
        • Vitamins D2
      • Europe Vitamins D by Application

        • Bakery & Confectionery
        • Dairy & Frozen Desserts
        • Meat Alternatives
        • Oils & Fats
        • Sports Nutrition
        • Dairy Alternatives
        • Dietary Supplements
        • Breakfast Cereals
        • Others
      • Germany Outlook (USD Million, 2019-2030)

      • Germany Vitamins D by Type

        • Vitamins D3
        • Vitamins D2
      • Germany Vitamins D by Application

        • Bakery & Confectionery
        • Dairy & Frozen Desserts
        • Meat Alternatives
        • Oils & Fats
        • Sports Nutrition
        • Dairy Alternatives
        • Dietary Supplements
        • Breakfast Cereals
        • Others
      • UK Outlook (USD Million, 2019-2030)

      • UK Vitamins D by Type

        • Vitamins D3
        • Vitamins D2
      • UK Vitamins D by Application

        • Bakery & Confectionery
        • Dairy & Frozen Desserts
        • Meat Alternatives
        • Oils & Fats
        • Sports Nutrition
        • Dairy Alternatives
        • Dietary Supplements
        • Breakfast Cereals
        • Others
      • France Outlook (USD Million, 2019-2030)

      • France Vitamins D by Type

        • Vitamins D3
        • Vitamins D2
      • France Vitamins D by Application

        • Bakery & Confectionery
        • Dairy & Frozen Desserts
        • Meat Alternatives
        • Oils & Fats
        • Sports Nutrition
        • Dairy Alternatives
        • Dietary Supplements
        • Breakfast Cereals
        • Others
      • Italy Outlook (USD Million, 2019-2030)

      • Italy Vitamins D by Type

        • Vitamins D3
        • Vitamins D2
      • Italy Vitamins D by Application

        • Bakery & Confectionery
        • Dairy & Frozen Desserts
        • Meat Alternatives
        • Oils & Fats
        • Sports Nutrition
        • Dairy Alternatives
        • Dietary Supplements
        • Breakfast Cereals
        • Others
      • Spain Outlook (USD Million, 2019-2030)

      • Spain Vitamins D by Type

        • Vitamins D3
        • Vitamins D2
      • Spain Vitamins D by Application

        • Bakery & Confectionery
        • Dairy & Frozen Desserts
        • Meat Alternatives
        • Oils & Fats
        • Sports Nutrition
        • Dairy Alternatives
        • Dietary Supplements
        • Breakfast Cereals
        • Others
      • Netherland Outlook (USD Million, 2019-2030)

      • Netherland Vitamins D by Type

        • Vitamins D3
        • Vitamins D2
      • Netherland Vitamins D by Application

        • Bakery & Confectionery
        • Dairy & Frozen Desserts
        • Meat Alternatives
        • Oils & Fats
        • Sports Nutrition
        • Dairy Alternatives
        • Dietary Supplements
        • Breakfast Cereals
        • Others
      • Rest of Europe Outlook (USD Million, 2019-2030)

      • Rest of Europe Vitamins D by Type

        • Vitamins D3
        • Vitamins D2
      • Rest of Europe Vitamins D by Application

        • Bakery & Confectionery
        • Dairy & Frozen Desserts
        • Meat Alternatives
        • Oils & Fats
        • Sports Nutrition
        • Dairy Alternatives
        • Dietary Supplements
        • Breakfast Cereals
        • Others
    • Asia-Pacific Outlook (USD Million, 2019-2030)

      • Asia-Pacific Vitamins D by Type

        • Vitamins D3
        • Vitamins D2
      • Asia-Pacific Vitamins D by Application

        • Bakery & Confectionery
        • Dairy & Frozen Desserts
        • Meat Alternatives
        • Oils & Fats
        • Sports Nutrition
        • Dairy Alternatives
        • Dietary Supplements
        • Breakfast Cereals
        • Others
      • China Outlook (USD Million, 2019-2030)

      • China Vitamins D by Type

        • Vitamins D3
        • Vitamins D2
      • China Vitamins D by Application

        • Bakery & Confectionery
        • Dairy & Frozen Desserts
        • Meat Alternatives
        • Oils & Fats
        • Sports Nutrition
        • Dairy Alternatives
        • Dietary Supplements
        • Breakfast Cereals
        • Others
      • Japan Outlook (USD Million, 2019-2030)

      • Japan Vitamins D by Type

        • Vitamins D3
        • Vitamins D2
      • Japan Vitamins D by Application

        • Bakery & Confectionery
        • Dairy & Frozen Desserts
        • Meat Alternatives
        • Oils & Fats
        • Sports Nutrition
        • Dairy Alternatives
        • Dietary Supplements
        • Breakfast Cereals
        • Others
      • India Outlook (USD Million, 2019-2030)

      • India Vitamins D by Type

        • Vitamins D3
        • Vitamins D2
      • India Vitamins D by Application

        • Bakery & Confectionery
        • Dairy & Frozen Desserts
        • Meat Alternatives
        • Oils & Fats
        • Sports Nutrition
        • Dairy Alternatives
        • Dietary Supplements
        • Breakfast Cereals
        • Others
      • Australia & New Zealand Outlook (USD Million, 2019-2030)

      • Australia & New Zealand Vitamins D by Type

        • Vitamins D3
        • Vitamins D2
      • Australia & New Zealand Vitamins D by Application

        • Bakery & Confectionery
        • Dairy & Frozen Desserts
        • Meat Alternatives
        • Oils & Fats
        • Sports Nutrition
        • Dairy Alternatives
        • Dietary Supplements
        • Breakfast Cereals
        • Others
      • Rest of Asia-Pacific Outlook (USD Million, 2019-2030)

      • Rest of Asia-Pacific Vitamins D by Type

        • Vitamins D3
        • Vitamins D2
      • Rest of Asia-Pacific Vitamins D by Application

        • Bakery & Confectionery
        • Dairy & Frozen Desserts
        • Meat Alternatives
        • Oils & Fats
        • Sports Nutrition
        • Dairy Alternatives
        • Dietary Supplements
        • Breakfast Cereals
        • Others
    • Latin America Outlook (USD Million, 2019-2030)

      • Latin America Vitamins D by Type

        • Vitamins D3
        • Vitamins D2
      • Latin America Vitamins D by Application

        • Bakery & Confectionery
        • Dairy & Frozen Desserts
        • Meat Alternatives
        • Oils & Fats
        • Sports Nutrition
        • Dairy Alternatives
        • Dietary Supplements
        • Breakfast Cereals
        • Others
      • Brazil Outlook (USD Million, 2019-2030)

      • Brazil Vitamins D by Type

        • Vitamins D3
        • Vitamins D2
      • Brazil Vitamins D by Application

        • Bakery & Confectionery
        • Dairy & Frozen Desserts
        • Meat Alternatives
        • Oils & Fats
        • Sports Nutrition
        • Dairy Alternatives
        • Dietary Supplements
        • Breakfast Cereals
        • Others
      • Mexico Outlook (USD Million, 2019-2030)

      • Brazil Vitamins D by Type

        • Vitamins D3
        • Vitamins D2
      • Mexico Vitamins D by Application

        • Bakery & Confectionery
        • Dairy & Frozen Desserts
        • Meat Alternatives
        • Oils & Fats
        • Sports Nutrition
        • Dairy Alternatives
        • Dietary Supplements
        • Breakfast Cereals
        • Others
      • Argentina Outlook (USD Million, 2019-2030)

      • Argentina Vitamins D by Type

        • Vitamins D3
        • Vitamins D2
      • Argentina Vitamins D by Application

        • Bakery & Confectionery
        • Dairy & Frozen Desserts
        • Meat Alternatives
        • Oils & Fats
        • Sports Nutrition
        • Dairy Alternatives
        • Dietary Supplements
        • Breakfast Cereals
        • Others
      • Rest of Latin America Outlook (USD Million, 2019-2030)

      • Rest of Latin America Vitamins D by Type

        • Vitamins D3
        • Vitamins D2
      • Rest of Latin America Vitamins D by Application

        • Bakery & Confectionery
        • Dairy & Frozen Desserts
        • Meat Alternatives
        • Oils & Fats
        • Sports Nutrition
        • Dairy Alternatives
        • Dietary Supplements
        • Breakfast Cereals
        • Others
    • Middle East Outlook (USD Million, 2019-2030)

      • Middle East Vitamins D by Type

        • Vitamins D3
        • Vitamins D2
      • Middle East Vitamins D by Application

        • Bakery & Confectionery
        • Dairy & Frozen Desserts
        • Meat Alternatives
        • Oils & Fats
        • Sports Nutrition
        • Dairy Alternatives
        • Dietary Supplements
        • Breakfast Cereals
        • Others
      • GCC Countries Outlook (USD Million, 2019-2030)

      • GCC Countries Vitamins D by Type

        • Vitamins D3
        • Vitamins D2
      • GCC Countries Vitamins D by Application

        • Bakery & Confectionery
        • Dairy & Frozen Desserts
        • Meat Alternatives
        • Oils & Fats
        • Sports Nutrition
        • Dairy Alternatives
        • Dietary Supplements
        • Breakfast Cereals
        • Others
      • Iran Outlook (USD Million, 2019-2030)

      • Iran Vitamins D by Type

        • Vitamins D3
        • Vitamins D2
      • Iran Vitamins D by Application

        • Bakery & Confectionery
        • Dairy & Frozen Desserts
        • Meat Alternatives
        • Oils & Fats
        • Sports Nutrition
        • Dairy Alternatives
        • Dietary Supplements
        • Breakfast Cereals
        • Others
      • Rest of Middle East Outlook (USD Million, 2019-2030)

      • Rest of Middle East Vitamins D by Type

        • Vitamins D3
        • Vitamins D2
      • Rest of Middle East Vitamins D by Application

        • Bakery & Confectionery
        • Dairy & Frozen Desserts
        • Meat Alternatives
        • Oils & Fats
        • Sports Nutrition
        • Dairy Alternatives
        • Dietary Supplements
        • Breakfast Cereals
        • Others
    • Africa Outlook (USD Million, 2019-2030)

      • Africa Vitamins D by Type

        • Vitamins D3
        • Vitamins D2
      • Africa Vitamins D by Application

        • Bakery & Confectionery
        • Dairy & Frozen Desserts
        • Meat Alternatives
        • Oils & Fats
        • Sports Nutrition
        • Dairy Alternatives
        • Dietary Supplements
        • Breakfast Cereals
        • Others
      • South Africa Outlook (USD Million, 2019-2030)

      • South Africa Vitamins D by Type

        • Vitamins D3
        • Vitamins D2
      • South Africa Vitamins D by Application

        • Bakery & Confectionery
        • Dairy & Frozen Desserts
        • Meat Alternatives
        • Oils & Fats
        • Sports Nutrition
        • Dairy Alternatives
        • Dietary Supplements
        • Breakfast Cereals
        • Others
      • Egypt Outlook (USD Million, 2019-2030)

      • Egypt Vitamins D by Type

        • Vitamins D3
        • Vitamins D2
      • Egypt Vitamins D by Application

        • Bakery & Confectionery
        • Dairy & Frozen Desserts
        • Meat Alternatives
        • Oils & Fats
        • Sports Nutrition
        • Dairy Alternatives
        • Dietary Supplements
        • Breakfast Cereals
        • Others
      • Rest of Africa Outlook (USD Million, 2019-2030)

      • Rest of Africa Vitamins D by Type

        • Vitamins D3
        • Vitamins D2
      • Rest of Africa Vitamins D by Application

        • Bakery & Confectionery
        • Dairy & Frozen Desserts
        • Meat Alternatives
        • Oils & Fats
        • Sports Nutrition
        • Dairy Alternatives
        • Dietary Supplements
        • Breakfast Cereals
        • Others
    Report Infographic
    Free Sample Request

    Kindly complete the form below to receive a free sample of this Report

    Customer Strories

    “I am very pleased with how market segments have been defined in a relevant way for my purposes (such as "Portable Freezers & refrigerators" and "last-mile"). In general the report is well structured. Thanks very much for your efforts.”

    Victoria Milne Founder
    Case Study

    Chemicals and Materials