• Cat-intel
  • MedIntelliX
  • Resources
  • About Us
  • Request Free Sample ×

    Kindly complete the form below to receive a free sample of this Report

    Leading companies partner with us for data-driven Insights

    clients tt-cursor

    Non Alcoholic Beverages Market

    ID: MRFR/F-B & N/2277-HCR
    128 Pages
    Snehal Singh
    September 2025

    Non-Alcoholic Beverages Market Research Report By Product Type (Carbonated Beverages, Juices, Functional Drinks, Dairy-based Drinks, Water), By Distribution Channel (Supermarkets, Convenience Stores, Online Retail, Specialty Stores, Food Service), By Consumer Type (Adults, Children, Teenagers, Health-conscious Consumers, Athletes), By Packaging Type (Bottles, Cans, Pouches, Tetra Packs) and By Regional (North America, Europe, South America, Asia Pacific, Middle East and Africa) - Forecast to 2035

    Share:
    Download PDF ×

    We do not share your information with anyone. However, we may send you emails based on your report interest from time to time. You may contact us at any time to opt-out.

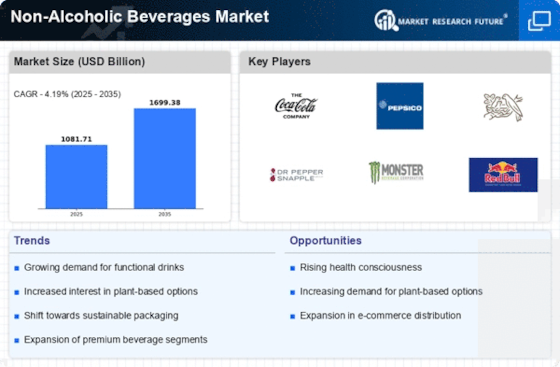
    Non Alcoholic Beverages Market Research Report-Forecast to 2035 Infographic
    Purchase Options
    $ 4,950.0
    $ 5,950.0
    $ 7,250.0
    Table of Contents

    Non Alcoholic Beverages Market Summary

    As per Market Research Future Analysis, the Global Non-Alcoholic Beverages Market was valued at 1,072.83 USD Billion in 2023 and is projected to reach 1,340.7 USD Billion by 2035, reflecting a CAGR of 1.88% from 2025 to 2035. The market is driven by increasing health awareness, a shift towards sustainable packaging, and the rise of on-the-go consumption. Major players are adapting to these trends by innovating product offerings and enhancing distribution channels.

    Key Market Trends & Highlights

    The Global Non-Alcoholic Beverages Market is influenced by several key trends.

    • Health-conscious consumers are driving demand for low-sugar and functional beverages, with the market for functional drinks expected to grow from 200.0 USD Billion in 2024 to 240.0 USD Billion by 2035.
    • Sustainable packaging initiatives are gaining traction, with companies like Coca-Cola committing to recyclable packaging by 2025.
    • On-the-go consumption is increasing, with 60% of consumers prioritizing convenience in their beverage choices.

    Market Size & Forecast

    2023 Market Size USD 1,072.83 Billion
    2024 Market Size USD 1,092.89 Billion
    2035 Market Size USD 1,340.7 Billion
    CAGR (2025-2035) 1.88%

    Major Players

    Coca Cola, PepsiCo, Nestle, Danone, Red Bull, Asahi Group Holdings, Britvic, Unilever, Keurig Dr Pepper, Monster Beverage.

    Non Alcoholic Beverages Market Trends

    The Non-Alcoholic Beverages Market is witnessing significant growth driven by several key market drivers. A notable driver is the rising health consciousness among consumers, which is leading to an increased demand for beverages that are low in sugar or free from artificial ingredients.

    Additionally, the trend toward plant-based and organic products continues to shape the market. As more consumers seek natural options, brands are responding by incorporating functional ingredients that offer health benefits, such as vitamins, minerals, and probiotics.

    Opportunities in the global market are centered around innovation and diversification of product offerings.

    Brands have a chance to reach more people because functional drinks, like energy drinks and enhanced waters, are becoming more popular. Online stores are also becoming more and more important for reaching customers, especially younger ones who like to shop online.

    This change gives brands the chance to try out new ways to market themselves and get more people interested in what they have to offer.

    There has also been a rise in eco-friendly packaging in recent years, as many people now care about being environmentally friendly. Brands that use eco-friendly methods not only attract eco-conscious customers, but they also help cut down on waste.

    Moreover, the rise of convenience-based products, such as ready-to-drink options, aligns with the fast-paced lifestyles of consumers globally.

    The combined impact of these trends reflects a dynamic shift within the Non-Alcoholic Beverages Market, providing a compelling landscape for growth and adaptation.

    The Global Non-Alcoholic Beverages Market demonstrates a robust trajectory, driven by evolving consumer preferences towards healthier options and innovative product offerings.

    U.S. Department of Agriculture

    Non Alcoholic Beverages Market Drivers

    Cultural Shifts

    Cultural shifts towards socializing without alcohol are influencing the Global Non-Alcoholic Beverages Market Industry. As more individuals seek non-alcoholic options for social gatherings, the demand for sophisticated non-alcoholic beverages is on the rise. This trend is particularly evident among younger consumers who prioritize wellness and inclusivity in their social experiences. The market is responding with innovative products that mimic the taste and experience of traditional alcoholic beverages, thereby appealing to this demographic. Such cultural changes may contribute to sustained growth in the market, as brands adapt to meet evolving consumer preferences.

    E-commerce Growth

    The rapid expansion of e-commerce platforms is reshaping the Global Non-Alcoholic Beverages Market Industry. Online shopping provides consumers with greater convenience and access to a wider range of products. This trend is particularly relevant as more consumers turn to digital channels for their beverage purchases. The ease of online ordering and home delivery services is likely to drive sales growth, as evidenced by the increasing number of beverage brands establishing a strong online presence. This shift not only enhances consumer accessibility but also allows for targeted marketing strategies, which could further stimulate market growth.

    Health Consciousness

    The increasing awareness of health and wellness among consumers appears to be a primary driver for the Global Non-Alcoholic Beverages Market Industry. As individuals seek healthier alternatives to sugary drinks, there is a noticeable shift towards beverages that offer functional benefits, such as enhanced hydration and nutritional value. This trend is reflected in the growing demand for low-calorie, organic, and fortified beverages. For instance, the market is projected to reach 1092.9 USD Billion in 2024, indicating a robust consumer preference for healthier options. This shift not only influences product development but also encourages brands to innovate in the non-alcoholic segment.

    Sustainability Trends

    Sustainability has emerged as a crucial factor influencing the Global Non-Alcoholic Beverages Market Industry. Consumers are increasingly favoring brands that demonstrate environmental responsibility, leading to a rise in demand for eco-friendly packaging and sustainable sourcing of ingredients. Companies are responding by adopting practices that minimize their carbon footprint and promote recycling. This trend is evident as brands strive to align with consumer values, potentially enhancing brand loyalty. As the market evolves, sustainability initiatives may play a pivotal role in shaping consumer choices, thereby impacting overall market dynamics.

    Diverse Product Offerings

    The Global Non-Alcoholic Beverages Market Industry is characterized by an expanding array of product offerings, which caters to diverse consumer preferences. From flavored waters to plant-based drinks, the variety available has significantly broadened, appealing to different demographics. For example, the rise of functional beverages, including those infused with vitamins and minerals, has gained traction among health-conscious consumers. This diversification is likely to contribute to the market's growth, with projections suggesting an increase to 1340.7 USD Billion by 2035. Companies are continuously exploring new flavors and formulations, thereby enhancing consumer engagement and driving sales.

    Market Growth Projections

    The Global Non-Alcoholic Beverages Market Industry is projected to experience steady growth over the coming years. With a compound annual growth rate (CAGR) of 1.88% anticipated from 2025 to 2035, the market is expected to evolve significantly. This growth trajectory suggests a sustained interest in non-alcoholic options, driven by various factors such as health consciousness and product innovation. The market's value is set to increase from 1092.9 USD Billion in 2024 to 1340.7 USD Billion by 2035, indicating a robust expansion that reflects changing consumer preferences and market dynamics.

    Market Segment Insights

    Non-Alcoholic Beverages Market Product Type Insights

    The Non-Alcoholic Beverages Market revenue is experiencing a notable transformation across various product types, demonstrating a robust segmentation that caters to diverse consumer preferences.

    In 2024, the overall market is expected to achieve a significant valuation of 1092.89 USD billion, with various product categories contributing to this growth.

    The Carbonated Beverages segment leads the market with an impressive value of 350.0 USD Billion in 2024, showcasing its dominance in consumer preferences for fizzy drinks and soft drinks.

    This segment remains significant due to its wide appeal and versatility, capturing a substantial share of the market.

    Following closely is the Juices segment, valued at 180.0 USD billion in 2024, which reflects the growing trend towards healthier beverage choices among consumers.

    Non-Alcoholic Beverages Market Distribution Channel Insights

    The Distribution Channel segment of the Non-Alcoholic Beverages Market plays a crucial role in shaping market dynamics, with the overall market projected to reach a value of 1092.89 USD billion by 2024.

    Within this segment, various channels such as Supermarkets, Convenience Stores, Online Retail, Specialty Stores, and Food Service exhibit distinctive characteristics and consumer preferences.

    Supermarkets often dominate this space due to their wide variety of products and one-stop shopping experience, making them a popular choice for bulk buyers.Convenience Stores cater to on-the-go consumers seeking quick access to beverages, while Online Retail is rapidly growing, driven by the increasing prevalence of e-commerce and consumer preference for home delivery services.

    Specialty Stores offer niche products and cater to specific customer needs, standing out with curated selections. Food Service channels, including cafes and restaurants, also significantly contribute to market revenue by providing ready-to-consume beverages.

    Together, these channels address varied consumer demands and preferences, significantly impacting the Non-Alcoholic Beverages Market Statistics by enhancing accessibility and convenience for consumers across the globe.Effective distribution strategies are essential for brands to leverage growth opportunities and maintain competitiveness in this expansive market.

    Non-Alcoholic Beverages Market Consumer Type Insights

    The Non-Alcoholic Beverages Market is witnessing diverse consumption patterns across various consumer segments such as Adults, Children, Teenagers, Health-conscious Consumers, and Athletes, reflecting varying preferences and lifestyle choices.

    In 2024, the overall market is expected to be valued at approximately 1092.89 USD billion. Adults significantly dominate this segment, focusing on beverages that cater to convenience and flavor.

    Children and Teenagers increasingly favor carbonated drinks and juices, yet there is a growing trend toward healthier options, influenced by health-conscious parents and societal shifts.Health-conscious Consumers are seeking beverages with low sugar and high nutritional value, contributing to the rise of functional drinks. On the other hand, Athletes are driving demand for electrolyte-rich and energizing drinks, enhancing performance and recovery.

    Factors such as urbanization, changing lifestyles, and the growing awareness of health and wellness are driving market growth.

     However, challenges like fluctuating ingredient prices and the need for sustainable packaging present obstacles in catering to the diverse preferences across these consumer types.Overall, the market is evolving, with increasing attention to health and wellness shaping the future landscape of the Non-Alcoholic Beverages Market.

    Non-Alcoholic Beverages Market Packaging Type Insights

    The Non-Alcoholic Beverages Market has been categorized into various Packaging Types, notably including Bottles, Cans, Pouches, and Tetra Packs.

     As of 2024, the market is projected to reach a valuation of 1,092.89 billion USD, reflecting a growing trend towards sustainable and convenient packaging solutions.

    Bottles are a preferred choice for many consumers due to their reusability and ability to preserve flavor, while Cans are gaining traction for their portability and recyclability, appealing to on-the-go lifestyles.

    Pouches, known for their lightweight and space-saving attributes, have become popular in the juice and smoothie segments.Tetra Packs, celebrated for their aseptic properties, ensure extended shelf life, particularly for dairy and juice products.

    The ongoing demand for environmentally friendly packaging is expected to drive innovation within these segments, presenting opportunities for manufacturers to invest in research and development.

    Get more detailed insights about Non Alcoholic Beverages Market Research Report-Forecast to 2035

    Regional Insights

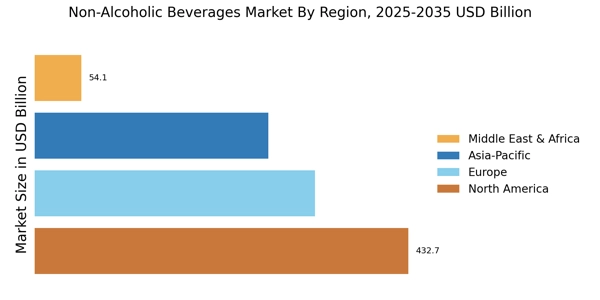
    The Non-Alcoholic Beverages Market showcases a diverse range of regional dynamics, with North America and Europe holding major market shares. In 2024, North America is valued at 350.0 USD billion, making it a dominant player due to its advanced retail infrastructure and high consumer demand for health-oriented beverages.

    Europe follows closely with a valuation of 300.0 USD billion, driven by a growing preference for low-calorie and organic products.

    Meanwhile, Asia Pacific, valued at 270.0 USD billion, is witnessing rapid growth propelled by changing lifestyle trends and an expanding middle class.

    South America, with a market value of 100.0 USD billion, is significant for its unique flavors and local beverages, while the Middle East and Africa, valued at 72.89 USD billion, are experiencing growth due to increasing urbanization and rising disposable incomes.

    Each region presents distinct opportunities, from the health-conscious consumers in North America to the emerging markets in Asia Pacific, emphasizing the diverse landscape within the Non-Alcoholic Beverages Market revenue.

    With rising awareness about health and wellness globally, coupled with innovative product offerings, the market is poised for steady growth in various segments.

    Non-Alcoholic Beverages Market Regional Insights

    Source: Primary Research, Secondary Research, Market Research Future Database, and Analyst Review

    Key Players and Competitive Insights

    The Non-Alcoholic Beverages Market is a highly dynamic and competitive arena characterized by rapid innovation and evolving consumer preferences.

    This sector encompasses a wide range of products, including soft drinks, bottled waters, juices, teas, and energy drinks, all competing for market share.

     Growing health awareness and shifts towards healthier beverage options are reshaping the landscape, prompting companies to innovate and diversify their offerings.

    The market is influenced by numerous factors, including shifting demographics, changing lifestyles, and increasing demand for convenient and on-the-go options.

     As the competition heats up, brand loyalty and effective marketing strategies become pivotal for companies striving to maintain or grow their presence in this global marketplace.

    Britvic has established itself as a key player within the Non-Alcoholic Beverages Market by focusing on innovation, sustainability, and premiumization strategies.

    The company is particularly recognized for its wide array of products that cater to health-conscious consumers, including low-sugar and no-sugar beverages.

    Britvic's ability to adapt to changing market trends and consumer preferences serves as one of its notable strengths, along with a strong emphasis on marketing and promotional strategies that resonate with target demographics.

    The company effectively utilizes consumer insights to enhance product development, ensuring that its offerings remain relevant in a competitive landscape. Additionally, Britvic's commitment to sustainability and environmental responsibility bolsters its brand reputation and appeal in a market increasingly driven by eco-conscious choices.

    PepsiCo stands out in the Non-Alcoholic Beverages Market with its expansive portfolio of well-known brands and innovative product offerings.

    The company is renowned for key products such as carbonated soft drinks, juices, bottled water, and energy beverages, which cater to diverse consumer preferences across various demographics.

    PepsiCo's strengths lie in its extensive distribution network and strong global presence, enabling it to reach consumers worldwide effectively.

    The company's commitment to innovation is reflected in its continuous investment in research and development, resulting in the introduction of new flavors and health-focused beverage options.

    Furthermore, PepsiCo has made significant strides in strategic mergers and acquisitions, enhancing its market position and expanding its product range.

    This adaptability and forward-thinking approach have solidified PepsiCo's status as a leader in the global non-alcoholic beverage segment, allowing it to respond robustly to market changes and consumer demands.

    Key Companies in the Non Alcoholic Beverages Market market include

    Industry Developments

    There have been big changes in the Non-Alcoholic Beverages Market lately, especially among major players like PepsiCo, Coca-Cola, and Unilever. PepsiCo said in September 2023 that it had bought a startup that makes health-focused drinks.

    This added to the company's wellness product line. At the same time, Coca-Cola kept up its plan to offer more drinks with little or no sugar, like new flavors of Coke Zero Sugar and Vitaminwater. This is because more and more people are looking for healthier options.

    In August 2023, Unilever teamed up with a plant-based drink company to offer more non-alcoholic drinks in Europe.

    As part of their larger ESG efforts, Nestlé and Kraft Heinz also said that more people were paying attention to sustainable packaging and new organic products through the end of 2023. In the last two years, the market has seen a huge increase in demand for functional drinks like kombucha, probiotic drinks, and ready-to-drink wellness teas.

    Brands like KeVita (a PepsiCo brand) and Vitaminwater (a Coca-Cola brand) have come up with new products that focus on immunity, hydration, and energy. These products have become popular in small groups of health-conscious people.

    These changes show that the industry is clearly moving toward health, sustainability, and new products. To stay competitive in a constantly changing global market, companies are putting a lot of money into research and development and adapting their supply chains.

    Future Outlook

    Non Alcoholic Beverages Market Future Outlook

    The Global Non-Alcoholic Beverages Market is projected to grow at 1.88% CAGR from 2024 to 2035, driven by health trends, innovation, and sustainability initiatives.

    New opportunities lie in:

    • Develop functional beverages targeting health-conscious consumers.
    • Leverage e-commerce platforms for direct-to-consumer sales.
    • Invest in sustainable packaging solutions to enhance brand loyalty.

    By 2035, the market is expected to exhibit robust growth, reflecting evolving consumer preferences and innovative product offerings.

    Market Segmentation

    Non-Alcoholic Beverages Market Regional Outlook

    • North America
    • Europe
    • South America
    • Asia Pacific
    • Middle East and Africa

    Non-Alcoholic Beverages Market Product Type Outlook

    • Carbonated Beverages
    • Juices
    • Functional Drinks
    • Dairy-based Drinks
    • Water

    Non-Alcoholic Beverages Market Consumer Type Outlook

    • Adults
    • Children
    • Teenagers
    • Health-conscious Consumers
    • Athletes

    Non-Alcoholic Beverages Market Packaging Type Outlook

    • Bottles
    • Cans
    • Pouches
    • Tetra Packs

    Non-Alcoholic Beverages Market Distribution Channel Outlook

    • Supermarkets
    • Convenience Stores
    • Online Retail
    • Specialty Stores
    • Food Service

    Report Scope

    Report Attribute/Metric Details
    Market Size 2023 1072.83 (USD Billion)
    Market Size 2024 1092.89 (USD Billion)
    Market Size 2035 1340.7 (USD Billion)
    Compound Annual Growth Rate (CAGR) 1.88% (2025 - 2035)
    Report Coverage Revenue Forecast, Competitive Landscape, Growth Factors, and Trends
    Base Year 2024
    Market Forecast Period 2025 - 2035
    Historical Data 2019 - 2024
    Market Forecast Units USD Billion
    Key Companies Profiled Britvic, PepsiCo, Unilever, Red Bull, Mondelez International, Danone, Coca-Cola, KeVita, Dr Pepper Snapple Group, Nestlé, Tropicana, Kraft Heinz
    Segments Covered Product Type, Distribution Channel, Consumer Type, Packaging Type, Regional
    Key Market Opportunities Health-conscious consumer trends, Innovative flavors and formulations, Sustainable packaging solutions, Expansion of plant-based beverages, Growth in on-the-go options
    Key Market Dynamics Health-conscious consumer preferences, Growing demand for sustainability, Rise of plant-based beverages, Innovations in flavor and packaging, Expansion of distribution channels
    Countries Covered North America, Europe, APAC, South America, MEA

    Market Highlights

    Author
    Snehal Singh
    Assistant Manager - Research

    High acumen in analyzing complex macro & micro markets with more than 6 years of work experience in the field of market research. By implementing her analytical skills in forecasting and estimation into market research reports, she has expertise in Packaging, Construction, and Equipment domains. She handles a team size of 20-25 resources and ensures smooth running of the projects, associated marketing activities, and client servicing.

    Leave a Comment

    FAQs

    What is the expected market size of the Non-Alcoholic Beverages Market in 2024?

    The Non-Alcoholic Beverages Market is expected to be valued at 1092.89 USD billion in 2024.

    What is the projected market size for the Non-Alcoholic Beverages Market by 2035?

    By 2035, the Non-Alcoholic Beverages Market is projected to reach a value of 1340.7 USD Billion.

    What is the expected compound annual growth rate (CAGR) for the Non-Alcoholic Beverages Market from 2025 to 2035?

    The estimated CAGR for the Non-Alcoholic Beverages Market from 2025 to 2035 is 1.88%.

    Which product type segment will dominate the Non-Alcoholic Beverages Market by 2035?

    By 2035, the Carbonated Beverages segment is expected to be valued at 440.0 USD billion, making it the dominant product type.

    How is the Non-Alcoholic Beverages Market segmented by region for 2024?

    In 2024, the North America segment is valued at 350.0 USD billion, leading the market among regions.

    Which major players are leading the Non-Alcoholic Beverages Market?

    Key players in the market include PepsiCo, Coca-Cola, Nestlé, Unilever, and Danone, among others.

    What is the market size of the Juices segment in 2024?

    The Juices segment of the Non-Alcoholic Beverages Market is valued at 180.0 USD billion in 2024.

    What growth opportunities are present in the Non-Alcoholic Beverages Market?

    Emerging consumer preferences for healthy options and innovative flavors present growth opportunities in the market.

    What is the expected market value for the Water segment in 2035?

    The Water segment is projected to reach a value of 290.7 USD billion by 2035.

    How is the Functional Drinks segment expected to perform by 2035?

    The Functional Drinks segment is projected to rise to 160.0 USD billion by 2035, indicating significant growth.

    1. EXECUTIVE
    2. SUMMARY
    3. Market Overview
    4. Key Findings
    5. Market Segmentation
    6. Competitive Landscape
    7. Challenges and Opportunities
    8. Future Outlook
    9. MARKET INTRODUCTION
    10. Definition
    11. Scope of the study
    12. Research Objective
    13. Assumption
    14. Limitations
    15. RESEARCH
    16. METHODOLOGY
    17. Overview
    18. Data
    19. Mining
    20. Secondary Research
    21. Primary
    22. Research
    23. Primary Interviews and Information Gathering
    24. Process
    25. Breakdown of Primary Respondents
    26. Forecasting
    27. Model
    28. Market Size Estimation
    29. Bottom-Up
    30. Approach
    31. Top-Down Approach
    32. Data
    33. Triangulation
    34. Validation
    35. MARKET
    36. DYNAMICS
    37. Overview
    38. Drivers
    39. Restraints
    40. Opportunities
    41. MARKET FACTOR ANALYSIS
    42. Value chain Analysis
    43. Porter's
    44. Five Forces Analysis
    45. Bargaining Power of Suppliers
    46. Bargaining
    47. Power of Buyers
    48. Threat of New Entrants
    49. Threat
    50. of Substitutes
    51. Intensity of Rivalry
    52. COVID-19
    53. Impact Analysis
    54. Market Impact Analysis
    55. Regional
    56. Impact
    57. Opportunity and Threat Analysis
    58. Non-Alcoholic
    59. Beverages Market, BY Product Type (USD Billion)
    60. Carbonated
    61. Beverages
    62. Juices
    63. Functional
    64. Drinks
    65. Dairy-based Drinks
    66. Water
    67. Non-Alcoholic
    68. Beverages Market, BY Distribution Channel (USD Billion)
    69. Supermarkets
    70. Convenience
    71. Stores
    72. Online Retail
    73. Specialty
    74. Stores
    75. Food Service
    76. Non-Alcoholic
    77. Beverages Market, BY Consumer Type (USD Billion)
    78. Adults
    79. Children
    80. Teenagers
    81. Health-conscious
    82. Consumers
    83. Athletes
    84. Non-Alcoholic
    85. Beverages Market, BY Packaging Type (USD Billion)
    86. Bottles
    87. Cans
    88. Pouches
    89. Tetra
    90. Packs
    91. Non-Alcoholic Beverages
    92. Market, BY Regional (USD Billion)
    93. North America
    94. US
    95. Canada
    96. Europe
    97. Germany
    98. UK
    99. France
    100. Russia
    101. Italy
    102. Spain
    103. Rest
    104. of Europe
    105. APAC
    106. China
    107. India
    108. Japan
    109. South
    110. Korea
    111. Malaysia
    112. Thailand
    113. Indonesia
    114. Rest
    115. of APAC
    116. South America
    117. Brazil
    118. Mexico
    119. Argentina
    120. Rest
    121. of South America
    122. MEA
    123. GCC
    124. Countries
    125. South Africa
    126. Rest
    127. of MEA
    128. Competitive Landscape
    129. Overview
    130. Competitive
    131. Analysis
    132. Market share Analysis
    133. Major
    134. Growth Strategy in the Non-Alcoholic Beverages Market
    135. Competitive
    136. Benchmarking
    137. Leading Players in Terms of Number of Developments
    138. in the Non-Alcoholic Beverages Market
    139. Key developments
    140. and growth strategies
    141. New Product Launch/Service Deployment
    142. Merger
    143. & Acquisitions
    144. Joint Ventures
    145. Major
    146. Players Financial Matrix
    147. Sales and Operating Income
    148. Major
    149. Players R&D Expenditure. 2023
    150. Company
    151. Profiles
    152. Coca Cola
    153. Financial
    154. Overview
    155. Products Offered
    156. Key
    157. Developments
    158. SWOT Analysis
    159. Key
    160. Strategies
    161. Danone
    162. Financial
    163. Overview
    164. Products Offered
    165. Key
    166. Developments
    167. SWOT Analysis
    168. Key
    169. Strategies
    170. Britvic
    171. Financial
    172. Overview
    173. Products Offered
    174. Key
    175. Developments
    176. SWOT Analysis
    177. Key
    178. Strategies
    179. Pernod Ricard
    180. Financial
    181. Overview
    182. Products Offered
    183. Key
    184. Developments
    185. SWOT Analysis
    186. Key
    187. Strategies
    188. Unilever
    189. Financial
    190. Overview
    191. Products Offered
    192. Key
    193. Developments
    194. SWOT Analysis
    195. Key
    196. Strategies
    197. Asahi Group Holdings
    198. Financial
    199. Overview
    200. Products Offered
    201. Key
    202. Developments
    203. SWOT Analysis
    204. Key
    205. Strategies
    206. Suntory Holdings
    207. Financial
    208. Overview
    209. Products Offered
    210. Key
    211. Developments
    212. SWOT Analysis
    213. Key
    214. Strategies
    215. Nestle
    216. Financial
    217. Overview
    218. Products Offered
    219. Key
    220. Developments
    221. SWOT Analysis
    222. Key
    223. Strategies
    224. PepsiCo
    225. Financial
    226. Overview
    227. Products Offered
    228. Key
    229. Developments
    230. SWOT Analysis
    231. Key
    232. Strategies
    233. Red Bull
    234. Financial
    235. Overview
    236. Products Offered
    237. Key
    238. Developments
    239. SWOT Analysis
    240. Key
    241. Strategies
    242. Constellation Brands
    243. Financial
    244. Overview
    245. Products Offered
    246. Key
    247. Developments
    248. SWOT Analysis
    249. Key
    250. Strategies
    251. Keurig Dr Pepper
    252. Financial
    253. Overview
    254. Products Offered
    255. Key
    256. Developments
    257. SWOT Analysis
    258. Key
    259. Strategies
    260. Monster Beverage
    261. Financial
    262. Overview
    263. Products Offered
    264. Key
    265. Developments
    266. SWOT Analysis
    267. Key
    268. Strategies
    269. Cott Corporation
    270. Financial
    271. Overview
    272. Products Offered
    273. Key
    274. Developments
    275. SWOT Analysis
    276. Key
    277. Strategies
    278. Dr Pepper Snapple Group
    279. Financial
    280. Overview
    281. Products Offered
    282. Key
    283. Developments
    284. SWOT Analysis
    285. Key
    286. Strategies
    287. References
    288. Related
    289. Reports
    290. LIST
    291. OF ASSUMPTIONS
    292. North America Non-Alcoholic Beverages
    293. Market SIZE ESTIMATES & FORECAST, BY PRODUCT TYPE, 2019-2035 (USD Billions)
    294. North
    295. America Non-Alcoholic Beverages Market SIZE ESTIMATES & FORECAST, BY DISTRIBUTION
    296. CHANNEL, 2019-2035 (USD Billions)
    297. North America Non-Alcoholic
    298. Beverages Market SIZE ESTIMATES & FORECAST, BY CONSUMER TYPE, 2019-2035 (USD
    299. Billions)
    300. North America Non-Alcoholic Beverages Market
    301. SIZE ESTIMATES & FORECAST, BY PACKAGING TYPE, 2019-2035 (USD Billions)
    302. North
    303. America Non-Alcoholic Beverages Market SIZE ESTIMATES & FORECAST, BY REGIONAL,
    304. 2035 (USD Billions)
    305. US Non-Alcoholic Beverages Market
    306. SIZE ESTIMATES & FORECAST, BY PRODUCT TYPE, 2019-2035 (USD Billions)
    307. US
    308. Non-Alcoholic Beverages Market SIZE ESTIMATES & FORECAST, BY DISTRIBUTION CHANNEL,
    309. 2035 (USD Billions)
    310. US Non-Alcoholic Beverages Market
    311. SIZE ESTIMATES & FORECAST, BY CONSUMER TYPE, 2019-2035 (USD Billions)
    312. US
    313. Non-Alcoholic Beverages Market SIZE ESTIMATES & FORECAST, BY PACKAGING TYPE,
    314. 2035 (USD Billions)
    315. US Non-Alcoholic Beverages Market
    316. SIZE ESTIMATES & FORECAST, BY REGIONAL, 2019-2035 (USD Billions)
    317. Canada
    318. Non-Alcoholic Beverages Market SIZE ESTIMATES & FORECAST, BY PRODUCT TYPE, 2019-2035
    319. (USD Billions)
    320. Canada Non-Alcoholic Beverages Market
    321. SIZE ESTIMATES & FORECAST, BY DISTRIBUTION CHANNEL, 2019-2035 (USD Billions)
    322. Canada
    323. Non-Alcoholic Beverages Market SIZE ESTIMATES & FORECAST, BY CONSUMER TYPE,
    324. 2035 (USD Billions)
    325. Canada Non-Alcoholic Beverages
    326. Market SIZE ESTIMATES & FORECAST, BY PACKAGING TYPE, 2019-2035 (USD Billions)
    327. Canada
    328. Non-Alcoholic Beverages Market SIZE ESTIMATES & FORECAST, BY REGIONAL, 2019-2035
    329. (USD Billions)
    330. Europe Non-Alcoholic Beverages Market
    331. SIZE ESTIMATES & FORECAST, BY PRODUCT TYPE, 2019-2035 (USD Billions)
    332. Europe
    333. Non-Alcoholic Beverages Market SIZE ESTIMATES & FORECAST, BY DISTRIBUTION CHANNEL,
    334. 2035 (USD Billions)
    335. Europe Non-Alcoholic Beverages
    336. Market SIZE ESTIMATES & FORECAST, BY CONSUMER TYPE, 2019-2035 (USD Billions)
    337. Europe
    338. Non-Alcoholic Beverages Market SIZE ESTIMATES & FORECAST, BY PACKAGING TYPE,
    339. 2035 (USD Billions)
    340. Europe Non-Alcoholic Beverages
    341. Market SIZE ESTIMATES & FORECAST, BY REGIONAL, 2019-2035 (USD Billions)
    342. Germany
    343. Non-Alcoholic Beverages Market SIZE ESTIMATES & FORECAST, BY PRODUCT TYPE, 2019-2035
    344. (USD Billions)
    345. Germany Non-Alcoholic Beverages Market
    346. SIZE ESTIMATES & FORECAST, BY DISTRIBUTION CHANNEL, 2019-2035 (USD Billions)
    347. Germany
    348. Non-Alcoholic Beverages Market SIZE ESTIMATES & FORECAST, BY CONSUMER TYPE,
    349. 2035 (USD Billions)
    350. Germany Non-Alcoholic Beverages
    351. Market SIZE ESTIMATES & FORECAST, BY PACKAGING TYPE, 2019-2035 (USD Billions)
    352. Germany
    353. Non-Alcoholic Beverages Market SIZE ESTIMATES & FORECAST, BY REGIONAL, 2019-2035
    354. (USD Billions)
    355. UK Non-Alcoholic Beverages Market SIZE
    356. ESTIMATES & FORECAST, BY PRODUCT TYPE, 2019-2035 (USD Billions)
    357. UK
    358. Non-Alcoholic Beverages Market SIZE ESTIMATES & FORECAST, BY DISTRIBUTION CHANNEL,
    359. 2035 (USD Billions)
    360. UK Non-Alcoholic Beverages Market
    361. SIZE ESTIMATES & FORECAST, BY CONSUMER TYPE, 2019-2035 (USD Billions)
    362. UK
    363. Non-Alcoholic Beverages Market SIZE ESTIMATES & FORECAST, BY PACKAGING TYPE,
    364. 2035 (USD Billions)
    365. UK Non-Alcoholic Beverages Market
    366. SIZE ESTIMATES & FORECAST, BY REGIONAL, 2019-2035 (USD Billions)
    367. France
    368. Non-Alcoholic Beverages Market SIZE ESTIMATES & FORECAST, BY PRODUCT TYPE, 2019-2035
    369. (USD Billions)
    370. France Non-Alcoholic Beverages Market
    371. SIZE ESTIMATES & FORECAST, BY DISTRIBUTION CHANNEL, 2019-2035 (USD Billions)
    372. France
    373. Non-Alcoholic Beverages Market SIZE ESTIMATES & FORECAST, BY CONSUMER TYPE,
    374. 2035 (USD Billions)
    375. France Non-Alcoholic Beverages
    376. Market SIZE ESTIMATES & FORECAST, BY PACKAGING TYPE, 2019-2035 (USD Billions)
    377. France
    378. Non-Alcoholic Beverages Market SIZE ESTIMATES & FORECAST, BY REGIONAL, 2019-2035
    379. (USD Billions)
    380. Russia Non-Alcoholic Beverages Market
    381. SIZE ESTIMATES & FORECAST, BY PRODUCT TYPE, 2019-2035 (USD Billions)
    382. Russia
    383. Non-Alcoholic Beverages Market SIZE ESTIMATES & FORECAST, BY DISTRIBUTION CHANNEL,
    384. 2035 (USD Billions)
    385. Russia Non-Alcoholic Beverages
    386. Market SIZE ESTIMATES & FORECAST, BY CONSUMER TYPE, 2019-2035 (USD Billions)
    387. Russia
    388. Non-Alcoholic Beverages Market SIZE ESTIMATES & FORECAST, BY PACKAGING TYPE,
    389. 2035 (USD Billions)
    390. Russia Non-Alcoholic Beverages
    391. Market SIZE ESTIMATES & FORECAST, BY REGIONAL, 2019-2035 (USD Billions)
    392. Italy
    393. Non-Alcoholic Beverages Market SIZE ESTIMATES & FORECAST, BY PRODUCT TYPE, 2019-2035
    394. (USD Billions)
    395. Italy Non-Alcoholic Beverages Market SIZE
    396. ESTIMATES & FORECAST, BY DISTRIBUTION CHANNEL, 2019-2035 (USD Billions)
    397. Italy
    398. Non-Alcoholic Beverages Market SIZE ESTIMATES & FORECAST, BY CONSUMER TYPE,
    399. 2035 (USD Billions)
    400. Italy Non-Alcoholic Beverages
    401. Market SIZE ESTIMATES & FORECAST, BY PACKAGING TYPE, 2019-2035 (USD Billions)
    402. Italy
    403. Non-Alcoholic Beverages Market SIZE ESTIMATES & FORECAST, BY REGIONAL, 2019-2035
    404. (USD Billions)
    405. Spain Non-Alcoholic Beverages Market SIZE
    406. ESTIMATES & FORECAST, BY PRODUCT TYPE, 2019-2035 (USD Billions)
    407. Spain
    408. Non-Alcoholic Beverages Market SIZE ESTIMATES & FORECAST, BY DISTRIBUTION CHANNEL,
    409. 2035 (USD Billions)
    410. Spain Non-Alcoholic Beverages
    411. Market SIZE ESTIMATES & FORECAST, BY CONSUMER TYPE, 2019-2035 (USD Billions)
    412. Spain
    413. Non-Alcoholic Beverages Market SIZE ESTIMATES & FORECAST, BY PACKAGING TYPE,
    414. 2035 (USD Billions)
    415. Spain Non-Alcoholic Beverages
    416. Market SIZE ESTIMATES & FORECAST, BY REGIONAL, 2019-2035 (USD Billions)
    417. Rest
    418. of Europe Non-Alcoholic Beverages Market SIZE ESTIMATES & FORECAST, BY PRODUCT
    419. TYPE, 2019-2035 (USD Billions)
    420. Rest of Europe Non-Alcoholic
    421. Beverages Market SIZE ESTIMATES & FORECAST, BY DISTRIBUTION CHANNEL, 2019-2035
    422. (USD Billions)
    423. Rest of Europe Non-Alcoholic Beverages
    424. Market SIZE ESTIMATES & FORECAST, BY CONSUMER TYPE, 2019-2035 (USD Billions)
    425. Rest
    426. of Europe Non-Alcoholic Beverages Market SIZE ESTIMATES & FORECAST, BY PACKAGING
    427. TYPE, 2019-2035 (USD Billions)
    428. Rest of Europe Non-Alcoholic
    429. Beverages Market SIZE ESTIMATES & FORECAST, BY REGIONAL, 2019-2035 (USD Billions)
    430. APAC
    431. Non-Alcoholic Beverages Market SIZE ESTIMATES & FORECAST, BY PRODUCT TYPE, 2019-2035
    432. (USD Billions)
    433. APAC Non-Alcoholic Beverages Market SIZE
    434. ESTIMATES & FORECAST, BY DISTRIBUTION CHANNEL, 2019-2035 (USD Billions)
    435. APAC
    436. Non-Alcoholic Beverages Market SIZE ESTIMATES & FORECAST, BY CONSUMER TYPE,
    437. 2035 (USD Billions)
    438. APAC Non-Alcoholic Beverages
    439. Market SIZE ESTIMATES & FORECAST, BY PACKAGING TYPE, 2019-2035 (USD Billions)
    440. APAC
    441. Non-Alcoholic Beverages Market SIZE ESTIMATES & FORECAST, BY REGIONAL, 2019-2035
    442. (USD Billions)
    443. China Non-Alcoholic Beverages Market SIZE
    444. ESTIMATES & FORECAST, BY PRODUCT TYPE, 2019-2035 (USD Billions)
    445. China
    446. Non-Alcoholic Beverages Market SIZE ESTIMATES & FORECAST, BY DISTRIBUTION CHANNEL,
    447. 2035 (USD Billions)
    448. China Non-Alcoholic Beverages
    449. Market SIZE ESTIMATES & FORECAST, BY CONSUMER TYPE, 2019-2035 (USD Billions)
    450. China
    451. Non-Alcoholic Beverages Market SIZE ESTIMATES & FORECAST, BY PACKAGING TYPE,
    452. 2035 (USD Billions)
    453. China Non-Alcoholic Beverages
    454. Market SIZE ESTIMATES & FORECAST, BY REGIONAL, 2019-2035 (USD Billions)
    455. India
    456. Non-Alcoholic Beverages Market SIZE ESTIMATES & FORECAST, BY PRODUCT TYPE, 2019-2035
    457. (USD Billions)
    458. India Non-Alcoholic Beverages Market SIZE
    459. ESTIMATES & FORECAST, BY DISTRIBUTION CHANNEL, 2019-2035 (USD Billions)
    460. India
    461. Non-Alcoholic Beverages Market SIZE ESTIMATES & FORECAST, BY CONSUMER TYPE,
    462. 2035 (USD Billions)
    463. India Non-Alcoholic Beverages
    464. Market SIZE ESTIMATES & FORECAST, BY PACKAGING TYPE, 2019-2035 (USD Billions)
    465. India
    466. Non-Alcoholic Beverages Market SIZE ESTIMATES & FORECAST, BY REGIONAL, 2019-2035
    467. (USD Billions)
    468. Japan Non-Alcoholic Beverages Market SIZE
    469. ESTIMATES & FORECAST, BY PRODUCT TYPE, 2019-2035 (USD Billions)
    470. Japan
    471. Non-Alcoholic Beverages Market SIZE ESTIMATES & FORECAST, BY DISTRIBUTION CHANNEL,
    472. 2035 (USD Billions)
    473. Japan Non-Alcoholic Beverages
    474. Market SIZE ESTIMATES & FORECAST, BY CONSUMER TYPE, 2019-2035 (USD Billions)
    475. Japan
    476. Non-Alcoholic Beverages Market SIZE ESTIMATES & FORECAST, BY PACKAGING TYPE,
    477. 2035 (USD Billions)
    478. Japan Non-Alcoholic Beverages
    479. Market SIZE ESTIMATES & FORECAST, BY REGIONAL, 2019-2035 (USD Billions)
    480. South
    481. Korea Non-Alcoholic Beverages Market SIZE ESTIMATES & FORECAST, BY PRODUCT TYPE,
    482. 2035 (USD Billions)
    483. South Korea Non-Alcoholic Beverages
    484. Market SIZE ESTIMATES & FORECAST, BY DISTRIBUTION CHANNEL, 2019-2035 (USD Billions)
    485. South
    486. Korea Non-Alcoholic Beverages Market SIZE ESTIMATES & FORECAST, BY CONSUMER
    487. TYPE, 2019-2035 (USD Billions)
    488. South Korea Non-Alcoholic
    489. Beverages Market SIZE ESTIMATES & FORECAST, BY PACKAGING TYPE, 2019-2035 (USD
    490. Billions)
    491. South Korea Non-Alcoholic Beverages Market
    492. SIZE ESTIMATES & FORECAST, BY REGIONAL, 2019-2035 (USD Billions)
    493. Malaysia
    494. Non-Alcoholic Beverages Market SIZE ESTIMATES & FORECAST, BY PRODUCT TYPE, 2019-2035
    495. (USD Billions)
    496. Malaysia Non-Alcoholic Beverages Market
    497. SIZE ESTIMATES & FORECAST, BY DISTRIBUTION CHANNEL, 2019-2035 (USD Billions)
    498. Malaysia
    499. Non-Alcoholic Beverages Market SIZE ESTIMATES & FORECAST, BY CONSUMER TYPE,
    500. 2035 (USD Billions)
    501. Malaysia Non-Alcoholic Beverages
    502. Market SIZE ESTIMATES & FORECAST, BY PACKAGING TYPE, 2019-2035 (USD Billions)
    503. Malaysia
    504. Non-Alcoholic Beverages Market SIZE ESTIMATES & FORECAST, BY REGIONAL, 2019-2035
    505. (USD Billions)
    506. Thailand Non-Alcoholic Beverages Market
    507. SIZE ESTIMATES & FORECAST, BY PRODUCT TYPE, 2019-2035 (USD Billions)
    508. Thailand
    509. Non-Alcoholic Beverages Market SIZE ESTIMATES & FORECAST, BY DISTRIBUTION CHANNEL,
    510. 2035 (USD Billions)
    511. Thailand Non-Alcoholic Beverages
    512. Market SIZE ESTIMATES & FORECAST, BY CONSUMER TYPE, 2019-2035 (USD Billions)
    513. Thailand
    514. Non-Alcoholic Beverages Market SIZE ESTIMATES & FORECAST, BY PACKAGING TYPE,
    515. 2035 (USD Billions)
    516. Thailand Non-Alcoholic Beverages
    517. Market SIZE ESTIMATES & FORECAST, BY REGIONAL, 2019-2035 (USD Billions)
    518. Indonesia
    519. Non-Alcoholic Beverages Market SIZE ESTIMATES & FORECAST, BY PRODUCT TYPE, 2019-2035
    520. (USD Billions)
    521. Indonesia Non-Alcoholic Beverages Market
    522. SIZE ESTIMATES & FORECAST, BY DISTRIBUTION CHANNEL, 2019-2035 (USD Billions)
    523. Indonesia
    524. Non-Alcoholic Beverages Market SIZE ESTIMATES & FORECAST, BY CONSUMER TYPE,
    525. 2035 (USD Billions)
    526. Indonesia Non-Alcoholic Beverages
    527. Market SIZE ESTIMATES & FORECAST, BY PACKAGING TYPE, 2019-2035 (USD Billions)
    528. Indonesia
    529. Non-Alcoholic Beverages Market SIZE ESTIMATES & FORECAST, BY REGIONAL, 2019-2035
    530. (USD Billions)
    531. Rest of APAC Non-Alcoholic Beverages Market
    532. SIZE ESTIMATES & FORECAST, BY PRODUCT TYPE, 2019-2035 (USD Billions)
    533. Rest
    534. of APAC Non-Alcoholic Beverages Market SIZE ESTIMATES & FORECAST, BY DISTRIBUTION
    535. CHANNEL, 2019-2035 (USD Billions)
    536. Rest of APAC Non-Alcoholic
    537. Beverages Market SIZE ESTIMATES & FORECAST, BY CONSUMER TYPE, 2019-2035 (USD
    538. Billions)
    539. Rest of APAC Non-Alcoholic Beverages Market
    540. SIZE ESTIMATES & FORECAST, BY PACKAGING TYPE, 2019-2035 (USD Billions)
    541. Rest
    542. of APAC Non-Alcoholic Beverages Market SIZE ESTIMATES & FORECAST, BY REGIONAL,
    543. 2035 (USD Billions)
    544. South America Non-Alcoholic
    545. Beverages Market SIZE ESTIMATES & FORECAST, BY PRODUCT TYPE, 2019-2035 (USD
    546. Billions)
    547. South America Non-Alcoholic Beverages Market
    548. SIZE ESTIMATES & FORECAST, BY DISTRIBUTION CHANNEL, 2019-2035 (USD Billions)
    549. South
    550. America Non-Alcoholic Beverages Market SIZE ESTIMATES & FORECAST, BY CONSUMER
    551. TYPE, 2019-2035 (USD Billions)
    552. South America Non-Alcoholic
    553. Beverages Market SIZE ESTIMATES & FORECAST, BY PACKAGING TYPE, 2019-2035 (USD
    554. Billions)
    555. South America Non-Alcoholic Beverages Market
    556. SIZE ESTIMATES & FORECAST, BY REGIONAL, 2019-2035 (USD Billions)
    557. Brazil
    558. Non-Alcoholic Beverages Market SIZE ESTIMATES & FORECAST, BY PRODUCT TYPE, 2019-2035
    559. (USD Billions)
    560. Brazil Non-Alcoholic Beverages Market
    561. SIZE ESTIMATES & FORECAST, BY DISTRIBUTION CHANNEL, 2019-2035 (USD Billions)
    562. Brazil
    563. Non-Alcoholic Beverages Market SIZE ESTIMATES & FORECAST, BY CONSUMER TYPE,
    564. 2035 (USD Billions)
    565. Brazil Non-Alcoholic Beverages
    566. Market SIZE ESTIMATES & FORECAST, BY PACKAGING TYPE, 2019-2035 (USD Billions)
    567. Brazil
    568. Non-Alcoholic Beverages Market SIZE ESTIMATES & FORECAST, BY REGIONAL, 2019-2035
    569. (USD Billions)
    570. Mexico Non-Alcoholic Beverages Market
    571. SIZE ESTIMATES & FORECAST, BY PRODUCT TYPE, 2019-2035 (USD Billions)
    572. Mexico
    573. Non-Alcoholic Beverages Market SIZE ESTIMATES & FORECAST, BY DISTRIBUTION CHANNEL,
    574. 2035 (USD Billions)
    575. Mexico Non-Alcoholic Beverages
    576. Market SIZE ESTIMATES & FORECAST, BY CONSUMER TYPE, 2019-2035 (USD Billions)
    577. Mexico
    578. Non-Alcoholic Beverages Market SIZE ESTIMATES & FORECAST, BY PACKAGING TYPE,
    579. 2035 (USD Billions)
    580. Mexico Non-Alcoholic Beverages
    581. Market SIZE ESTIMATES & FORECAST, BY REGIONAL, 2019-2035 (USD Billions)
    582. Argentina
    583. Non-Alcoholic Beverages Market SIZE ESTIMATES & FORECAST, BY PRODUCT TYPE, 2019-2035
    584. (USD Billions)
    585. Argentina Non-Alcoholic Beverages Market
    586. SIZE ESTIMATES & FORECAST, BY DISTRIBUTION CHANNEL, 2019-2035 (USD Billions)
    587. Argentina
    588. Non-Alcoholic Beverages Market SIZE ESTIMATES & FORECAST, BY CONSUMER TYPE,
    589. 2035 (USD Billions)
    590. Argentina Non-Alcoholic Beverages
    591. Market SIZE ESTIMATES & FORECAST, BY PACKAGING TYPE, 2019-2035 (USD Billions)
    592. Argentina
    593. Non-Alcoholic Beverages Market SIZE ESTIMATES & FORECAST, BY REGIONAL, 2019-2035
    594. (USD Billions)
    595. Rest of South America Non-Alcoholic Beverages
    596. Market SIZE ESTIMATES & FORECAST, BY PRODUCT TYPE, 2019-2035 (USD Billions)
    597. Rest
    598. of South America Non-Alcoholic Beverages Market SIZE ESTIMATES & FORECAST, BY
    599. DISTRIBUTION CHANNEL, 2019-2035 (USD Billions)
    600. Rest of
    601. South America Non-Alcoholic Beverages Market SIZE ESTIMATES & FORECAST, BY CONSUMER
    602. TYPE, 2019-2035 (USD Billions)
    603. Rest of South America
    604. Non-Alcoholic Beverages Market SIZE ESTIMATES & FORECAST, BY PACKAGING TYPE,
    605. 2035 (USD Billions)
    606. Rest of South America Non-Alcoholic
    607. Beverages Market SIZE ESTIMATES & FORECAST, BY REGIONAL, 2019-2035 (USD Billions)
    608. MEA
    609. Non-Alcoholic Beverages Market SIZE ESTIMATES & FORECAST, BY PRODUCT TYPE, 2019-2035
    610. (USD Billions)
    611. MEA Non-Alcoholic Beverages Market SIZE
    612. ESTIMATES & FORECAST, BY DISTRIBUTION CHANNEL, 2019-2035 (USD Billions)
    613. MEA
    614. Non-Alcoholic Beverages Market SIZE ESTIMATES & FORECAST, BY CONSUMER TYPE,
    615. 2035 (USD Billions)
    616. MEA Non-Alcoholic Beverages
    617. Market SIZE ESTIMATES & FORECAST, BY PACKAGING TYPE, 2019-2035 (USD Billions)
    618. MEA
    619. Non-Alcoholic Beverages Market SIZE ESTIMATES & FORECAST, BY REGIONAL, 2019-2035
    620. (USD Billions)
    621. GCC Countries Non-Alcoholic Beverages
    622. Market SIZE ESTIMATES & FORECAST, BY PRODUCT TYPE, 2019-2035 (USD Billions)
    623. GCC
    624. Countries Non-Alcoholic Beverages Market SIZE ESTIMATES & FORECAST, BY DISTRIBUTION
    625. CHANNEL, 2019-2035 (USD Billions)
    626. GCC Countries Non-Alcoholic
    627. Beverages Market SIZE ESTIMATES & FORECAST, BY CONSUMER TYPE, 2019-2035 (USD
    628. Billions)
    629. GCC Countries Non-Alcoholic Beverages Market
    630. SIZE ESTIMATES & FORECAST, BY PACKAGING TYPE, 2019-2035 (USD Billions)
    631. GCC
    632. Countries Non-Alcoholic Beverages Market SIZE ESTIMATES & FORECAST, BY REGIONAL,
    633. 2035 (USD Billions)
    634. South Africa Non-Alcoholic Beverages
    635. Market SIZE ESTIMATES & FORECAST, BY PRODUCT TYPE, 2019-2035 (USD Billions)
    636. South
    637. Africa Non-Alcoholic Beverages Market SIZE ESTIMATES & FORECAST, BY DISTRIBUTION
    638. CHANNEL, 2019-2035 (USD Billions)
    639. South Africa Non-Alcoholic
    640. Beverages Market SIZE ESTIMATES & FORECAST, BY CONSUMER TYPE, 2019-2035 (USD
    641. Billions)
    642. South Africa Non-Alcoholic Beverages Market
    643. SIZE ESTIMATES & FORECAST, BY PACKAGING TYPE, 2019-2035 (USD Billions)
    644. South
    645. Africa Non-Alcoholic Beverages Market SIZE ESTIMATES & FORECAST, BY REGIONAL,
    646. 2035 (USD Billions)
    647. Rest of MEA Non-Alcoholic Beverages
    648. Market SIZE ESTIMATES & FORECAST, BY PRODUCT TYPE, 2019-2035 (USD Billions)
    649. Rest
    650. of MEA Non-Alcoholic Beverages Market SIZE ESTIMATES & FORECAST, BY DISTRIBUTION
    651. CHANNEL, 2019-2035 (USD Billions)
    652. Rest of MEA Non-Alcoholic
    653. Beverages Market SIZE ESTIMATES & FORECAST, BY CONSUMER TYPE, 2019-2035 (USD
    654. Billions)
    655. Rest of MEA Non-Alcoholic Beverages Market
    656. SIZE ESTIMATES & FORECAST, BY PACKAGING TYPE, 2019-2035 (USD Billions)
    657. Rest
    658. of MEA Non-Alcoholic Beverages Market SIZE ESTIMATES & FORECAST, BY REGIONAL,
    659. 2035 (USD Billions)
    660. PRODUCT LAUNCH/PRODUCT DEVELOPMENT/APPROVAL
    661. ACQUISITION/PARTNERSHIP
    662. LIST
    663. Of figures
    664. MARKET SYNOPSIS
    665. NORTH
    666. AMERICA NON-ALCOHOLIC BEVERAGES MARKET ANALYSIS
    667. US NON-ALCOHOLIC
    668. BEVERAGES MARKET ANALYSIS BY PRODUCT TYPE
    669. US NON-ALCOHOLIC
    670. BEVERAGES MARKET ANALYSIS BY DISTRIBUTION CHANNEL
    671. US
    672. NON-ALCOHOLIC BEVERAGES MARKET ANALYSIS BY CONSUMER TYPE
    673. US
    674. NON-ALCOHOLIC BEVERAGES MARKET ANALYSIS BY PACKAGING TYPE
    675. US
    676. NON-ALCOHOLIC BEVERAGES MARKET ANALYSIS BY REGIONAL
    677. CANADA
    678. NON-ALCOHOLIC BEVERAGES MARKET ANALYSIS BY PRODUCT TYPE
    679. CANADA
    680. NON-ALCOHOLIC BEVERAGES MARKET ANALYSIS BY DISTRIBUTION CHANNEL
    681. CANADA
    682. NON-ALCOHOLIC BEVERAGES MARKET ANALYSIS BY CONSUMER TYPE
    683. CANADA
    684. NON-ALCOHOLIC BEVERAGES MARKET ANALYSIS BY PACKAGING TYPE
    685. CANADA
    686. NON-ALCOHOLIC BEVERAGES MARKET ANALYSIS BY REGIONAL
    687. EUROPE
    688. NON-ALCOHOLIC BEVERAGES MARKET ANALYSIS
    689. GERMANY NON-ALCOHOLIC
    690. BEVERAGES MARKET ANALYSIS BY PRODUCT TYPE
    691. GERMANY NON-ALCOHOLIC
    692. BEVERAGES MARKET ANALYSIS BY DISTRIBUTION CHANNEL
    693. GERMANY
    694. NON-ALCOHOLIC BEVERAGES MARKET ANALYSIS BY CONSUMER TYPE
    695. GERMANY
    696. NON-ALCOHOLIC BEVERAGES MARKET ANALYSIS BY PACKAGING TYPE
    697. GERMANY
    698. NON-ALCOHOLIC BEVERAGES MARKET ANALYSIS BY REGIONAL
    699. UK
    700. NON-ALCOHOLIC BEVERAGES MARKET ANALYSIS BY PRODUCT TYPE
    701. UK
    702. NON-ALCOHOLIC BEVERAGES MARKET ANALYSIS BY DISTRIBUTION CHANNEL
    703. UK
    704. NON-ALCOHOLIC BEVERAGES MARKET ANALYSIS BY CONSUMER TYPE
    705. UK
    706. NON-ALCOHOLIC BEVERAGES MARKET ANALYSIS BY PACKAGING TYPE
    707. UK
    708. NON-ALCOHOLIC BEVERAGES MARKET ANALYSIS BY REGIONAL
    709. FRANCE
    710. NON-ALCOHOLIC BEVERAGES MARKET ANALYSIS BY PRODUCT TYPE
    711. FRANCE
    712. NON-ALCOHOLIC BEVERAGES MARKET ANALYSIS BY DISTRIBUTION CHANNEL
    713. FRANCE
    714. NON-ALCOHOLIC BEVERAGES MARKET ANALYSIS BY CONSUMER TYPE
    715. FRANCE
    716. NON-ALCOHOLIC BEVERAGES MARKET ANALYSIS BY PACKAGING TYPE
    717. FRANCE
    718. NON-ALCOHOLIC BEVERAGES MARKET ANALYSIS BY REGIONAL
    719. RUSSIA
    720. NON-ALCOHOLIC BEVERAGES MARKET ANALYSIS BY PRODUCT TYPE
    721. RUSSIA
    722. NON-ALCOHOLIC BEVERAGES MARKET ANALYSIS BY DISTRIBUTION CHANNEL
    723. RUSSIA
    724. NON-ALCOHOLIC BEVERAGES MARKET ANALYSIS BY CONSUMER TYPE
    725. RUSSIA
    726. NON-ALCOHOLIC BEVERAGES MARKET ANALYSIS BY PACKAGING TYPE
    727. RUSSIA
    728. NON-ALCOHOLIC BEVERAGES MARKET ANALYSIS BY REGIONAL
    729. ITALY
    730. NON-ALCOHOLIC BEVERAGES MARKET ANALYSIS BY PRODUCT TYPE
    731. ITALY
    732. NON-ALCOHOLIC BEVERAGES MARKET ANALYSIS BY DISTRIBUTION CHANNEL
    733. ITALY
    734. NON-ALCOHOLIC BEVERAGES MARKET ANALYSIS BY CONSUMER TYPE
    735. ITALY
    736. NON-ALCOHOLIC BEVERAGES MARKET ANALYSIS BY PACKAGING TYPE
    737. ITALY
    738. NON-ALCOHOLIC BEVERAGES MARKET ANALYSIS BY REGIONAL
    739. SPAIN
    740. NON-ALCOHOLIC BEVERAGES MARKET ANALYSIS BY PRODUCT TYPE
    741. SPAIN
    742. NON-ALCOHOLIC BEVERAGES MARKET ANALYSIS BY DISTRIBUTION CHANNEL
    743. SPAIN
    744. NON-ALCOHOLIC BEVERAGES MARKET ANALYSIS BY CONSUMER TYPE
    745. SPAIN
    746. NON-ALCOHOLIC BEVERAGES MARKET ANALYSIS BY PACKAGING TYPE
    747. SPAIN
    748. NON-ALCOHOLIC BEVERAGES MARKET ANALYSIS BY REGIONAL
    749. REST
    750. OF EUROPE NON-ALCOHOLIC BEVERAGES MARKET ANALYSIS BY PRODUCT TYPE
    751. REST
    752. OF EUROPE NON-ALCOHOLIC BEVERAGES MARKET ANALYSIS BY DISTRIBUTION CHANNEL
    753. REST
    754. OF EUROPE NON-ALCOHOLIC BEVERAGES MARKET ANALYSIS BY CONSUMER TYPE
    755. REST
    756. OF EUROPE NON-ALCOHOLIC BEVERAGES MARKET ANALYSIS BY PACKAGING TYPE
    757. REST
    758. OF EUROPE NON-ALCOHOLIC BEVERAGES MARKET ANALYSIS BY REGIONAL
    759. APAC
    760. NON-ALCOHOLIC BEVERAGES MARKET ANALYSIS
    761. CHINA NON-ALCOHOLIC
    762. BEVERAGES MARKET ANALYSIS BY PRODUCT TYPE
    763. CHINA NON-ALCOHOLIC
    764. BEVERAGES MARKET ANALYSIS BY DISTRIBUTION CHANNEL
    765. CHINA
    766. NON-ALCOHOLIC BEVERAGES MARKET ANALYSIS BY CONSUMER TYPE
    767. CHINA
    768. NON-ALCOHOLIC BEVERAGES MARKET ANALYSIS BY PACKAGING TYPE
    769. CHINA
    770. NON-ALCOHOLIC BEVERAGES MARKET ANALYSIS BY REGIONAL
    771. INDIA
    772. NON-ALCOHOLIC BEVERAGES MARKET ANALYSIS BY PRODUCT TYPE
    773. INDIA
    774. NON-ALCOHOLIC BEVERAGES MARKET ANALYSIS BY DISTRIBUTION CHANNEL
    775. INDIA
    776. NON-ALCOHOLIC BEVERAGES MARKET ANALYSIS BY CONSUMER TYPE
    777. INDIA
    778. NON-ALCOHOLIC BEVERAGES MARKET ANALYSIS BY PACKAGING TYPE
    779. INDIA
    780. NON-ALCOHOLIC BEVERAGES MARKET ANALYSIS BY REGIONAL
    781. JAPAN
    782. NON-ALCOHOLIC BEVERAGES MARKET ANALYSIS BY PRODUCT TYPE
    783. JAPAN
    784. NON-ALCOHOLIC BEVERAGES MARKET ANALYSIS BY DISTRIBUTION CHANNEL
    785. JAPAN
    786. NON-ALCOHOLIC BEVERAGES MARKET ANALYSIS BY CONSUMER TYPE
    787. JAPAN
    788. NON-ALCOHOLIC BEVERAGES MARKET ANALYSIS BY PACKAGING TYPE
    789. JAPAN
    790. NON-ALCOHOLIC BEVERAGES MARKET ANALYSIS BY REGIONAL
    791. SOUTH
    792. KOREA NON-ALCOHOLIC BEVERAGES MARKET ANALYSIS BY PRODUCT TYPE
    793. SOUTH
    794. KOREA NON-ALCOHOLIC BEVERAGES MARKET ANALYSIS BY DISTRIBUTION CHANNEL
    795. SOUTH
    796. KOREA NON-ALCOHOLIC BEVERAGES MARKET ANALYSIS BY CONSUMER TYPE
    797. SOUTH
    798. KOREA NON-ALCOHOLIC BEVERAGES MARKET ANALYSIS BY PACKAGING TYPE
    799. SOUTH
    800. KOREA NON-ALCOHOLIC BEVERAGES MARKET ANALYSIS BY REGIONAL
    801. MALAYSIA
    802. NON-ALCOHOLIC BEVERAGES MARKET ANALYSIS BY PRODUCT TYPE
    803. MALAYSIA
    804. NON-ALCOHOLIC BEVERAGES MARKET ANALYSIS BY DISTRIBUTION CHANNEL
    805. MALAYSIA
    806. NON-ALCOHOLIC BEVERAGES MARKET ANALYSIS BY CONSUMER TYPE
    807. MALAYSIA
    808. NON-ALCOHOLIC BEVERAGES MARKET ANALYSIS BY PACKAGING TYPE
    809. MALAYSIA
    810. NON-ALCOHOLIC BEVERAGES MARKET ANALYSIS BY REGIONAL
    811. THAILAND
    812. NON-ALCOHOLIC BEVERAGES MARKET ANALYSIS BY PRODUCT TYPE
    813. THAILAND
    814. NON-ALCOHOLIC BEVERAGES MARKET ANALYSIS BY DISTRIBUTION CHANNEL
    815. THAILAND
    816. NON-ALCOHOLIC BEVERAGES MARKET ANALYSIS BY CONSUMER TYPE
    817. THAILAND
    818. NON-ALCOHOLIC BEVERAGES MARKET ANALYSIS BY PACKAGING TYPE
    819. THAILAND
    820. NON-ALCOHOLIC BEVERAGES MARKET ANALYSIS BY REGIONAL
    821. INDONESIA
    822. NON-ALCOHOLIC BEVERAGES MARKET ANALYSIS BY PRODUCT TYPE
    823. INDONESIA
    824. NON-ALCOHOLIC BEVERAGES MARKET ANALYSIS BY DISTRIBUTION CHANNEL
    825. INDONESIA
    826. NON-ALCOHOLIC BEVERAGES MARKET ANALYSIS BY CONSUMER TYPE
    827. INDONESIA
    828. NON-ALCOHOLIC BEVERAGES MARKET ANALYSIS BY PACKAGING TYPE
    829. INDONESIA
    830. NON-ALCOHOLIC BEVERAGES MARKET ANALYSIS BY REGIONAL
    831. REST
    832. OF APAC NON-ALCOHOLIC BEVERAGES MARKET ANALYSIS BY PRODUCT TYPE
    833. REST
    834. OF APAC NON-ALCOHOLIC BEVERAGES MARKET ANALYSIS BY DISTRIBUTION CHANNEL
    835. REST
    836. OF APAC NON-ALCOHOLIC BEVERAGES MARKET ANALYSIS BY CONSUMER TYPE
    837. REST
    838. OF APAC NON-ALCOHOLIC BEVERAGES MARKET ANALYSIS BY PACKAGING TYPE
    839. REST
    840. OF APAC NON-ALCOHOLIC BEVERAGES MARKET ANALYSIS BY REGIONAL
    841. SOUTH
    842. AMERICA NON-ALCOHOLIC BEVERAGES MARKET ANALYSIS
    843. BRAZIL
    844. NON-ALCOHOLIC BEVERAGES MARKET ANALYSIS BY PRODUCT TYPE
    845. BRAZIL
    846. NON-ALCOHOLIC BEVERAGES MARKET ANALYSIS BY DISTRIBUTION CHANNEL
    847. BRAZIL
    848. NON-ALCOHOLIC BEVERAGES MARKET ANALYSIS BY CONSUMER TYPE
    849. BRAZIL
    850. NON-ALCOHOLIC BEVERAGES MARKET ANALYSIS BY PACKAGING TYPE
    851. BRAZIL
    852. NON-ALCOHOLIC BEVERAGES MARKET ANALYSIS BY REGIONAL
    853. MEXICO
    854. NON-ALCOHOLIC BEVERAGES MARKET ANALYSIS BY PRODUCT TYPE
    855. MEXICO
    856. NON-ALCOHOLIC BEVERAGES MARKET ANALYSIS BY DISTRIBUTION CHANNEL
    857. MEXICO
    858. NON-ALCOHOLIC BEVERAGES MARKET ANALYSIS BY CONSUMER TYPE
    859. MEXICO
    860. NON-ALCOHOLIC BEVERAGES MARKET ANALYSIS BY PACKAGING TYPE
    861. MEXICO
    862. NON-ALCOHOLIC BEVERAGES MARKET ANALYSIS BY REGIONAL
    863. ARGENTINA
    864. NON-ALCOHOLIC BEVERAGES MARKET ANALYSIS BY PRODUCT TYPE
    865. ARGENTINA
    866. NON-ALCOHOLIC BEVERAGES MARKET ANALYSIS BY DISTRIBUTION CHANNEL
    867. ARGENTINA
    868. NON-ALCOHOLIC BEVERAGES MARKET ANALYSIS BY CONSUMER TYPE
    869. ARGENTINA
    870. NON-ALCOHOLIC BEVERAGES MARKET ANALYSIS BY PACKAGING TYPE
    871. ARGENTINA
    872. NON-ALCOHOLIC BEVERAGES MARKET ANALYSIS BY REGIONAL
    873. REST
    874. OF SOUTH AMERICA NON-ALCOHOLIC BEVERAGES MARKET ANALYSIS BY PRODUCT TYPE
    875. REST
    876. OF SOUTH AMERICA NON-ALCOHOLIC BEVERAGES MARKET ANALYSIS BY DISTRIBUTION CHANNEL
    877. REST
    878. OF SOUTH AMERICA NON-ALCOHOLIC BEVERAGES MARKET ANALYSIS BY CONSUMER TYPE
    879. REST
    880. OF SOUTH AMERICA NON-ALCOHOLIC BEVERAGES MARKET ANALYSIS BY PACKAGING TYPE
    881. REST
    882. OF SOUTH AMERICA NON-ALCOHOLIC BEVERAGES MARKET ANALYSIS BY REGIONAL
    883. MEA
    884. NON-ALCOHOLIC BEVERAGES MARKET ANALYSIS
    885. GCC COUNTRIES
    886. NON-ALCOHOLIC BEVERAGES MARKET ANALYSIS BY PRODUCT TYPE
    887. GCC
    888. COUNTRIES NON-ALCOHOLIC BEVERAGES MARKET ANALYSIS BY DISTRIBUTION CHANNEL
    889. GCC
    890. COUNTRIES NON-ALCOHOLIC BEVERAGES MARKET ANALYSIS BY CONSUMER TYPE
    891. GCC
    892. COUNTRIES NON-ALCOHOLIC BEVERAGES MARKET ANALYSIS BY PACKAGING TYPE
    893. GCC
    894. COUNTRIES NON-ALCOHOLIC BEVERAGES MARKET ANALYSIS BY REGIONAL
    895. SOUTH
    896. AFRICA NON-ALCOHOLIC BEVERAGES MARKET ANALYSIS BY PRODUCT TYPE
    897. SOUTH
    898. AFRICA NON-ALCOHOLIC BEVERAGES MARKET ANALYSIS BY DISTRIBUTION CHANNEL
    899. SOUTH
    900. AFRICA NON-ALCOHOLIC BEVERAGES MARKET ANALYSIS BY CONSUMER TYPE
    901. SOUTH
    902. AFRICA NON-ALCOHOLIC BEVERAGES MARKET ANALYSIS BY PACKAGING TYPE
    903. SOUTH
    904. AFRICA NON-ALCOHOLIC BEVERAGES MARKET ANALYSIS BY REGIONAL
    905. REST
    906. OF MEA NON-ALCOHOLIC BEVERAGES MARKET ANALYSIS BY PRODUCT TYPE
    907. REST
    908. OF MEA NON-ALCOHOLIC BEVERAGES MARKET ANALYSIS BY DISTRIBUTION CHANNEL
    909. REST
    910. OF MEA NON-ALCOHOLIC BEVERAGES MARKET ANALYSIS BY CONSUMER TYPE
    911. REST
    912. OF MEA NON-ALCOHOLIC BEVERAGES MARKET ANALYSIS BY PACKAGING TYPE
    913. REST
    914. OF MEA NON-ALCOHOLIC BEVERAGES MARKET ANALYSIS BY REGIONAL
    915. KEY
    916. BUYING CRITERIA OF NON-ALCOHOLIC BEVERAGES MARKET
    917. RESEARCH
    918. PROCESS OF MRFR
    919. DRO ANALYSIS OF NON-ALCOHOLIC BEVERAGES
    920. MARKET
    921. DRIVERS IMPACT ANALYSIS: NON-ALCOHOLIC BEVERAGES
    922. MARKET
    923. RESTRAINTS IMPACT ANALYSIS: NON-ALCOHOLIC BEVERAGES
    924. MARKET
    925. SUPPLY / VALUE CHAIN: NON-ALCOHOLIC BEVERAGES
    926. MARKET
    927. NON-ALCOHOLIC BEVERAGES MARKET, BY PRODUCT TYPE,
    928. (% SHARE)
    929. NON-ALCOHOLIC BEVERAGES MARKET, BY PRODUCT
    930. TYPE, 2019 TO 2035 (USD Billions)
    931. NON-ALCOHOLIC BEVERAGES
    932. MARKET, BY DISTRIBUTION CHANNEL, 2025 (% SHARE)
    933. NON-ALCOHOLIC
    934. BEVERAGES MARKET, BY DISTRIBUTION CHANNEL, 2019 TO 2035 (USD Billions)
    935. NON-ALCOHOLIC
    936. BEVERAGES MARKET, BY CONSUMER TYPE, 2025 (% SHARE)
    937. NON-ALCOHOLIC
    938. BEVERAGES MARKET, BY CONSUMER TYPE, 2019 TO 2035 (USD Billions)
    939. NON-ALCOHOLIC
    940. BEVERAGES MARKET, BY PACKAGING TYPE, 2025 (% SHARE)
    941. NON-ALCOHOLIC
    942. BEVERAGES MARKET, BY PACKAGING TYPE, 2019 TO 2035 (USD Billions)
    943. NON-ALCOHOLIC
    944. BEVERAGES MARKET, BY REGIONAL, 2025 (% SHARE)
    945. NON-ALCOHOLIC
    946. BEVERAGES MARKET, BY REGIONAL, 2019 TO 2035 (USD Billions)
    947. BENCHMARKING
    948. OF MAJOR COMPETITORS

    Non-Alcoholic Beverages Market Segmentation

    • Non-Alcoholic Beverages Market By Product Type (USD Billion, 2019-2035)

      • Carbonated Beverages
      • Juices
      • Functional Drinks
      • Dairy-based Drinks
      • Water
    • Non-Alcoholic Beverages Market By Distribution Channel (USD Billion, 2019-2035)

      • Supermarkets
      • Convenience Stores
      • Online Retail
      • Specialty Stores
      • Food Service
    • Non-Alcoholic Beverages Market By Consumer Type (USD Billion, 2019-2035)

      • Adults
      • Children
      • Teenagers
      • Health-conscious Consumers
      • Athletes
    • Non-Alcoholic Beverages Market By Packaging Type (USD Billion, 2019-2035)

      • Bottles
      • Cans
      • Pouches
      • Tetra Packs
    • Non-Alcoholic Beverages Market By Regional (USD Billion, 2019-2035)

      • North America
      • Europe
      • South America
      • Asia Pacific
      • Middle East and Africa

    Non-Alcoholic Beverages Market Regional Outlook (USD Billion, 2019-2035)

    • North America Outlook (USD Billion, 2019-2035)

      • North America Non-Alcoholic Beverages Market by Product Type

        • Carbonated Beverages
        • Juices
        • Functional Drinks
        • Dairy-based Drinks
        • Water
      • North America Non-Alcoholic Beverages Market by Distribution Channel Type

        • Supermarkets
        • Convenience Stores
        • Online Retail
        • Specialty Stores
        • Food Service
      • North America Non-Alcoholic Beverages Market by Consumer Type

        • Adults
        • Children
        • Teenagers
        • Health-conscious Consumers
        • Athletes
      • North America Non-Alcoholic Beverages Market by Packaging Type

        • Bottles
        • Cans
        • Pouches
        • Tetra Packs
      • North America Non-Alcoholic Beverages Market by Regional Type

        • US
        • Canada
      • US Outlook (USD Billion, 2019-2035)
      • US Non-Alcoholic Beverages Market by Product Type

        • Carbonated Beverages
        • Juices
        • Functional Drinks
        • Dairy-based Drinks
        • Water
      • US Non-Alcoholic Beverages Market by Distribution Channel Type

        • Supermarkets
        • Convenience Stores
        • Online Retail
        • Specialty Stores
        • Food Service
      • US Non-Alcoholic Beverages Market by Consumer Type

        • Adults
        • Children
        • Teenagers
        • Health-conscious Consumers
        • Athletes
      • US Non-Alcoholic Beverages Market by Packaging Type

        • Bottles
        • Cans
        • Pouches
        • Tetra Packs
      • CANADA Outlook (USD Billion, 2019-2035)
      • CANADA Non-Alcoholic Beverages Market by Product Type

        • Carbonated Beverages
        • Juices
        • Functional Drinks
        • Dairy-based Drinks
        • Water
      • CANADA Non-Alcoholic Beverages Market by Distribution Channel Type

        • Supermarkets
        • Convenience Stores
        • Online Retail
        • Specialty Stores
        • Food Service
      • CANADA Non-Alcoholic Beverages Market by Consumer Type

        • Adults
        • Children
        • Teenagers
        • Health-conscious Consumers
        • Athletes
      • CANADA Non-Alcoholic Beverages Market by Packaging Type

        • Bottles
        • Cans
        • Pouches
        • Tetra Packs
    • Europe Outlook (USD Billion, 2019-2035)

      • Europe Non-Alcoholic Beverages Market by Product Type

        • Carbonated Beverages
        • Juices
        • Functional Drinks
        • Dairy-based Drinks
        • Water
      • Europe Non-Alcoholic Beverages Market by Distribution Channel Type

        • Supermarkets
        • Convenience Stores
        • Online Retail
        • Specialty Stores
        • Food Service
      • Europe Non-Alcoholic Beverages Market by Consumer Type

        • Adults
        • Children
        • Teenagers
        • Health-conscious Consumers
        • Athletes
      • Europe Non-Alcoholic Beverages Market by Packaging Type

        • Bottles
        • Cans
        • Pouches
        • Tetra Packs
      • Europe Non-Alcoholic Beverages Market by Regional Type

        • Germany
        • UK
        • France
        • Russia
        • Italy
        • Spain
        • Rest of Europe
      • GERMANY Outlook (USD Billion, 2019-2035)
      • GERMANY Non-Alcoholic Beverages Market by Product Type

        • Carbonated Beverages
        • Juices
        • Functional Drinks
        • Dairy-based Drinks
        • Water
      • GERMANY Non-Alcoholic Beverages Market by Distribution Channel Type

        • Supermarkets
        • Convenience Stores
        • Online Retail
        • Specialty Stores
        • Food Service
      • GERMANY Non-Alcoholic Beverages Market by Consumer Type

        • Adults
        • Children
        • Teenagers
        • Health-conscious Consumers
        • Athletes
      • GERMANY Non-Alcoholic Beverages Market by Packaging Type

        • Bottles
        • Cans
        • Pouches
        • Tetra Packs
      • UK Outlook (USD Billion, 2019-2035)
      • UK Non-Alcoholic Beverages Market by Product Type

        • Carbonated Beverages
        • Juices
        • Functional Drinks
        • Dairy-based Drinks
        • Water
      • UK Non-Alcoholic Beverages Market by Distribution Channel Type

        • Supermarkets
        • Convenience Stores
        • Online Retail
        • Specialty Stores
        • Food Service
      • UK Non-Alcoholic Beverages Market by Consumer Type

        • Adults
        • Children
        • Teenagers
        • Health-conscious Consumers
        • Athletes
      • UK Non-Alcoholic Beverages Market by Packaging Type

        • Bottles
        • Cans
        • Pouches
        • Tetra Packs
      • FRANCE Outlook (USD Billion, 2019-2035)
      • FRANCE Non-Alcoholic Beverages Market by Product Type

        • Carbonated Beverages
        • Juices
        • Functional Drinks
        • Dairy-based Drinks
        • Water
      • FRANCE Non-Alcoholic Beverages Market by Distribution Channel Type

        • Supermarkets
        • Convenience Stores
        • Online Retail
        • Specialty Stores
        • Food Service
      • FRANCE Non-Alcoholic Beverages Market by Consumer Type

        • Adults
        • Children
        • Teenagers
        • Health-conscious Consumers
        • Athletes
      • FRANCE Non-Alcoholic Beverages Market by Packaging Type

        • Bottles
        • Cans
        • Pouches
        • Tetra Packs
      • RUSSIA Outlook (USD Billion, 2019-2035)
      • RUSSIA Non-Alcoholic Beverages Market by Product Type

        • Carbonated Beverages
        • Juices
        • Functional Drinks
        • Dairy-based Drinks
        • Water
      • RUSSIA Non-Alcoholic Beverages Market by Distribution Channel Type

        • Supermarkets
        • Convenience Stores
        • Online Retail
        • Specialty Stores
        • Food Service
      • RUSSIA Non-Alcoholic Beverages Market by Consumer Type

        • Adults
        • Children
        • Teenagers
        • Health-conscious Consumers
        • Athletes
      • RUSSIA Non-Alcoholic Beverages Market by Packaging Type

        • Bottles
        • Cans
        • Pouches
        • Tetra Packs
      • ITALY Outlook (USD Billion, 2019-2035)
      • ITALY Non-Alcoholic Beverages Market by Product Type

        • Carbonated Beverages
        • Juices
        • Functional Drinks
        • Dairy-based Drinks
        • Water
      • ITALY Non-Alcoholic Beverages Market by Distribution Channel Type

        • Supermarkets
        • Convenience Stores
        • Online Retail
        • Specialty Stores
        • Food Service
      • ITALY Non-Alcoholic Beverages Market by Consumer Type

        • Adults
        • Children
        • Teenagers
        • Health-conscious Consumers
        • Athletes
      • ITALY Non-Alcoholic Beverages Market by Packaging Type

        • Bottles
        • Cans
        • Pouches
        • Tetra Packs
      • SPAIN Outlook (USD Billion, 2019-2035)
      • SPAIN Non-Alcoholic Beverages Market by Product Type

        • Carbonated Beverages
        • Juices
        • Functional Drinks
        • Dairy-based Drinks
        • Water
      • SPAIN Non-Alcoholic Beverages Market by Distribution Channel Type

        • Supermarkets
        • Convenience Stores
        • Online Retail
        • Specialty Stores
        • Food Service
      • SPAIN Non-Alcoholic Beverages Market by Consumer Type

        • Adults
        • Children
        • Teenagers
        • Health-conscious Consumers
        • Athletes
      • SPAIN Non-Alcoholic Beverages Market by Packaging Type

        • Bottles
        • Cans
        • Pouches
        • Tetra Packs
      • REST OF EUROPE Outlook (USD Billion, 2019-2035)
      • REST OF EUROPE Non-Alcoholic Beverages Market by Product Type

        • Carbonated Beverages
        • Juices
        • Functional Drinks
        • Dairy-based Drinks
        • Water
      • REST OF EUROPE Non-Alcoholic Beverages Market by Distribution Channel Type

        • Supermarkets
        • Convenience Stores
        • Online Retail
        • Specialty Stores
        • Food Service
      • REST OF EUROPE Non-Alcoholic Beverages Market by Consumer Type

        • Adults
        • Children
        • Teenagers
        • Health-conscious Consumers
        • Athletes
      • REST OF EUROPE Non-Alcoholic Beverages Market by Packaging Type

        • Bottles
        • Cans
        • Pouches
        • Tetra Packs
    • APAC Outlook (USD Billion, 2019-2035)

      • APAC Non-Alcoholic Beverages Market by Product Type

        • Carbonated Beverages
        • Juices
        • Functional Drinks
        • Dairy-based Drinks
        • Water
      • APAC Non-Alcoholic Beverages Market by Distribution Channel Type

        • Supermarkets
        • Convenience Stores
        • Online Retail
        • Specialty Stores
        • Food Service
      • APAC Non-Alcoholic Beverages Market by Consumer Type

        • Adults
        • Children
        • Teenagers
        • Health-conscious Consumers
        • Athletes
      • APAC Non-Alcoholic Beverages Market by Packaging Type

        • Bottles
        • Cans
        • Pouches
        • Tetra Packs
      • APAC Non-Alcoholic Beverages Market by Regional Type

        • China
        • India
        • Japan
        • South Korea
        • Malaysia
        • Thailand
        • Indonesia
        • Rest of APAC
      • CHINA Outlook (USD Billion, 2019-2035)
      • CHINA Non-Alcoholic Beverages Market by Product Type

        • Carbonated Beverages
        • Juices
        • Functional Drinks
        • Dairy-based Drinks
        • Water
      • CHINA Non-Alcoholic Beverages Market by Distribution Channel Type

        • Supermarkets
        • Convenience Stores
        • Online Retail
        • Specialty Stores
        • Food Service
      • CHINA Non-Alcoholic Beverages Market by Consumer Type

        • Adults
        • Children
        • Teenagers
        • Health-conscious Consumers
        • Athletes
      • CHINA Non-Alcoholic Beverages Market by Packaging Type

        • Bottles
        • Cans
        • Pouches
        • Tetra Packs
      • INDIA Outlook (USD Billion, 2019-2035)
      • INDIA Non-Alcoholic Beverages Market by Product Type

        • Carbonated Beverages
        • Juices
        • Functional Drinks
        • Dairy-based Drinks
        • Water
      • INDIA Non-Alcoholic Beverages Market by Distribution Channel Type

        • Supermarkets
        • Convenience Stores
        • Online Retail
        • Specialty Stores
        • Food Service
      • INDIA Non-Alcoholic Beverages Market by Consumer Type

        • Adults
        • Children
        • Teenagers
        • Health-conscious Consumers
        • Athletes
      • INDIA Non-Alcoholic Beverages Market by Packaging Type

        • Bottles
        • Cans
        • Pouches
        • Tetra Packs
      • JAPAN Outlook (USD Billion, 2019-2035)
      • JAPAN Non-Alcoholic Beverages Market by Product Type

        • Carbonated Beverages
        • Juices
        • Functional Drinks
        • Dairy-based Drinks
        • Water
      • JAPAN Non-Alcoholic Beverages Market by Distribution Channel Type

        • Supermarkets
        • Convenience Stores
        • Online Retail
        • Specialty Stores
        • Food Service
      • JAPAN Non-Alcoholic Beverages Market by Consumer Type

        • Adults
        • Children
        • Teenagers
        • Health-conscious Consumers
        • Athletes
      • JAPAN Non-Alcoholic Beverages Market by Packaging Type

        • Bottles
        • Cans
        • Pouches
        • Tetra Packs
      • SOUTH KOREA Outlook (USD Billion, 2019-2035)
      • SOUTH KOREA Non-Alcoholic Beverages Market by Product Type

        • Carbonated Beverages
        • Juices
        • Functional Drinks
        • Dairy-based Drinks
        • Water
      • SOUTH KOREA Non-Alcoholic Beverages Market by Distribution Channel Type

        • Supermarkets
        • Convenience Stores
        • Online Retail
        • Specialty Stores
        • Food Service
      • SOUTH KOREA Non-Alcoholic Beverages Market by Consumer Type

        • Adults
        • Children
        • Teenagers
        • Health-conscious Consumers
        • Athletes
      • SOUTH KOREA Non-Alcoholic Beverages Market by Packaging Type

        • Bottles
        • Cans
        • Pouches
        • Tetra Packs
      • MALAYSIA Outlook (USD Billion, 2019-2035)
      • MALAYSIA Non-Alcoholic Beverages Market by Product Type

        • Carbonated Beverages
        • Juices
        • Functional Drinks
        • Dairy-based Drinks
        • Water
      • MALAYSIA Non-Alcoholic Beverages Market by Distribution Channel Type

        • Supermarkets
        • Convenience Stores
        • Online Retail
        • Specialty Stores
        • Food Service
      • MALAYSIA Non-Alcoholic Beverages Market by Consumer Type

        • Adults
        • Children
        • Teenagers
        • Health-conscious Consumers
        • Athletes
      • MALAYSIA Non-Alcoholic Beverages Market by Packaging Type

        • Bottles
        • Cans
        • Pouches
        • Tetra Packs
      • THAILAND Outlook (USD Billion, 2019-2035)
      • THAILAND Non-Alcoholic Beverages Market by Product Type

        • Carbonated Beverages
        • Juices
        • Functional Drinks
        • Dairy-based Drinks
        • Water
      • THAILAND Non-Alcoholic Beverages Market by Distribution Channel Type

        • Supermarkets
        • Convenience Stores
        • Online Retail
        • Specialty Stores
        • Food Service
      • THAILAND Non-Alcoholic Beverages Market by Consumer Type

        • Adults
        • Children
        • Teenagers
        • Health-conscious Consumers
        • Athletes
      • THAILAND Non-Alcoholic Beverages Market by Packaging Type

        • Bottles
        • Cans
        • Pouches
        • Tetra Packs
      • INDONESIA Outlook (USD Billion, 2019-2035)
      • INDONESIA Non-Alcoholic Beverages Market by Product Type

        • Carbonated Beverages
        • Juices
        • Functional Drinks
        • Dairy-based Drinks
        • Water
      • INDONESIA Non-Alcoholic Beverages Market by Distribution Channel Type

        • Supermarkets
        • Convenience Stores
        • Online Retail
        • Specialty Stores
        • Food Service
      • INDONESIA Non-Alcoholic Beverages Market by Consumer Type

        • Adults
        • Children
        • Teenagers
        • Health-conscious Consumers
        • Athletes
      • INDONESIA Non-Alcoholic Beverages Market by Packaging Type

        • Bottles
        • Cans
        • Pouches
        • Tetra Packs
      • REST OF APAC Outlook (USD Billion, 2019-2035)
      • REST OF APAC Non-Alcoholic Beverages Market by Product Type

        • Carbonated Beverages
        • Juices
        • Functional Drinks
        • Dairy-based Drinks
        • Water
      • REST OF APAC Non-Alcoholic Beverages Market by Distribution Channel Type

        • Supermarkets
        • Convenience Stores
        • Online Retail
        • Specialty Stores
        • Food Service
      • REST OF APAC Non-Alcoholic Beverages Market by Consumer Type

        • Adults
        • Children
        • Teenagers
        • Health-conscious Consumers
        • Athletes
      • REST OF APAC Non-Alcoholic Beverages Market by Packaging Type

        • Bottles
        • Cans
        • Pouches
        • Tetra Packs
    • South America Outlook (USD Billion, 2019-2035)

      • South America Non-Alcoholic Beverages Market by Product Type

        • Carbonated Beverages
        • Juices
        • Functional Drinks
        • Dairy-based Drinks
        • Water
      • South America Non-Alcoholic Beverages Market by Distribution Channel Type

        • Supermarkets
        • Convenience Stores
        • Online Retail
        • Specialty Stores
        • Food Service
      • South America Non-Alcoholic Beverages Market by Consumer Type

        • Adults
        • Children
        • Teenagers
        • Health-conscious Consumers
        • Athletes
      • South America Non-Alcoholic Beverages Market by Packaging Type

        • Bottles
        • Cans
        • Pouches
        • Tetra Packs
      • South America Non-Alcoholic Beverages Market by Regional Type

        • Brazil
        • Mexico
        • Argentina
        • Rest of South America
      • BRAZIL Outlook (USD Billion, 2019-2035)
      • BRAZIL Non-Alcoholic Beverages Market by Product Type

        • Carbonated Beverages
        • Juices
        • Functional Drinks
        • Dairy-based Drinks
        • Water
      • BRAZIL Non-Alcoholic Beverages Market by Distribution Channel Type

        • Supermarkets
        • Convenience Stores
        • Online Retail
        • Specialty Stores
        • Food Service
      • BRAZIL Non-Alcoholic Beverages Market by Consumer Type

        • Adults
        • Children
        • Teenagers
        • Health-conscious Consumers
        • Athletes
      • BRAZIL Non-Alcoholic Beverages Market by Packaging Type

        • Bottles
        • Cans
        • Pouches
        • Tetra Packs
      • MEXICO Outlook (USD Billion, 2019-2035)
      • MEXICO Non-Alcoholic Beverages Market by Product Type

        • Carbonated Beverages
        • Juices
        • Functional Drinks
        • Dairy-based Drinks
        • Water
      • MEXICO Non-Alcoholic Beverages Market by Distribution Channel Type

        • Supermarkets
        • Convenience Stores
        • Online Retail
        • Specialty Stores
        • Food Service
      • MEXICO Non-Alcoholic Beverages Market by Consumer Type

        • Adults
        • Children
        • Teenagers
        • Health-conscious Consumers
        • Athletes
      • MEXICO Non-Alcoholic Beverages Market by Packaging Type

        • Bottles
        • Cans
        • Pouches
        • Tetra Packs
      • ARGENTINA Outlook (USD Billion, 2019-2035)
      • ARGENTINA Non-Alcoholic Beverages Market by Product Type

        • Carbonated Beverages
        • Juices
        • Functional Drinks
        • Dairy-based Drinks
        • Water
      • ARGENTINA Non-Alcoholic Beverages Market by Distribution Channel Type

        • Supermarkets
        • Convenience Stores
        • Online Retail
        • Specialty Stores
        • Food Service
      • ARGENTINA Non-Alcoholic Beverages Market by Consumer Type

        • Adults
        • Children
        • Teenagers
        • Health-conscious Consumers
        • Athletes
      • ARGENTINA Non-Alcoholic Beverages Market by Packaging Type

        • Bottles
        • Cans
        • Pouches
        • Tetra Packs
      • REST OF SOUTH AMERICA Outlook (USD Billion, 2019-2035)
      • REST OF SOUTH AMERICA Non-Alcoholic Beverages Market by Product Type

        • Carbonated Beverages
        • Juices
        • Functional Drinks
        • Dairy-based Drinks
        • Water
      • REST OF SOUTH AMERICA Non-Alcoholic Beverages Market by Distribution Channel Type

        • Supermarkets
        • Convenience Stores
        • Online Retail
        • Specialty Stores
        • Food Service
      • REST OF SOUTH AMERICA Non-Alcoholic Beverages Market by Consumer Type

        • Adults
        • Children
        • Teenagers
        • Health-conscious Consumers
        • Athletes
      • REST OF SOUTH AMERICA Non-Alcoholic Beverages Market by Packaging Type

        • Bottles
        • Cans
        • Pouches
        • Tetra Packs
    • MEA Outlook (USD Billion, 2019-2035)

      • MEA Non-Alcoholic Beverages Market by Product Type

        • Carbonated Beverages
        • Juices
        • Functional Drinks
        • Dairy-based Drinks
        • Water
      • MEA Non-Alcoholic Beverages Market by Distribution Channel Type

        • Supermarkets
        • Convenience Stores
        • Online Retail
        • Specialty Stores
        • Food Service
      • MEA Non-Alcoholic Beverages Market by Consumer Type

        • Adults
        • Children
        • Teenagers
        • Health-conscious Consumers
        • Athletes
      • MEA Non-Alcoholic Beverages Market by Packaging Type

        • Bottles
        • Cans
        • Pouches
        • Tetra Packs
      • MEA Non-Alcoholic Beverages Market by Regional Type

        • GCC Countries
        • South Africa
        • Rest of MEA
      • GCC COUNTRIES Outlook (USD Billion, 2019-2035)
      • GCC COUNTRIES Non-Alcoholic Beverages Market by Product Type

        • Carbonated Beverages
        • Juices
        • Functional Drinks
        • Dairy-based Drinks
        • Water
      • GCC COUNTRIES Non-Alcoholic Beverages Market by Distribution Channel Type

        • Supermarkets
        • Convenience Stores
        • Online Retail
        • Specialty Stores
        • Food Service
      • GCC COUNTRIES Non-Alcoholic Beverages Market by Consumer Type

        • Adults
        • Children
        • Teenagers
        • Health-conscious Consumers
        • Athletes
      • GCC COUNTRIES Non-Alcoholic Beverages Market by Packaging Type

        • Bottles
        • Cans
        • Pouches
        • Tetra Packs
      • SOUTH AFRICA Outlook (USD Billion, 2019-2035)
      • SOUTH AFRICA Non-Alcoholic Beverages Market by Product Type

        • Carbonated Beverages
        • Juices
        • Functional Drinks
        • Dairy-based Drinks
        • Water
      • SOUTH AFRICA Non-Alcoholic Beverages Market by Distribution Channel Type

        • Supermarkets
        • Convenience Stores
        • Online Retail
        • Specialty Stores
        • Food Service
      • SOUTH AFRICA Non-Alcoholic Beverages Market by Consumer Type

        • Adults
        • Children
        • Teenagers
        • Health-conscious Consumers
        • Athletes
      • SOUTH AFRICA Non-Alcoholic Beverages Market by Packaging Type

        • Bottles
        • Cans
        • Pouches
        • Tetra Packs
      • REST OF MEA Outlook (USD Billion, 2019-2035)
      • REST OF MEA Non-Alcoholic Beverages Market by Product Type

        • Carbonated Beverages
        • Juices
        • Functional Drinks
        • Dairy-based Drinks
        • Water
      • REST OF MEA Non-Alcoholic Beverages Market by Distribution Channel Type

        • Supermarkets
        • Convenience Stores
        • Online Retail
        • Specialty Stores
        • Food Service
      • REST OF MEA Non-Alcoholic Beverages Market by Consumer Type

        • Adults
        • Children
        • Teenagers
        • Health-conscious Consumers
        • Athletes
      • REST OF MEA Non-Alcoholic Beverages Market by Packaging Type

        • Bottles
        • Cans
        • Pouches
        • Tetra Packs
    Non Alcoholic Beverages Market Research Report-Forecast to 2035 Infographic
    Free Sample Request

    Kindly complete the form below to receive a free sample of this Report

    Customer Strories

    “I am very pleased with how market segments have been defined in a relevant way for my purposes (such as "Portable Freezers & refrigerators" and "last-mile"). In general the report is well structured. Thanks very much for your efforts.”

    Victoria Milne Founder
    Case Study

    Chemicals and Materials