• Cat-intel
  • MedIntelliX
  • Resources
  • About Us
  • Request Free Sample ×

    Kindly complete the form below to receive a free sample of this Report

    Leading companies partner with us for data-driven Insights

    clients tt-cursor

    Web3 Marketing Market

    ID: MRFR/ICT/10723-CR
    137 Pages
    Aarti Dhapte
    December 2024

    Web3 Marketing Market Research Report By Type (Public ,Private, Consortium, Hybrid), By application (NFT Marketing, Metaverse Marketing, Content Marketing, social media marketing, influencer marketing, public relations, pay-per-click marketing, and others),By Industry Vertical (BFSI, Retail & e-Commerce, Media & Entertainment, pharmaceuticals, IT & Telecom, and others) and By Region (North America, Europe, Asia-Pacific, Middle East and Africa, South America) –Market Forecast Till 2032

    Share:
    Download PDF ×

    We do not share your information with anyone. However, we may send you emails based on your report interest from time to time. You may contact us at any time to opt-out.

    Web3 Marketing Market Research Report – Forecast till 2032 Infographic
    Purchase Options
    $ 4,950.0
    $ 5,950.0
    $ 7,250.0
    Table of Contents

    Web3 Marketing Market Summary

    As per Market Research Future Analysis, the Web3 Marketing Market was valued at USD 1,588.9 million in 2023 and is projected to reach USD 12,879.2 million by 2032, growing at a CAGR of 26.5% from 2024 to 2032. This market leverages blockchain and decentralized platforms to create transparent, community-driven marketing strategies, enhancing user control over data and enabling privacy-respecting advertising. Key applications include NFT marketing, which held a 15.9% market share in 2023, and the BFSI sector, which dominated the industry verticals. North America led the market in 2023, driven by the increasing adoption of Web3 technologies in digital marketing.

    Key Market Trends & Highlights

    The Web3 Marketing Market is characterized by significant growth opportunities driven by transparency and decentralized technologies.

    • Market Size in 2023: USD 1,588.9 million
    • Projected Market Size by 2032: USD 12,879.2 million
    • CAGR from 2024 to 2032: 26.5%
    • Largest Market Share in 2023: North America

    Market Size & Forecast

    2023 Market Size USD 1,588.9 million
    2024 Projected Market Size USD 1,966.6 million
    2032 Projected Market Size USD 12,879.2 million

    Major Players

    Key Companies include Roketto, Coinbound, Crowdcreate, Single Grain, Blockwiz, Lunar Strategy, Ninja Promo, Rehab Agency, Kryptonite, CryptoArmy, ICODA, Viral Nation, NeoReach, NinjaPromo, TechnoSuite, GuerrillaBuzz.

    Web3 Marketing Market Trends

    The evolution of decentralized technologies is reshaping marketing strategies, compelling brands to engage with consumers in more transparent and interactive ways, thereby fostering a new era of digital communication.

    U.S. Department of Commerce

    Web3 Marketing Market Drivers

    Market Growth Projections

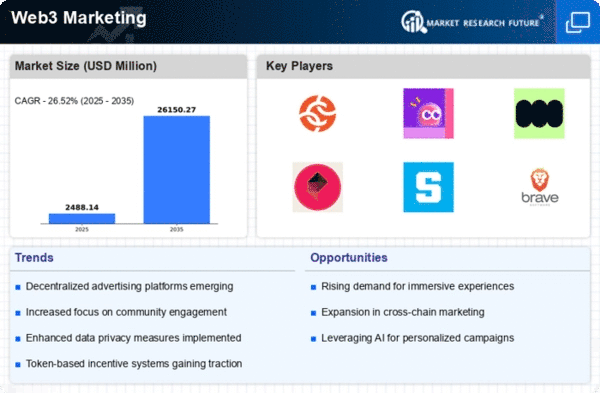
    The Global Web3 Marketing Market Industry is poised for substantial growth, with projections indicating a market size of 1.97 USD Billion in 2024 and an impressive increase to 26.1 USD Billion by 2035. This growth trajectory suggests a compound annual growth rate of 26.49% from 2025 to 2035, highlighting the increasing importance of Web3 technologies in marketing strategies. As businesses adapt to the evolving landscape, the integration of decentralized technologies into marketing practices is likely to become a standard approach. This chart illustrates the anticipated growth, emphasizing the potential for innovation and investment in the Web3 marketing sector.

    Emergence of New Revenue Models

    The emergence of new revenue models, such as tokenization and decentralized finance (DeFi), is reshaping the Global Web3 Marketing Market Industry. These models allow businesses to explore innovative ways to monetize their products and services, creating new opportunities for marketers. For instance, brands are now able to issue tokens that provide users with unique benefits, fostering loyalty and engagement. As these models gain traction, marketing strategies must evolve to effectively communicate the value propositions associated with them. The market's projected growth indicates that these new revenue streams will play a crucial role in shaping future marketing efforts.

    Increased Focus on Consumer Privacy

    Consumer privacy concerns are driving changes in marketing strategies within the Global Web3 Marketing Market Industry. As regulations around data protection tighten globally, businesses are compelled to adopt practices that prioritize user privacy. This shift is leading to the development of marketing solutions that respect consumer data rights while still delivering targeted advertising. Companies that successfully navigate these challenges are likely to gain a competitive edge. The anticipated growth of the market to 26.1 USD Billion by 2035 suggests that privacy-centric marketing approaches will become increasingly vital in the coming years.

    Rising Adoption of Blockchain Technology

    The increasing adoption of blockchain technology is a primary driver of the Global Web3 Marketing Market Industry. As businesses and consumers recognize the benefits of decentralized systems, marketing strategies are evolving to leverage blockchain's transparency and security. This shift is evident in various sectors, including finance and supply chain, where companies are implementing blockchain solutions to enhance trust and engagement. The Global Web3 Marketing Market is projected to reach 1.97 USD Billion in 2024, reflecting the growing interest in decentralized marketing approaches that utilize blockchain technology.

    Expansion of Global Internet Accessibility

    The expansion of global internet accessibility is a significant driver of the Global Web3 Marketing Market Industry. As more individuals gain access to the internet, particularly in developing regions, the potential customer base for Web3 applications and services expands. This increased connectivity enables marketers to reach a broader audience, fostering engagement and participation in decentralized platforms. The growth in internet users is likely to correlate with the rising demand for Web3 solutions, further propelling market growth. The anticipated market size of 1.97 USD Billion in 2024 underscores the importance of this trend in shaping the future of marketing.

    Growing Demand for Decentralized Applications

    The demand for decentralized applications (dApps) is surging, significantly impacting the Global Web3 Marketing Market Industry. dApps offer users enhanced privacy and control over their data, which resonates with the increasing consumer preference for data ownership. This trend is particularly pronounced in sectors such as gaming and finance, where dApps are transforming user experiences. As more developers create innovative dApps, marketing strategies must adapt to promote these platforms effectively. The market is expected to witness a compound annual growth rate of 26.49% from 2025 to 2035, indicating a robust future for marketing in the dApp space.

    Market Segment Insights

    Web3 Marketing Market Type Insights

    Based on the Type , the market is segmented into public, private, consortium and hybrid marketing. The Private segment accounted for the largest market share of 39.1% in 2023. Private web3 marketing is only accessible by invitation, and anyone wishing to use it must first obtain authorization from the governing body. They provide various access levels, allowing users to create, view, and edit the blockchain. Organizations in this situation use distributed ledger technology but do not make their data public. Each user on a private web3 marketing must have a validated identity, as this determines the level of access.

    This structure ensures that sensitive information remains protected, making private Web3 marketing particularly suited for sectors like finance, healthcare, and luxury brands that require a high level of control and trust.

    FIGURE 2: WEB3 MARKETING MARKET, BY TYPE, 2023 VS 2032 (USD MILLION)

    Source: Secondary Research, Primary Research, Market Research Future Database, and Analyst Review

    Web3 Marketing Market Applications Insights

    Based on the Application, the Web3 Marketing Market is bifurcated into NFT Marketing, Metaverse Marketing, Content Marketing, social media marketing, influencer marketing, public relations, pay-per-click marketing, and others. The NFT marketing segment accounted for the largest market share of 15.9% in 2023. NFT marketing refers to marketing a non-fungible token or NFT marketplace to send more traffic and sales to a particular non fungible token platform. The use of web3 technologies in NFT marketing is for several applications which includes decentralized ownership, smart contracts, tokenization and gamification, among others.

    For instance, a fashion brand might release a limited number of virtual clothing items or accessories as NFTs, giving owners unique virtual items that enhance their online identity or gaming avatars.

    Web3 Marketing Market Industry Vertical Insights

    Based on the Industry Vertical , the global web3 market has been bifurcated into BFSI, Retail & e-Commerce, Media & Entertainment, pharmaceuticals, IT & Telecom, and others. The BFSI segment accounted for the largest market share in 2023 . Web3 marketing technology in the BFSI (Banking, Financial Services, and Insurance) industry refers to the use of decentralized web technologies such as blockchain, smart contracts, and decentralized applications (dApps), to transform marketing and customer interaction. It has created more secure, transparent, and personalized experiences for customers by utilizing decentralized networks and data ownership models.

    Get more detailed insights about Web3 Marketing Market Research Report – Forecast till 2032

    Regional Insights

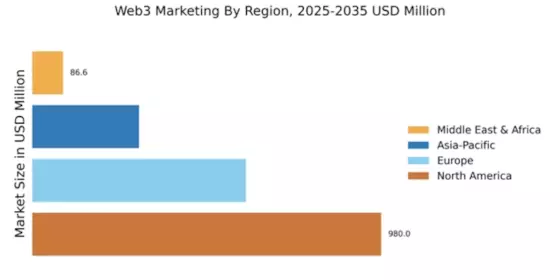
    By Region, the study provides market insights into North America, Europe, Asia-Pacific, Middle East and Africa and South America.  North America accounted for the largest market share in Web3 Marketing Market in 2023. The increasing acceptance of web 3 in day-to-day life, particularly in terms of digital marketing, has shown to be beneficial to people and businesses in North America. Businesses to thrive, particularly retail businesses in the United States, have a thorough understanding of cryptocurrencies and blockchain to ideally develop a better digital marketing strategy to increase sales, income, and profit.

    Europe is also at rising pace in web3 marketing market with increasing adoption of this web3 as a new technology stack built on blockchain and it leverages decentralized & distributed architecture to increase privacy, security, as well as transparency. It can also be used as a marketing tool by companies if privacy protection issues can be overcome. This new epoch of social interconnectivity is creating an architecture for decentralized trust, making information verifiable and empowering EU citizens.

    The Web3 Marketing market in the Asia Pacific region is undergoing substantial development and transformation, which is being driven by a variety of major factors. APAC is home to some of the world’s most technologically advanced and digitally connected populations, particularly in countries like South Korea, Japan, China, Singapore, and India. These nations have strong infrastructure for internet access, mobile usage, and social media engagement, making them ideal markets for the adoption of Web3 technologies. Further, the major countries studied in the market report are the U.S., Canada, Mexico, Germany, UK, France, China, Japan, India.

    FIGURE 3: WEB3 MARKETING MARKET SIZE BY REGION 2023 VS 2032

    WEB3 MARKETING MARKET SIZE BY REGION 2023 VS 2032

    Source: Secondary Research, Primary Research, Market Research Future Database, and Analyst Review

    Key Players and Competitive Insights

    The Web3 Marketing Market is characterized by the presence of many global, regional, and local vendors. The Web3 Marketing Market has witnessed significant growth over the forecast period due to rising adoption of blockchain technologies, increasing consumer demand for decentralized platforms, and the growing popularity of cryptocurrency and NFTs. There are several domestic, regional, and global players operating in the Web3 Marketing Market who continuously strive to gain a significant share of the overall market. During the study, MRFR has analyzed some of the major players in the Web3 Marketing Market who have contributed to the market growth.

    During the study, MRFR has analyzed some of the major players in the Web3 Marketing Market who have contributed to the market growth includes Roketto, Coinbound, Crowdcreate, Single Grain, Blockwiz, Lunar Strategy, Ninja Promo, Rehab Agency, Kryptonite, CryptoArmy, ICODA, Viral Nation, NeoReach, NinjaPromo, TechnoSuite, GuerrillaBuzz.

    These players focus on expanding and enhancing their product portfolio and services to remain competitive and increase their customer base. Additionally, these players are focusing on partnerships & collaborations to expand their business and customer base to enhance their market position.

    Key Companies in the Web3 Marketing Market market include

    Industry Developments

    • In November 2023, Amazon Web Services, Animoca Brands, and Polygon Labs entered into collaboration agreement to support Web 3.0 developers and accelerate the development of Web 3.0 products and services. In this collaboration, the companies announced MoonRealm Express Accelerator program that allows builders across the world to fast-track the development in emerging areas such as SocialFi, GameFi, decentralized identity and encourage builders to develop new ideas and solutions on Mocaverse.
    • In September 2023, Coinbase Global, Inc., a leading crypto exchange entered into partnership with Truflation, an economic data provider, to support Web3 and Blockchain technologies. This partnership aims to offer real-time inflation information required to expand Web3 and blockchain ecosystem.

    Web3 Marketing Market Segmentation

    Web3 Marketing  Type Outlook

      • Public
      • Private
      • Consortium
      • Hybrid marketing

    Web3 Marketing Application Outlook

      • NFT Marketing
      • Metaverse Marketing
      • Social media marketing
      • Influencer marketing
      • Public relations
      • Pay-per-click marketing
      • others.

    Web3 Marketing Industry Vertical Outlook

      • BFSI
      • Retail & e-Commerce
      • Media & Entertainment
      • Pharmaceuticals
      • IT & Telecom
      • Others

     Web3 Marketing Regional Outlook

      • North America
        • US
        • Canada
        • Mexico
      • Europe
        • Germany
        • UK
        • France
        • Rest of Europe
      • Asia-Pacific
        • China
        • Japan
        • India
        • Rest of Asia-Pacific
      • Middle East & Africa
    • South America & Central America

    Future Outlook

    Web3 Marketing Market Future Outlook

    The Web3 Marketing Market is poised for robust growth, driven by technological advancements and consumer engagement strategies, with a projected 26.49% CAGR from 2024 to 2035.

    New opportunities lie in:

    • Leverage decentralized platforms for targeted advertising campaigns.
    • Develop innovative loyalty programs utilizing blockchain technology.
    • Create immersive brand experiences through virtual reality in Web3 environments.

    By 2035, the Web3 Marketing Market is expected to achieve substantial growth, reflecting evolving consumer preferences and technological integration.

    Market Segmentation

    Web3 Marketing  Type Outlook

    • Public
    • Private
    • Consortium
    • Hybrid marketing

     Web3 Marketing Regional Outlook

    North America
    • US
    • Canada
    • Mexico

    Web3 Marketing Application Outlook

    • NFT Marketing
    • Metaverse Marketing
    • Content Marketing
    • Social media marketing
    • Influencer marketing
    • Public relations
    • Pay-per-click marketing
    • others.

    Web3 Marketing Industry Vertical Outlook

    • BFSI
    • Retail & e-Commerce
    • Media & Entertainment
    • Pharmaceuticals
    • IT & Telecom
    • Others

    Report Scope

    Report Attribute/Metric Details
    Market Size 2023 USD 1,588.9 million
    Market Size 2024 USD 1,966.6 million
    Market Size 2032 USD 12,879.2 million
    Compound Annual Growth Rate (CAGR) 26.5% (2024-2032)
    Base Year 2023
    Market Forecast Period 2024-2032
    Historical Data 2019- 2022
    Market Forecast Units Value (USD Million)
    Report Coverage Revenue Forecast, Market Competitive Landscape, Growth Factors, and Trends
    Segments Covered Type ,Application, Industry Vertical and Region
    Geographies Covered Europe, North America, Asia-Pacific, Middle East & Africa, and South America
    Countries Covered U.S., Canada, Mexico, Germany, UK, France, China, Japan, India
    Key Companies Profiled ·          Roketto ·          Coinbound ·         Crowdcreate ·         Single Grain ·         Blockwiz ·          Lunar Strategy ·          Ninja Promo ·         Rehab Agency ·         Kryptonite ·          CryptoArmy ·          ICODA ·          Viral Nation ·          NeoReach ·          NinjaPromo ·          TechnoSuite ·         GuerrillaBuzz
    Key Market Opportunities ·         Increased transparency with the decentralized network ·         Web3 Gaming and Play-to-Earn Models
    Key Market Dynamics ·         Growth of decentralized applications (dApps) ·         Increasing investment in web3 marketing

    Market Highlights

    Author
    Aarti Dhapte
    Team Lead - Research

    She holds an experience of about 6+ years in Market Research and Business Consulting, working under the spectrum of Information Communication Technology, Telecommunications and Semiconductor domains. Aarti conceptualizes and implements a scalable business strategy and provides strategic leadership to the clients. Her expertise lies in market estimation, competitive intelligence, pipeline analysis, customer assessment, etc.

    Leave a Comment

    FAQs

    How much is the Web3 Marketing Market?

    The Web3 Marketing Market size is expected to be valued at USD 1,588.9 Million in 2023.

    What is the growth rate of the Web3 Marketing Market?

    The global market is projected to grow at a CAGR of 26.5% during the forecast period, 2024-2032.

    Which region held the largest market share in the Web3 Marketing Market?

    North America had the largest share of the global market.

    Who are the key players in the Web3 Marketing Market?

    The key players in the market are Roketto, Coinbound, Crowdcreate, Single Grain, Blockwiz, Lunar Strategy, Ninja Promo, Rehab Agency, Kryptonite, CryptoArmy, ICODA, Viral Nation, NeoReach, NinjaPromo, TechnoSuite, GuerrillaBuzz.

    Which Type led the Web3 Marketing Market?

    The Private segment dominated the market in 2023.

    1. EXECUTIVE SUMMARY 15
      1. MARKET
    2. ATTRACTIVENESS ANALYSIS 17
    3. MARKET INTRODUCTION 18
      1. DEFINITION 18
      2. SCOPE OF THE STUDY 18
      3. RESEARCH OBJECTIVE 18
      4. MARKET STRUCTURE
    4. RESEARCH METHODOLOGY 20
    5. MARKET DYNAMICS 26
      1. INTRODUCTION
      2. DRIVERS 26
        1. GROWTH OF DECENTRALIZED APPLICATIONS (DAPPS) 26
        2. INCREASING INVESTMENT IN WEB3 MARKETING 27
      3. RESTRAINTS 28
    6. HIGH COST OF WEB3 MARKETING SERVICES 28
      1. OPPORTUNITIES 29
        1. INCREASED
    7. TRANSPARENCY WITH THE DECENTRALIZED NETWORK 29
      1. COVID-19 IMPACT ANALYSIS
        1. IMPACT OF COVID-19 ON OVERALL ECONOMY 29
        2. IMPACT OF COVID-19
    8. ON WEB3 MARKETING PROVIDERS 30
    9. MARKET FACTOR ANALYSIS 31
      1. SUPPLY
    10. CHAIN ANALYSIS 31
      1. BACKEND SUPPORT (RAW MATERIALS AND TECHNOLOGY PROVIDERS)
        1. WEB3 MARKETING TECHNOLOGY DEVELOPMENT 31
        2. DEMAND MANAGEMENT
      2. PORTER'S FIVE FORCES MODEL 33
        1. THREAT OF NEW ENTRANTS 33
        2. BARGAINING POWER OF SUPPLIERS 33
        3. THREAT OF SUBSTITUTES 34
        4. BARGAINING POWER OF BUYERS 34
        5. INTENSITY OF RIVALRY 34
    11. OULOOK ON AI ON MARKETING 34
      1. OUTLOOK ON BLOCKCHAIN IN MARKETING 35
    12. OUTLOOK ON WEB3 IN MARKETING 35
      1. MARKET AND TECHNOLOGICAL TRENDS 36
    13. NON-FUNGIBLE TOKENS (NFTS) INTEGRATION IN MARKETING 36
      1. DECENTRALISED
    14. SOCIAL MEDIA 36
      1. MARKET SWOT ANALYSIS 37
    15. GLOBAL WEB3 MARKETING MARKET,
    16. BY TYPE 39
      1. OVERVIEW 39
        1. GLOBAL WEB3 MARKETING MARKET, BY TYPE,
    17. –2032 (USD MILLION) 40
      1. PUBLIC 40
      2. PRIVATE 40
    18. CONSORTIUM 40
      1. HYBRID 40
    19. GLOBAL WEB3 MARKETING MARKET, BY APPLICATION
      1. OVERVIEW 41
        1. GLOBAL WEB3 MARKETING MARKET, BY APPLICATION,
    20. –2032 (USD MILLION) 42
      1. NFT MARKETING 42
      2. METAVERSE MARKETING
      3. CONTENT MARKETING 42
      4. SOCIAL MEDIA MARKETING 42
      5. INFLUENCER
    21. MARKETING 43
      1. PUBLIC-RELATION 43
      2. PAY-PER-CLICK (PPC) ADVERTISING
      3. OTHERS 43
    22. GLOBAL WEB3 MARKETING MARKET, BY INDUSTRY VERTICAL
      1. OVERVIEW 44
        1. GLOBAL WEB3 MARKETING MARKET, BY INDUSTRY VERTICAL,
    23. –2032 (USD MILLION) 45
      1. BFSI 45
      2. RETAIL & E-COMMERCE
      3. MEDIA & ENTERTAINMENT 45
      4. PHARMACEUTICALS 46
      5. IT
    24. & TELECOM 46
      1. OTHERS 46
    25. GLOBAL WEB3 MARKETING MARKET, BY REGION
      1. OVERVIEW 47
        1. GLOBAL WEB3 MARKETING MARKET, BY REGION, 2023
    26. VS 2032 (USD MILLION) 47
      1. GLOBAL WEB3 MARKETING MARKET, BY REGION, 2019–2032
    27. (USD MILLION) 48
      1. NORTH AMERICA 49
        1. NORTH AMERICA: WEB3 MARKETING
    28. MARKET, BY COUNTRY, 2019–2032 (USD MILLION) 51
      1. NORTH AMERICA WEB3
    29. MARKETING MARKET, BY TYPE, 2019–2032 (USD MILLION) 51
      1. NORTH AMERICA
    30. WEB3 MARKETING MARKET, BY APPLICATION, 2019–2032 (USD MILLION) 52
    31. NORTH AMERICA WEB3 MARKETING MARKET, BY INDUSTRY VERTICAL, 2019–2032 (USD
    32. MILLION) 53
      1. US 55
        1. US WEB3 MARKETING MARKET, BY TYPE, 2019–2032
    33. (USD MILLION) 55
      1. US WEB3 MARKETING MARKET, BY APPLICATION, 2019–2032
    34. (USD MILLION) 55
      1. US WEB3 MARKETING MARKET, BY INDUSTRY VERTICAL, 2019–2032
    35. (USD MILLION) 56
      1. CANADA 57
        1. CANADA WEB3 MARKETING MARKET,
    36. BY TYPE, 2019–2032 (USD MILLION) 57
      1. CANADA WEB3 MARKETING MARKET,
    37. BY APPLICATION, 2019–2032 (USD MILLION) 57
      1. CANADA WEB3 MARKETING
    38. MARKET, BY INDUSTRY VERTICAL, 2019–2032 (USD MILLION) 58
      1. MEXICO
        1. MEXICO WEB3 MARKETING MARKET, BY TYPE, 2019–2032 (USD MILLION)
        2. MEXICO WEB3 MARKETING MARKET, BY APPLICATION, 2019–2032 (USD
    39. MILLION) 59
      1. MEXICO WEB3 MARKETING MARKET, BY INDUSTRY VERTICAL, 2019–2032
    40. (USD MILLION) 60
      1. EUROPE 61
        1. EUROPE: WEB3 MARKETING MARKET, BY
    41. COUNTRY, 2019–2032 (USD MILLION) 62
      1. EUROPE WEB3 MARKETING MARKET,
    42. BY TYPE, 2019–2032 (USD MILLION) 63
      1. EUROPE WEB3 MARKETING MARKET,
    43. BY APPLICATION, 2019–2032 (USD MILLION) 64
      1. EUROPE WEB3 MARKETING
    44. MARKET, BY INDUSTRY VERTICAL, 2019–2032 (USD MILLION) 65
      1. GERMANY
        1. GERMANY WEB3 MARKETING MARKET, BY TYPE, 2019–2032 (USD MILLION)
        2. GERMANY WEB3 MARKETING MARKET, BY APPLICATION, 2019–2032 (USD
    45. MILLION) 67
      1. GERMANY WEB3 MARKETING MARKET, BY INDUSTRY VERTICAL, 2019–2032
    46. (USD MILLION) 68
      1. UK 69
        1. UK WEB3 MARKETING MARKET, BY TYPE,
    47. –2032 (USD MILLION) 69
      1. UK WEB3 MARKETING MARKET, BY APPLICATION,
    48. –2032 (USD MILLION) 69
      1. UK WEB3 MARKETING MARKET, BY INDUSTRY
    49. VERTICAL, 2019–2032 (USD MILLION) 70
      1. FRANCE 71
        1. FRANCE
    50. WEB3 MARKETING MARKET, BY TYPE, 2019–2032 (USD MILLION) 71
      1. FRANCE
    51. WEB3 MARKETING MARKET, BY APPLICATION, 2019–2032 (USD MILLION) 71
    52. FRANCE WEB3 MARKETING MARKET, BY INDUSTRY VERTICAL, 2019–2032 (USD MILLION)
      1. REST OF EUROPE 73
        1. REST OF EUROPE WEB3 MARKETING MARKET,
    53. BY TYPE, 2019–2032 (USD MILLION) 73
      1. REST OF EUROPE WEB3 MARKETING
    54. MARKET, BY APPLICATION, 2019–2032 (USD MILLION) 73
      1. REST OF EUROPE
    55. WEB3 MARKETING MARKET, BY INDUSTRY VERTICAL, 2019–2032 (USD MILLION) 74
      1. ASIA-PACIFIC 75
        1. ASIA-PACIFIC: WEB3 MARKETING MARKET, BY COUNTRY,
    56. –2032 (USD MILLION) 76
      1. ASIA-PACIFIC WEB3 MARKETING MARKET,
    57. BY TYPE, 2019–2032 (USD MILLION) 77
      1. ASIA-PACIFIC WEB3 MARKETING
    58. MARKET, BY APPLICATION, 2019–2032 (USD MILLION) 78
      1. ASIA-PACIFIC
    59. WEB3 MARKETING MARKET, BY INDUSTRY VERTICAL, 2019–2032 (USD MILLION) 79
      1. CHINA 81
        1. CHINA WEB3 MARKETING MARKET, BY TYPE, 2019–2032
    60. (USD MILLION) 81
      1. CHINA WEB3 MARKETING MARKET, BY APPLICATION, 2019–2032
    61. (USD MILLION) 81
      1. CHINA WEB3 MARKETING MARKET, BY INDUSTRY VERTICAL, 2019–2032
    62. (USD MILLION) 82
      1. INDIA 83
        1. INDIA WEB3 MARKETING MARKET, BY
    63. TYPE, 2019–2032 (USD MILLION) 83
      1. INDIA WEB3 MARKETING MARKET,
    64. BY APPLICATION, 2019–2032 (USD MILLION) 83
      1. INDIA WEB3 MARKETING
    65. MARKET, BY INDUSTRY VERTICAL, 2019–2032 (USD MILLION) 84
      1. JAPAN
        1. JAPAN WEB3 MARKETING MARKET, BY TYPE, 2019–2032 (USD MILLION)
        2. JAPAN WEB3 MARKETING MARKET, BY APPLICATION, 2019–2032 (USD
    66. MILLION) 85
      1. JAPAN WEB3 MARKETING MARKET, BY INDUSTRY VERTICAL, 2019–2032
    67. (USD MILLION) 86
      1. REST OF ASIA PACIFIC 87
        1. REST OF ASIA PACIFIC
    68. WEB3 MARKETING MARKET, BY TYPE, 2019–2032 (USD MILLION) 87
      1. REST
    69. OF ASIA PACIFIC WEB3 MARKETING MARKET, BY APPLICATION, 2019–2032 (USD MILLION)
      1. REST OF ASIA PACIFIC WEB3 MARKETING MARKET, BY INDUSTRY VERTICAL,
    70. –2032 (USD MILLION) 88
      1. MIDDLE EAST & AFRICA 89
    71. MIDDLE EAST & AFRICA WEB3 MARKETING MARKET, BY TYPE, 2019–2032 (USD MILLION)
      1. MIDDLE EAST & AFRICA WEB3 MARKETING MARKET, BY APPLICATION, 2019–2032
    72. (USD MILLION) 91
      1. MIDDLE EAST & AFRICA WEB3 MARKETING MARKET, BY INDUSTRY
    73. VERTICAL, 2019–2032 (USD MILLION) 92
      1. SOUTH AMERICA 94
    74. SOUTH AMERICA WEB3 MARKETING MARKET, BY TYPE, 2019–2032 (USD MILLION) 94
      1. SOUTH AMERICA WEB3 MARKETING MARKET, BY APPLICATION, 2019–2032 (USD
    75. MILLION) 96
      1. SOUTH AMERICA WEB3 MARKETING MARKET, BY INDUSTRY VERTICAL,
    76. –2032 (USD MILLION) 97
    77. COMPETITIVE LANDSCAPE 99
      1. COMPETITIVE
    78. BENCHMARKING 99
      1. VENDOR SHARE ANALYSIS 101
      2. RECENT DEVELOPMENTS
        1. PRODUCT LAUNCH/DEVELOPMENT 101
        2. BUSINESS EXPANSION 102
        3. PARTNERSHIPS & COLLABORATIONS 102
    79. COMPANY PROFILE 104
    80. ROKETTO 104
      1. COMPANY OVERVIEW 104
        1. FINANCIAL OVERVIEW 104
        2. SERVICES OFFERED 104
        3. KEY DEVELOPMENTS 105
        4. SWOT
    81. ANALYSIS 105
      1. KEY STRATEGIES 106
      2. COINBOUND 107
    82. COMPANY OVERVIEW 107
      1. FINANCIAL OVERVIEW 107
        1. SERVICES OFFERED
        2. KEY DEVELOPMENTS 107
        3. SWOT ANALYSIS 107
        4. KEY
    83. STRATEGIES 108
      1. CROWDCREATE 109
        1. COMPANY OVERVIEW 109
    84. FINANCIAL OVERVIEW 109
      1. SERVICES OFFERED 109
        1. KEY DEVELOPMENTS
        2. SWOT ANALYSIS 110
        3. KEY STRATEGIES 110
      2. SINGLE
    85. GRAIN 111
      1. COMPANY OVERVIEW 111
        1. FINANCIAL OVERVIEW 111
        2. SERVICES OFFERED 112
        3. KEY DEVELOPMENTS 112
        4. SWOT
    86. ANALYSIS 112
      1. KEY STRATEGIES 113
      2. BLOCKWIZ 114
        1. COMPANY
    87. OVERVIEW 114
      1. FINANCIAL OVERVIEW 114
        1. SERVICES OFFERED 114
        2. KEY DEVELOPMENTS 114
        3. SWOT ANALYSIS 114
        4. KEY STRATEGIES
      2. LUNAR STRATEGY 116
        1. COMPANY OVERVIEW 116
        2. FINANCIAL
    88. OVERVIEW 116
      1. SERVICES OFFERED 116
        1. KEY DEVELOPMENTS 116
        2. SWOT ANALYSIS 117
        3. KEY STRATEGIES 117
      2. NINJA PROMO
        1. COMPANY OVERVIEW 118
        2. FINANCIAL OVERVIEW 118
    89. SERVICES OFFERED 118
      1. KEY DEVELOPMENTS 118
        1. SWOT ANALYSIS
        2. KEY STRATEGIES 119
      2. REHAB AGENCY 120
        1. COMPANY
    90. OVERVIEW 120
      1. FINANCIAL OVERVIEW 120
        1. SERVICES OFFERED 120
        2. KEY DEVELOPMENTS 121
        3. SWOT ANALYSIS 121
        4. KEY STRATEGIES
      2. KRYPTONITE AGENCY 122
        1. COMPANY OVERVIEW 122
    91. FINANCIAL OVERVIEW 122
      1. SERVICES OFFERED 122
        1. KEY DEVELOPMENTS
        2. SWOT ANALYSIS 123
        3. KEY STRATEGIES 123
      2. CRYPTOARMY
        1. COMPANY OVERVIEW 124
        2. FINANCIAL OVERVIEW 124
    92. SERVICES OFFERED 124
      1. KEY DEVELOPMENTS 124
        1. SWOT ANALYSIS
        2. KEY STRATEGIES 125
      2. ICODA 126
        1. COMPANY OVERVIEW
        2. FINANCIAL OVERVIEW 126
        3. PRODUCTS/SOLUTIONS/SERVICES
    93. OFFERED 126
      1. KEY DEVELOPMENTS 127
        1. SWOT ANALYSIS 127
        2. KEY STRATEGIES 127
      2. VIRAL NATION 128
        1. COMPANY OVERVIEW
        2. FINANCIAL OVERVIEW 128
        3. SERVICES OFFERED 128
    94. KEY DEVELOPMENTS 128
      1. SWOT ANALYSIS 129
        1. KEY STRATEGIES
      2. NEOREACH 131
        1. COMPANY OVERVIEW 131
        2. FINANCIAL
    95. OVERVIEW 131
      1. PRODUCTS/SOLUTIONS/SERVICES OFFERED 131
        1. KEY
    96. DEVELOPMENTS 131
      1. SWOT ANALYSIS 132
        1. KEY STRATEGIES 132
      2. GUERILLABUZZ 133
        1. COMPANY OVERVIEW 133
        2. FINANCIAL
    97. OVERVIEW 133
      1. PRODUCTS/SOLUTIONS/SERVICES OFFERED 133
        1. KEY
    98. DEVELOPMENTS 133
      1. SWOT ANALYSIS 133
        1. KEY STRATEGIES 134
      2. TOKENSUITE 135
        1. COMPANY OVERVIEW 135
        2. FINANCIAL
    99. OVERVIEW 135
      1. PRODUCTS/SOLUTIONS/SERVICES OFFERED 135
        1. KEY
    100. DEVELOPMENTS 135
      1. SWOT ANALYSIS 135
        1. KEY STRATEGIES 136
    101. GLOBAL WEB3 MARKETING MARKET, BY TYPE, 2019–2032 (USD MILLION) 40
    102. GLOBAL WEB3 MARKETING MARKET, BY APPLICATION, 2019–2032 (USD MILLION) 42
    103. MILLION) 45
    104. (USD MILLION) 48
    105. (USD MILLION) 51
    106. (USD MILLION) 51
    107. –2032 (USD MILLION) 52
    108. BY INDUSTRY VERTICAL, 2019–2032 (USD MILLION) 53
    109. MARKET, BY TYPE, 2019–2032 (USD MILLION) 55
    110. MARKET, BY APPLICATION, 2019–2032 (USD MILLION) 55
    111. MARKET, BY INDUSTRY VERTICAL, 2019–2032 (USD MILLION) 56
    112. WEB3 MARKETING MARKET, BY TYPE, 2019–2032 (USD MILLION) 57
    113. WEB3 MARKETING MARKET, BY APPLICATION, 2019–2032 (USD MILLION) 57
    114. CANADA WEB3 MARKETING MARKET, BY INDUSTRY VERTICAL, 2019–2032 (USD MILLION)
    115. MILLION) 59
    116. (USD MILLION) 60
    117. (USD MILLION) 62
    118. (USD MILLION) 63
    119. (USD MILLION) 64
    120. –2032 (USD MILLION) 65
    121. TYPE, 2019–2032 (USD MILLION) 67
    122. BY APPLICATION, 2019–2032 (USD MILLION) 67
    123. MARKET, BY INDUSTRY VERTICAL, 2019–2032 (USD MILLION) 68
    124. WEB3 MARKETING MARKET, BY TYPE, 2019–2032 (USD MILLION) 69
    125. WEB3 MARKETING MARKET, BY APPLICATION, 2019–2032 (USD MILLION) 69
    126. UK WEB3 MARKETING MARKET, BY INDUSTRY VERTICAL, 2019–2032 (USD MILLION)
    127. MILLION) 71
    128. (USD MILLION) 72
    129. (USD MILLION) 73
    130. –2032 (USD MILLION) 73
    131. BY INDUSTRY VERTICAL, 2019–2032 (USD MILLION) 74
    132. WEB3 MARKETING MARKET, BY COUNTRY, 2019–2032 (USD MILLION) 76
    133. ASIA-PACIFIC WEB3 MARKETING MARKET, BY TYPE, 2019–2032 (USD MILLION) 77
    134. MILLION) 78
    135. –2032 (USD MILLION) 79
    136. –2032 (USD MILLION) 81
    137. –2032 (USD MILLION) 81
    138. VERTICAL, 2019–2032 (USD MILLION) 82
    139. BY TYPE, 2019–2032 (USD MILLION) 83
    140. BY APPLICATION, 2019–2032 (USD MILLION) 83
    141. MARKET, BY INDUSTRY VERTICAL, 2019–2032 (USD MILLION) 84
    142. WEB3 MARKETING MARKET, BY TYPE, 2019–2032 (USD MILLION) 85
    143. WEB3 MARKETING MARKET, BY APPLICATION, 2019–2032 (USD MILLION) 85
    144. JAPAN WEB3 MARKETING MARKET, BY INDUSTRY VERTICAL, 2019–2032 (USD MILLION)
    145. (USD MILLION) 87
    146. –2032 (USD MILLION) 87
    147. MARKET, BY INDUSTRY VERTICAL, 2019–2032 (USD MILLION) 88
    148. EAST & AFRICA WEB3 MARKETING MARKET, BY TYPE, 2019–2032 (USD MILLION)
    149. –2032 (USD MILLION) 91
    150. MARKET, BY INDUSTRY VERTICAL, 2019–2032 (USD MILLION) 92
    151. AMERICA WEB3 MARKETING MARKET, BY TYPE, 2019–2032 (USD MILLION) 94
    152. SOUTH AMERICA WEB3 MARKETING MARKET, BY APPLICATION, 2019–2032 (USD MILLION)
    153. (USD MILLION) 97
    154. EXPANSION 102
    155. : SERVICES OFFERED 104
    156. CROWDCREATE : SERVICES OFFERED 109
    157. KEY DEVELOPMENTS 116
    158. NINJA PROMO: KEY DEVELOPMENTS 118
    159. : KEY DEVELOPMENTS 123
    160. ICODA: SERVICES OFFERED 126
    161. VIRAL NATION : SERVICES OFFERED 128
    162. OFFERED 133
    163. LIST
    164. OF FIGURES
    165. BOTTOM-UP AND TOP-DOWN APPROACHES 24
    166. GLOBAL WEB 3 MARKETING MARKET 26
    167. RESTRAINTS IMPACT ANALYSIS 28
    168. MARKETING MARKET 31
    169. MARKETING MARKET 33
    170. GLOBAL WEB3 MARKETING MARKET, BY TYPE, 2023 VS 2032 (USD MILLION) 39
    171. GLOBAL WEB3 MARKETING MARKET, BY APPLICATION, 2023 (% SHARE) 41
    172. GLOBAL WEB3 MARKETING MARKET, BY APPLICATION, 2023 VS 2032 (USD MILLION) 41
    173. GLOBAL WEB3 MARKETING MARKET, BY INDUSTRY VERTICAL, 2023 (% SHARE) 44
    174. GLOBAL WEB3 MARKETING MARKET, BY INDUSTRY VERTICAL, 2023 VS 2032 (USD MILLION)
    175. (USD MILLION) 50
    176. (% SHARE) 51
    177. (USD MILLION) 51
    178. (% SHARE) 53
    179. VS 2032 (USD MILLION) 53
    180. BY INDUSTRY VERTICAL, 2023(% SHARE) 54
    181. MARKET, BY INDUSTRY VERTICAL, 2019-2032 (USD MILLION) 54
    182. MARKETING MARKET, BY COUNTRY, 2023 (% SHARE) 61
    183. MARKET, BY COUNTRY, 2023 VS 2032 (USD MILLION) 62
    184. MARKET, BY TYPE, 2023 (% SHARE) 63
    185. BY TYPE, 2023 VS 2032 (USD MILLION) 63
    186. BY APPLICATION, 2023 (% SHARE) 64
    187. APPLICATION, 2023 VS 2032(USD MILLION) 64
    188. BY INDUSTRY VERTICAL, 2023 (% SHARE) 65
    189. BY INDUSTRY VERTICAL, 2023 VS 2032 (USD MILLION) 66
    190. WEB3 MARKETING MARKET, BY COUNTRY, 2023 (% SHARE) 75
    191. WEB3 MARKETING MARKET, BY COUNTRY, 2023 VS 2032 (USD MILLION) 76
    192. ASIA-PACIFIC WEB3 MARKETING MARKET, BY TYPE, 2023 (% SHARE) 77
    193. WEB3 MARKETING MARKET, BY TYPE, 2023 VS 2032 (USD MILLION) 77
    194. WEB3 MARKETING MARKET, BY APPLICATION, 2023(% SHARE) 78
    195. WEB3 MARKETING MARKET, BY APPLICATION, 2023 VS 2032 (USD MILLION) 78
    196. ASIA-PACIFIC WEB3 MARKETING MARKET, BY INDUSTRY VERTICAL, 2023(% SHARE) 80
    197. (USD MILLION) 80
    198. BY TYPE, 2023 (% SHARE) 90
    199. MARKET, BY TYPE, 2023 VS 2032 (USD MILLION) 90
    200. AFRICA WEB3 MARKETING MARKET, BY APPLICATION, 2023(% SHARE) 91
    201. EAST & AFRICA WEB3 MARKETING MARKET, BY APPLICATION, 2023 VS 2032 (USD MILLION)
    202. (% SHARE) 93
    203. BY INDUSTRY VERTICAL, 2023 VS 2032 (USD MILLION) 93
    204. WEB3 MARKETING MARKET, BY TYPE, 2023(% SHARE) 95
    205. MARKETING MARKET, BY TYPE, 2023 VS 2032 (USD MILLION) 95
    206. WEB3 MARKETING MARKET, BY APPLICATION, 2023(% SHARE) 96
    207. WEB3 MARKETING MARKET, BY APPLICATION, 2023 VS 2032 (USD MILLION) 97
    208. SOUTH AMERICA WEB3 MARKETING MARKET, BY INDUSTRY VERTICAL, 2023 (% SHARE ) 98
    209. (USD MILLION) 98
    210. DASHBOARD: GLOBAL WEB3 MARKETING MARKET 103
    211. GRAIN: SWOT ANALYSIS 112
    212. ANALYSIS 121
    213. CRYPTOARMY: SWOT ANALYSIS 124
    214. VIRAL NATION : SWOT ANALYSIS 129
    215. Abbreviation Full Form
    216. US United
    217. States
    218. UK United Kingdom
    219. ME&A Middle East & Africa
    220. RoW Rest
    221. of the World
    222. CAGR Compound Annual Growth Rate

    Web3 Marketing  Market Segmentation

    Global Web3 Marketing  Type Outlook (USD million ,2019-2032)

    • Public
    • Private
    • Consortium
    • Hybrid marketing

    Global Web3 Marketing Application Outlook(USD million ,2019-2032)

    • NFT Marketing
    • Metaverse Marketing
    • Content Marketing
    • Social media marketing
    • Influencer marketing
    • Public relations
    • Pay-per-click marketing
    •  

    Global Web3 Marketing Industry Vertical Outlook(USD million ,2019-2032)

    • BFSI
    • Retail & e-Commerce
    • Media & Entertainment
    • Pharmaceuticals
    • IT & Telecom
    • Others

    Market Segmentation Tab

    North America Web3 Marketing  Type Outlook (USD million ,2019-2032)

    • Public
    • Private
    • Consortium
    • Hybrid marketing

    North America Web3 Marketing Application Outlook(USD million ,2019-2032)

    • NFT Marketing
    • Metaverse Marketing
    • Content Marketing
    • Social media marketing
    • Influencer marketing
    • Public relations
    • Pay-per-click marketing
    •  

    North America Web3 Marketing Industry Vertical Outlook(USD million ,2019-2032)

    • BFSI
    • Retail & e-Commerce
    • Media & Entertainment
    • Pharmaceuticals
    • IT & Telecom
    • Others

    US  Web3 Marketing  Type Outlook (USD million ,2019-2032)

    • Public
    • Private
    • Consortium
    • Hybrid marketing

    US Web3 Marketing Application Outlook(USD million ,2019-2032)

    • NFT Marketing
    • Metaverse Marketing
    • Content Marketing
    • Social media marketing
    • Influencer marketing
    • Public relations
    • Pay-per-click marketing
    •  

    US Web3 Marketing Industry Vertical Outlook(USD million ,2019-2032)

    • BFSI
    • Retail & e-Commerce
    • Media & Entertainment
    • Pharmaceuticals
    • IT & Telecom
    • Others

    Canada Web3 Marketing  Type Outlook (USD million ,2019-2032)

    • Public
    • Private
    • Consortium
    • Hybrid marketing

    Canada Web3 Marketing Application Outlook(USD million ,2019-2032)

    • NFT Marketing
    • Metaverse Marketing
    • Content Marketing
    • Social media marketing
    • Influencer marketing
    • Public relations
    • Pay-per-click marketing
    •  

    Canada Web3 Marketing Industry Vertical Outlook(USD million ,2019-2032)

    • BFSI
    • Retail & e-Commerce
    • Media & Entertainment
    • Pharmaceuticals
    • IT & Telecom
    • Others

    Mexico  Web3 Marketing  Type Outlook (USD million ,2019-2032)

    • Public
    • Private
    • Consortium
    • Hybrid marketing

    Mexico  Web3 Marketing Application Outlook(USD million ,2019-2032)

    • NFT Marketing
    • Metaverse Marketing
    • Content Marketing
    • Social media marketing
    • Influencer marketing
    • Public relations
    • Pay-per-click marketing
    •  

    Mexico  Web3 Marketing Industry Vertical Outlook(USD million ,2019-2032)

    • BFSI
    • Retail & e-Commerce
    • Media & Entertainment
    • Pharmaceuticals
    • IT & Telecom
    • Others

    Europe  Web3 Marketing  Type Outlook (USD million ,2019-2032)

    • Public
    • Private
    • Consortium
    • Hybrid marketing

    Europe  Web3 Marketing Application Outlook(USD million ,2019-2032)

    • NFT Marketing
    • Metaverse Marketing
    • Content Marketing
    • Social media marketing
    • Influencer marketing
    • Public relations
    • Pay-per-click marketing
    •  

    Europe  Web3 Marketing Industry Vertical Outlook(USD million ,2019-2032)

    • BFSI
    • Retail & e-Commerce
    • Media & Entertainment
    • Pharmaceuticals
    • IT & Telecom
    • Others

    Germany  Web3 Marketing  Type Outlook (USD million ,2019-2032)

    • Public
    • Private
    • Consortium
    • Hybrid marketing

    Germany  Web3 Marketing Application Outlook(USD million ,2019-2032)

    • NFT Marketing
    • Metaverse Marketing
    • Content Marketing
    • Social media marketing
    • Influencer marketing
    • Public relations
    • Pay-per-click marketing
    •  

    Germany  Web3 Marketing Industry Vertical Outlook(USD million ,2019-2032)

    • BFSI
    • Retail & e-Commerce
    • Media & Entertainment
    • Pharmaceuticals
    • IT & Telecom
    • Others

    UK  Web3 Marketing  Type Outlook (USD million ,2019-2032)

    • Public
    • Private
    • Consortium
    • Hybrid marketing

    UK  Web3 Marketing Application Outlook(USD million ,2019-2032)

    • NFT Marketing
    • Metaverse Marketing
    • Content Marketing
    • Social media marketing
    • Influencer marketing
    • Public relations
    • Pay-per-click marketing
    •  

    UK  Web3 Marketing Industry Vertical Outlook(USD million ,2019-2032)

    • BFSI
    • Retail & e-Commerce
    • Media & Entertainment
    • Pharmaceuticals
    • IT & Telecom
    • Others

    France  Web3 Marketing  Type Outlook (USD million ,2019-2032)

    • Public
    • Private
    • Consortium
    • Hybrid marketing

    France  Web3 Marketing Application Outlook(USD million ,2019-2032)

    • NFT Marketing
    • Metaverse Marketing
    • Content Marketing
    • Social media marketing
    • Influencer marketing
    • Public relations
    • Pay-per-click marketing
    •  

    France  Web3 Marketing Industry Vertical Outlook(USD million ,2019-2032)

    • BFSI
    • Retail & e-Commerce
    • Media & Entertainment
    • Pharmaceuticals
    • IT & Telecom
    • Others

    Rest of Europe Web3 Marketing  Type Outlook (USD million ,2019-2032)

    • Public
    • Private
    • Consortium
    • Hybrid marketing

    Rest of Europe Web3 Marketing Application Outlook(USD million ,2019-2032)

    • NFT Marketing
    • Metaverse Marketing
    • Content Marketing
    • Social media marketing
    • Influencer marketing
    • Public relations
    • Pay-per-click marketing
    •  

    Rest of Europe Web3 Marketing Industry Vertical Outlook(USD million ,2019-2032)

    • BFSI
    • Retail & e-Commerce
    • Media & Entertainment
    • Pharmaceuticals
    • IT & Telecom
    • Others

    Asia Pacific Web3 Marketing  Type Outlook (USD million ,2019-2032)

    • Public
    • Private
    • Consortium
    • Hybrid marketing

    Asia Pacific Web3 Marketing Application Outlook(USD million ,2019-2032)

    • NFT Marketing
    • Metaverse Marketing
    • Content Marketing
    • Social media marketing
    • Influencer marketing
    • Public relations
    • Pay-per-click marketing
    •  

    Asia Pacific Web3 Marketing Industry Vertical Outlook(USD million ,2019-2032)

    • BFSI
    • Retail & e-Commerce
    • Media & Entertainment
    • Pharmaceuticals
    • IT & Telecom
    • Others

    China Web3 Marketing  Type Outlook (USD million ,2019-2032)

    • Public
    • Private
    • Consortium
    • Hybrid marketing

    China Web3 Marketing Application Outlook(USD million ,2019-2032)

    • NFT Marketing
    • Metaverse Marketing
    • Content Marketing
    • Social media marketing
    • Influencer marketing
    • Public relations
    • Pay-per-click marketing
    •  

    China Web3 Marketing Industry Vertical Outlook(USD million ,2019-2032)

    • BFSI
    • Retail & e-Commerce
    • Media & Entertainment
    • Pharmaceuticals
    • IT & Telecom
    • Others

    Japan Web3 Marketing  Type Outlook (USD million ,2019-2032)

    • Public
    • Private
    • Consortium
    • Hybrid marketing

    Japan Web3 Marketing Application Outlook(USD million ,2019-2032)

    • NFT Marketing
    • Metaverse Marketing
    • Content Marketing
    • Social media marketing
    • Influencer marketing
    • Public relations
    • Pay-per-click marketing
    •  

    Japan Web3 Marketing Industry Vertical Outlook(USD million ,2019-2032)

    • BFSI
    • Retail & e-Commerce
    • Media & Entertainment
    • Pharmaceuticals
    • IT & Telecom
    • Others

    India Web3 Marketing  Type Outlook (USD million ,2019-2032)

    • Public
    • Private
    • Consortium
    • Hybrid marketing

    India Web3 Marketing Application Outlook(USD million ,2019-2032)

    • NFT Marketing
    • Metaverse Marketing
    • Content Marketing
    • Social media marketing
    • Influencer marketing
    • Public relations
    • Pay-per-click marketing
    •  

    India Web3 Marketing Industry Vertical Outlook(USD million ,2019-2032)

    • BFSI
    • Retail & e-Commerce
    • Media & Entertainment
    • Pharmaceuticals
    • IT & Telecom
    • Others


    Rest of Asia Pacific Web3 Marketing  Type Outlook (USD million ,2019-2032)

    • Public
    • Private
    • Consortium
    • Hybrid marketing

    Rest of Asia Pacific Web3 Marketing Application Outlook(USD million ,2019-2032)

    • NFT Marketing
    • Metaverse Marketing
    • Content Marketing
    • Social media marketing
    • Influencer marketing
    • Public relations
    • Pay-per-click marketing
    •  

    Rest of Asia Pacific Web3 Marketing Industry Vertical Outlook(USD million ,2019-2032)

    • BFSI
    • Retail & e-Commerce
    • Media & Entertainment
    • Pharmaceuticals
    • IT & Telecom
    • Others

    Middle East and Africa Web3 Marketing  Type Outlook (USD million ,2019-2032)

    • Public
    • Private
    • Consortium
    • Hybrid marketing

    Middle East and Africa  Web3 Marketing Application Outlook(USD million ,2019-2032)

    • NFT Marketing
    • Metaverse Marketing
    • Content Marketing
    • Social media marketing
    • Influencer marketing
    • Public relations
    • Pay-per-click marketing
    •  

    Middle East and Africa Web3 Marketing Industry Vertical Outlook(USD million ,2019-2032)

    • BFSI
    • Retail & e-Commerce
    • Media & Entertainment
    • Pharmaceuticals
    • IT & Telecom
    • Others

    South America Web3 Marketing  Type Outlook (USD million ,2019-2032)

    • Public
    • Private
    • Consortium
    • Hybrid marketing

    South America Web3 Marketing Application Outlook(USD million ,2019-2032)

    • NFT Marketing
    • Metaverse Marketing
    • Content Marketing
    • Social media marketing
    • Influencer marketing
    • Public relations
    • Pay-per-click marketing
    •  

    South America Web3 Marketing Industry Vertical Outlook(USD million ,2019-2032)

    • BFSI
    • Retail & e-Commerce
    • Media & Entertainment
    • Pharmaceuticals
    • IT & Telecom
    • Others


    Report Infographic
    Free Sample Request

    Kindly complete the form below to receive a free sample of this Report

    Customer Strories

    “I am very pleased with how market segments have been defined in a relevant way for my purposes (such as "Portable Freezers & refrigerators" and "last-mile"). In general the report is well structured. Thanks very much for your efforts.”

    Victoria Milne Founder
    Case Study

    Chemicals and Materials