• Cat-intel
  • MedIntelliX
  • Resources
  • About Us
  • Request Free Sample ×

    Kindly complete the form below to receive a free sample of this Report

    Leading companies partner with us for data-driven Insights

    clients tt-cursor

    Butter Market

    ID: MRFR/F-B & N/2984-CR
    163 Pages
    Sakshi Gupta
    July 2025

    Butter Market Research Report Information by Product Type (Standard Butter, Clarified Butter, Whipped Butter, Others), by Category (Salted and Unsalted), by Form (Spreads, Liquid/ Oil, Blocks, Others), by End-Use (Food Processing, Food Service, Food Retail) and Region (North America, Europe, Asia-Pacific, Rest of the World) - Forecast till 2035

    Share:
    Download PDF ×

    We do not share your information with anyone. However, we may send you emails based on your report interest from time to time. You may contact us at any time to opt-out.

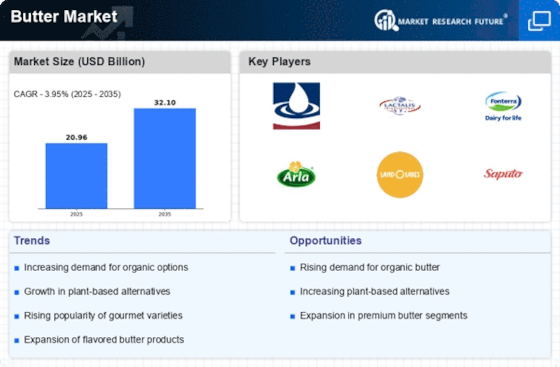
    Butter Market Research Report – Forecast Till 2035 Infographic
    Purchase Options
    $ 4,950.0
    $ 5,950.0
    $ 7,250.0
    Table of Contents

    Butter Market Summary

    The global butter market is projected to grow from 58.5 USD billion in 2024 to 104.9 USD billion by 2035, reflecting a robust growth trajectory.

    Key Market Trends & Highlights

    Butter Key Trends and Highlights

    • The global butter market is valued at 58.5 USD billion in 2024 and is expected to reach 104.9 USD billion by 2035.
    • The compound annual growth rate (CAGR) for the butter market is estimated at 5.45 percent from 2025 to 2035.
    • This growth is indicative of increasing consumer demand for natural and organic dairy products.
    • Growing adoption of butter in culinary applications due to its rich flavor and versatility is a major market driver.

    Market Size & Forecast

    2024 Market Size 58.5 (USD Billion)
    2035 Market Size 104.9 (USD Billion)
    CAGR (2025-2035) 5.45%

    Major Players

    Gujarat Cooperative Milk Marketing Federation Ltd., Arla Foods, Land O’Lakes, Inc., Lactalis Group, Ornua Co-operative Limited, Delta Nutritives, Dairy Farmers of America, Inc., Fonterra Co-operative Group, Organic Valley, Savencia Fromage & Dairy, Royal FrieslandCampina N.V.

    Butter Market Trends

    The global butter market appears to be experiencing a resurgence in demand, driven by a growing consumer preference for natural and minimally processed dairy products, which suggests a potential shift in dietary trends towards traditional fats.

    U.S. Department of Agriculture (USDA)

    Butter Market Drivers

    Health Benefits of Butter

    The Global Butter Market Industry benefits from the rising awareness of the health advantages associated with butter consumption. Research suggests that butter, when consumed in moderation, can be part of a balanced diet, providing essential nutrients such as vitamins A, D, E, and K. This perception is likely to enhance butter's appeal among consumers seeking natural sources of nutrition. As the market evolves, the emphasis on the nutritional profile of butter may lead to increased sales, contributing to the industry's projected growth to 104.9 USD Billion by 2035. This trend reflects a broader shift towards whole foods and traditional dietary practices.

    Market Growth Projections

    The Global Butter Market Industry is on a growth trajectory, with projections indicating a substantial increase in market value over the next decade. The market is expected to reach 58.5 USD Billion in 2024, with a remarkable growth forecast to 104.9 USD Billion by 2035. This growth is underpinned by a compound annual growth rate (CAGR) of 5.45% from 2025 to 2035. Such projections reflect the increasing consumer inclination towards butter as a staple ingredient in cooking and baking, as well as the rising demand for premium and specialty butter products. This upward trend suggests a robust future for the industry.

    Expansion of Retail Channels

    The Global Butter Market Industry is witnessing an expansion of retail channels, which plays a crucial role in increasing product accessibility. Supermarkets, hypermarkets, and online platforms are increasingly stocking a diverse range of butter products, catering to varying consumer preferences. This trend is particularly significant in emerging markets, where urbanization and changing lifestyles drive demand for convenience. As consumers seek easy access to quality butter, the industry's growth is likely to be bolstered by enhanced distribution networks. This accessibility may contribute to the market's projected growth, reaching 58.5 USD Billion in 2024, as more consumers incorporate butter into their daily diets.

    Innovations in Butter Production

    Innovations in butter production techniques are poised to reshape the Global Butter Market Industry. Advances in technology, such as improved pasteurization and churning processes, enhance the quality and shelf life of butter products. Additionally, the introduction of flavored and functional butters caters to diverse consumer tastes and dietary needs. These innovations not only attract new customers but also retain existing ones, as they offer unique culinary experiences. The industry's growth trajectory, with a projected CAGR of 5.45% from 2025 to 2035, underscores the importance of continuous improvement and adaptation to consumer preferences.

    Rising Demand for Dairy Products

    The Global Butter Market Industry experiences a notable surge in demand for dairy products, driven by increasing consumer preferences for natural and organic ingredients. As health-conscious consumers gravitate towards butter as a healthier alternative to margarine, the market is projected to reach 58.5 USD Billion in 2024. This trend is particularly evident in regions where traditional cooking methods emphasize the use of butter, such as Europe and North America. The growing popularity of artisanal and specialty butters further fuels this demand, indicating a shift towards premium products that align with consumer desires for quality and authenticity.

    Consumer Trends Towards Natural Foods

    The Global Butter Market Industry is significantly influenced by consumer trends favoring natural and minimally processed foods. As consumers become more discerning about food ingredients, the demand for butter, perceived as a wholesome and traditional product, continues to rise. This shift is evident in the increasing popularity of grass-fed and organic butter options, which align with consumer values regarding sustainability and health. The industry's growth potential is reflected in the projected increase to 104.9 USD Billion by 2035, as more consumers prioritize natural food choices. This trend indicates a broader movement towards transparency and authenticity in food sourcing.

    Market Segment Insights

    Butter by Product Type Insights

    Based on Product Type, this segment includes Standard Butter, Clarified Butter, Whipped Butter, Others. The Standard Butter segment dominated the global market in 2024, while the Clarified Butter segment is projected to be the fastest–growing segment during the forecast period. Standard butter refers to the normal butter obtained directly from milk or cream without further processing. It is the salted or unsalted butter used directly by the retail consumers and the food processing industry. 

    It is uncultured butter that is sold directly without changing its natural nutrient profile i.e. mainly the fat content. Standard butter is the most well-known type of butter, and it is eaten most often, with a creamy texture and rich flavor. Usually produced by whipping up cream until butterfat separates from buttermilk, this item is consumed at home and in Foodservice kitchens as well.

    FIGURE 2: BUTTER MARKET SHARE BY PRODUCT TYPE 2024 AND 2035 (USD BILLION)

    BUTTER MARKET SHARE BY PRODUCT TYPE 2024 AND 2035

    Source: Secondary Research, Primary Research, MRFR Database and Analyst Review

    Butter by Category Insights

    Based on Category, this segment includes Salted and Unsalted. The Salted segment dominated the global market in 2024, while it is projected to be the fastest–growing segment during the forecast period. Salted butter refers to the butter in which salt has been added to give it a saltier taste and act as a preservative. 

    It is majorly used for spreading bread, topping veggies & pasta, and used in recipes that do not require much control over the amount of salt to be added. Salted butter is being used in various households and is one of the widely consumed butters globally. The salty taste of it makes it a versatile ingredient for cooking, baking, and spread for bread or crackers.

    Butter by Form Insights

    Based on Form, this segment includes Spreads, Liquid/ Oil, Blocks, Others. The Spreads segment dominated the global market in 2024, while it is projected to be the fastest–growing segment during the forecast period. Spreads refers to pure butter with enough oil content to make it spread on the applied surface. It is mainly a mixture of butter and vegetable oil, generally canola oil. The oil added to the butter prevents it from hardening and thus offers ease while spreading it over a surface. 

    Majority of the retail brands offer butter in the form of spreads, use canola oil. However, other oils such as extra-virgin olive, flaxseed, grape seed, and hemp seed oils can also be used depending upon the final flavor profile required. The spreads are generally softened, whipped, or mixed with oils for enhancing their spread ability even at low temperatures.

    Butter by End-Use Insights

    Based on End-Use, this segment includes Food Processing, Food Service, Food Retail. The Food Retail segment dominated the global market in 2024, while the Food Processing segment is projected to be the fastest–growing segment during the forecast period. The food retail segment includes both store-based retail sales and non-store-based retail sales of butter. Store-based retail refers to the sale of butter through brick-and-mortar stores such as supermarkets, hypermarkets, convenience stores, and specialty stores. Whereas non-store-based retail mainly refers to the sale of butter through e-commerce. 

    Food retail is a crucial distribution channel for butter in the global market, with much of the revenue generated from store-based retail stores. Product packaging, brand name, and shelf space are the most crucial factors influencing the sale of butter in the store-based retail channels. The growth of e-commerce in the retail sector is boosting the growth of the segment and is expected to increase the growth rate of the segment during the forecast period.

    Butter

    Regional Insights

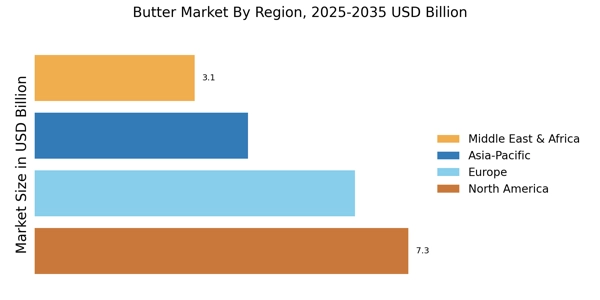
    Based on the Region, the Global Butter is segmented into North America, Europe, Asia-Pacific, Middle East & Africa and Rest of the World. The Asia-Pacific dominated the global market in 2024, while it is projected to be the fastest–growing segment during the forecast period. Major demand factors driving the Asia-Pacific market are the increasing demand for butter in food processing and growth of the Horeca industry. Asia-Pacific is the most lucrative market for butter. 

    The major countries included in the Asia-Pacific butter market are China, Japan, India, Australia, and New Zealand. Asia-Pacific is the most lucrative market for butter. The major countries included in the Asia-Pacific butter market are China, Japan, India, Australia, and New Zealand. The rising demand for convenience foods and bakery & confectionery products in Asia-Pacific is yet another determinant that is boosting the consumption of butter in the region.

    FIGURE 3: BUTTER MARKET VALUE BY REGION 2024 AND 2035 (USD BILLION)

    BUTTER MARKET VALUE BY REGION 2024 AND 2035

    Source: Secondary Research, Primary Research, MRFR Database, and Analyst Review

    Further, the countries considered in the scope of the Application Tracking System Market are the US, Canada, Mexico, Germany, UK, France, Spain, Italy, Finland, China, Japan, India, Australia & New Zealand, South Korea, South America, Middle East & Africa and others.

    Key Players and Competitive Insights

    Many global, regional, and local vendors characterize the Butter Market. The market is highly competitive, with all the players competing to gain market share. Intense competition, rapid advances in technology, frequent changes in government policies, and environmental regulations are key factors that confront market growth. The vendors compete based on cost, product quality, reliability, and government regulations. Vendors must provide cost-efficient, high-quality products to survive and succeed in an intensely competitive market.

    The major competitors in the market are Gujarat Cooperative Milk Marketing Federation Ltd., Arla Foods, Land O’Lakes, Inc., Lactalis Group, Ornua Co-operative Limited, Delta Nutritives, Dairy Farmers of America, Inc., Fonterra Co-operative Group, Organic Valley, Savencia Fromage & Dairy, Royal FrieslandCampina N.V. are among others. The Butter Market is a consolidated market due to increasing competition, acquisitions, mergers and other strategic market developments and decisions to improve operational effectiveness.

    Key Companies in the Butter Market market include

    Industry Developments

    March 2024: GCMMF partnered with the Michigan Milk Producers Association (MMPA) to introduce Amul-branded fluid milk products in the United States.  This collaboration not only marks Amul's entry into the U.S. fluid milk market but also paves the way for expanding its butter and other dairy product offerings internationally.

    October 2024: To cater to evolving consumer preferences, Land O'Lakes introduced innovative butter products. Notably, the launch of Butter Balls, pre-portioned half-tablespoon servings, aims to enhance convenience for home cooks. Additionally, the company capitalized on seasonal trends by offering limited-edition flavors like Pumpkin Pie Spice Butter Spread and Maple Me Crazy Butter Spread, appealing to consumers seeking unique taste experiences.

    Aug 2022: Dairy Farmers of America (DFA) acquired two extended shelf-life (ESL) processing facilities from SmithFoods. The processing plants, located in Richmond, Ind., and Pacific, Mo., produce a variety of extended shelf-life dairy and non-dairy beverages, ice cream and shake mixes for both retail and food service customers. The facilities will become part of the DFA Dairy Brands division and will operate like Richmond Beverage Solutions and Pacific Dairy Solutions.

    January 2018: Fonterra invested USD 13.5 million in its Cobden site, which is Fonterra’s largest site for boosting butter production.

    Butter Market Segmentation

    • Butter by Product Type Outlook

      • Standard Butter

      • Clarified Butter

      • Whipped Butter

      • Others

    • Butter by Category Outlook

      • Salted

      • Unsalted

    • Butter by Form Outlook

      • Spreads

      • Liquid/ Oil

      • Blocks

      • Others

    • Butter by End-User Outlook

      • Food Processing

      • Food Service

      • Food Retail

      • Butter Regional Outlook

    • North America

      • US

      • Canada

      • Mexico

    • Europe

      • Germany

      • UK

      • Italy

      • Spain

      • France

      • Finland

      • Rest of Europe

    • Asia-Pacific

      • China

      • Japan

      • India

      • Australia & NZ

      • South Korea

      • Rest of Asia Pacific

    • Rest of the World

      • South America

      • Middle East & Africa

    Future Outlook

    Butter Market Future Outlook

    The Global Butter Market is projected to grow at a 5.45% CAGR from 2024 to 2035, driven by rising health consciousness, demand for natural products, and innovative dairy alternatives.

    New opportunities lie in:

    • Expand product lines to include organic and specialty butters targeting health-conscious consumers.
    • Leverage e-commerce platforms for direct-to-consumer sales, enhancing market reach and customer engagement.
    • Invest in sustainable production practices to appeal to environmentally aware consumers and improve brand loyalty.

    By 2035, the Global Butter Market is expected to demonstrate robust growth, reflecting evolving consumer preferences and sustainable practices.

    Market Segmentation

    by Form Outlook

    • Food Processing
    • Food Service
    • Food Retail
    • Butter Regional Outlook

    Regional Outlook

    North America
    • US
    • Canada
    • Mexico

    by Category Outlook

    • Spreads
    • Liquid/ Oil
    • Blocks
    • Others

    by End-User Outlook

    • Food Processing
    • Food Service
    • Food Retail
    • Butter Regional Outlook

    Butter by Form Outlook

    • Food Processing
    • Food Service
    • Food Retail
    • Butter Regional Outlook

    Butter Regional Outlook

    North America
    • US
    • Canada
    • Mexico

    by Product Type Outlook

    • Salted
    • Unsalted

    Butter by Category Outlook

    • Spreads
    • Liquid/ Oil
    • Blocks
    • Others

    Butter by End-User Outlook

    • Food Processing
    • Food Service
    • Food Retail
    • Butter Regional Outlook

    Butter by Product Type Outlook

    • Salted
    • Unsalted

    Report Scope

    Report Attribute/Metric Details
    Market Size 2024 USD 58.48 Billion
    Market Size 2025 USD 61.56 Billion
    Market Size 2035 USD 104.87 Billion
    Compound Annual Growth Rate (CAGR) 5.54% (2025-2035)
    Base Year 2024
    Forecast Period 2025-2035
    Historical Data 2019-2023
    Forecast Units Value (USD Billion)
    Report Coverage Revenue Forecast, Competitive Landscape, Growth Factors, and Trends
    Segments Covered By Product Type, By Category, By Form, By End-Use
    Geographies Covered North America, Europe, Asia Pacific and Rest of the World
    Countries Covered The US, Canada, Mexico, Germany, UK, France, Spain, Italy, Finland, China, Japan, India, Australia & New Zealand, South Korea, South America, Middle East & Africa
    Key Companies Profiled Gujarat Cooperative Milk Marketing Federation Ltd., Arla Foods, Land O’Lakes, Inc., Lactalis Group, Ornua Co-operative Limited, Delta Nutritives, Dairy Farmers of America, Inc., Fonterra Co-operative Group, Organic Valley, Savencia Fromage & Dairy, Royal FrieslandCampina N.V.
    Key Market Opportunities ·         Investments in R&D in innovations ·         Sustainable practices
    Key Market Dynamics ·         Increasing demand for butter in food processing ·         Growth of the Horeca industry

    Market Highlights

    Author
    Sakshi Gupta
    Research Analyst Level II

    I have about two years of experience working in the consumer goods and retail industries and I am a biotech graduate.A tech-savvy analytically focused professional with a strong capabilities in identification, concept generation, and strategy evaluation. I can produce data-driven solutions while fusing unusual viewpoints with original concepts. I have been extensively working on business case studies, competitive & comparative analyses, and strategic reports. My primary areas of experience include client management, financial analysis, supply chain evaluation, market entry strategy evaluation, and estimating and forecasting market size.

    Leave a Comment

    FAQs

    How much is the Butter Market?

    USD 58.48 Billion is the Butter Market in 2024

    Which Product Type holds the largest market share?

    The Standard Butter segment by Product Type holds the largest market share and grows at CAGR of 5.69 % during the forecast period.

    Which region holds the largest market share in the Butter Market?

    Asia-Pacific holds the largest market share in the Butter Market.

    Who are the prominent players in the Butter Market?

    Gujarat Cooperative Milk Marketing Federation Ltd., Arla Foods, Land O’Lakes, Inc., Lactalis Group, Ornua Co-operative Limited, Delta Nutritives, Dairy Farmers of America, Inc., Fonterra Co-operative Group, Organic Valley, Savencia Fromage & Dairy, Royal FrieslandCampina N.V. are the prominent players in the Butter Market.

    Which Form of segment led the Butter Market?

    The Spreads segment dominated the market in 2024.

    1. EXECUTIVE SUMMARY
      1. MARKET ATTRACTIVENESS
    2. ANALYSIS
      1. GLOBAL BUTTER MARKET, BY PRODUCT TYPE
        1. GLOBAL BUTTER
    3. MARKET, BY CATEGORY
      1. GLOBAL BUTTER MARKET, BY FORM
        1. GLOBAL BUTTER
    4. MARKET, BY END-USE
      1. GLOBAL BUTTER MARKET, BY REGION/COUNTRY
    5. MARKET INTRODUCTION
      1. DEFINITION
      2. SCOPE OF THE STUDY
      3. RESEARCH OBJECTIVE
      4. MARKET STRUCTURE
    6. RESEARCH METHODOLOGY
      1. OVERVIEW
      2. DATA
    7. FLOW
      1. DATA MINING PROCESS
      2. PURCHASED DATABASE:
      3. SECONDARY
    8. SOURCES:
      1. SECONDARY RESEARCH DATA FLOW:
      2. PRIMARY RESEARCH:
        1. PRIMARY RESEARCH DATA FLOW:
        2. PRIMARY RESEARCH: NUMBER OF INTERVIEWS
    9. CONDUCTED
      1. PRIMARY RESEARCH: REGIONAL COVERAGE
      2. APPROACHES FOR
    10. MARKET SIZE ESTIMATION:
      1. CONSUMPTION & NET TRADE APPROACH
    11. REVENUE ANALYSIS APPROACH
      1. DATA FORECASTING
        1. DATA FORECASTING
    12. TECHNIQUE
      1. DATA MODELING
        1. MICROECONOMIC FACTOR ANALYSIS:
    13. DATA MODELING:
      1. TEAMS AND ANALYST CONTRIBUTION
    14. MARKET DYNAMICS
      1. INTRODUCTION
      2. GROWTH PARAMETERS MAPPED – DRIVERS
    15. INCREASING DEMAND FOR BUTTER IN FOOD PROCESSING
      1. GROWTH OF THE HORECA
    16. INDUSTRY
      1. DRIVERS IMPACT ANALYSIS
      2. RESTRAINTS
        1. INCREASING
    17. HEALTH AWARENESS
      1. COMPETITION FROM MARGARINE AND PLANT-BASED ALTERNATIVES
        1. RESTRAINTS IMPACT ANALYSIS
      2. OPPORTUNITIES
        1. INVESTMENTS
    18. IN R&D FOR INNOVATIONS
      1. SUSTAINABLE PRACTICES
        1. OPPORTUNITY
    19. IMPACT ANALYSIS
    20. MARKET FACTOR ANALYSIS
      1. VALUE CHAIN ANALYSIS
    21. RAW MATERIAL PROCUREMENT
      1. MANUFACTURING / PRODUCTION/ PROCESSING
    22. . PACKAGING
      1. DISTRIBUTION
        1. END-USER
      2. SUPPLY CHAIN ANALYSIS
        1. PARTICIPANTS (AT DIFFERENT NODES)
    23. TRANSPORTATION OF RAW MILK
      1. QUALITY CHECK AND INSPECTION
    24. PROCESSING UNIT (BUTTER PRODUCTION)
      1. PACKAGING & DISTRIBUTION
        1. END-USE (RETAIL & COMMERCIAL SALES)
      2. PORTER’S FIVE FORCES
    25. MODEL
      1. THREAT OF NEW ENTRANTS
        1. BARGAINING POWER OF SUPPLIERS
        2. BARGAINING POWER OF BUYERS
        3. THREAT OF SUBSTITUTES
        4. INTENSITY
    26. OF RIVALRY
      1. COVID-19 IMPACT ANALYSIS
        1. MARKET IMPACT ANALYSIS
        2. REGIONAL IMPACT
    27. NORTH AMERICA
    28. EUROPE
    29. SOUTH AMERICA
    30. ASIA
    31. PACIFIC
    32. MIDDLE EAST AND AFRICA (MEA)
      1. OPPORTUNITY AND THREAT ANALYSIS
    33. OPPORTUNITIES
    34. THREATS
    35. GLOBAL BUTTER MARKET, BY PRODUCT TYPE
    36. INTRODUCTION
      1. STANDARD BUTTER
      2. CLARIFIED BUTTER
      3. WHIPPED
    37. BUTTER
      1. OTHERS
    38. GLOBAL BUTTER MARKET, BY CATEGORY
      1. INTRODUCTION
      2. SALTED
      3. UNSALTED
    39. GLOBAL BUTTER MARKET, BY FORM
      1. INTRODUCTION
      2. SPREADS
      3. LIQUID/OIL
      4. BLOCKS
      5. OTHERS
    40. GLOBAL
    41. BUTTER MARKET, BY END-USE
      1. INTRODUCTION
      2. FOOD PROCESSING
    42. FOODSERVICE
      1. FOOD RETAIL
    43. GLOBAL BUTTER MARKET, BY REGION
    44. OVERVIEW
      1. NORTH AMERICA
        1. US
        2. CANADA
        3. MEXICO
      2. EUROPE
        1. GERMANY
        2. UK
        3. FRANCE
    45. SPAIN
      1. ITALY
        1. FINLAND
        2. REST OF EUROPE
    46. ASIA PACIFIC
      1. CHINA
        1. JAPAN
        2. INDIA
        3. AUSTRALIA
    47. & NEW ZEALAND
      1. SOUTH KOREA
        1. REST OF ASIA PACIFIC
    48. REST OF THE WORLD
      1. SOUTH AMERICA
        1. MIDDLE EAST
    49. AFRICA
    50. COMPETITIVE LANDSCAPE
      1. INTRODUCTION
      2. COMPETITION
    51. DASHBOARD
      1. PRODUCT PORTFOLIO
        1. REGIONAL PRESENCE
    52. STRATEGIC ALLIANCES
      1. INDUSTRY EXPERIENCES
      2. MARKET TIER ANALYSIS,
      3. COMPANY MARKET SHARE ANALYSIS, 2024
      4. WHO ARE THE MAJOR DISRUPTORS
    53. & INNOVATORS
      1. WHAT STRATEGIES ARE BEING ADOPTED BY MARKET LEADERS
      2. COMPARATIVE ANALYSIS: KEY PLAYERS FINANCIAL
      3. LIST OF KEY PLAYERS/BRANDS,
    54. BY REGION
      1. KEY DEVELOPMENTS & GROWTH STRATEGIES
        1. EXPANSION
        2. PARTNERSHIP
    55. COMPANY PROFILES
      1. GUJARAT COOPERATIVE MILK
    56. MARKETING FEDERATION LTD
      1. COMPANY OVERVIEW
        1. FINANCIAL OVERVIEW
        2. PRODUCTS OFFERED
        3. KEY DEVELOPMENTS
        4. SWOT ANALYSIS
        5. KEY STRATEGY
      2. ALRA FOODS
        1. COMPANY OVERVIEW
    57. FINANCIAL OVERVIEW
      1. PRODUCTS OFFERED
        1. KEY DEVELOPMENTS
        2. SWOT ANALYSIS
        3. KEY STRATEGY
      2. LAND O’LAKES, INC.
        1. COMPANY OVERVIEW
        2. FINANCIAL OVERVIEW
        3. PRODUCTS OFFERED
        4. KEY DEVELOPMENTS
        5. SWOT ANALYSIS
        6. KEY STRATEGY
      3. LACTALIS GROUP
        1. COMPANY OVERVIEW
        2. FINANCIAL OVERVIEW
        3. PRODUCTS OFFERED
        4. KEY DEVELOPMENTS
        5. KEY STRATEGY
      4. ORNUA CO-OPERATIVE LIMITED
        1. COMPANY OVERVIEW
        2. FINANCIAL
    58. OVERVIEW
      1. PRODUCTS OFFERED
        1. KEY DEVELOPMENTS
        2. SWOT
    59. ANALYSIS
      1. KEY STRATEGY
      2. DELTA NUTRITIVES
        1. COMPANY
    60. OVERVIEW
      1. FINANCIAL OVERVIEW
        1. PRODUCTS OFFERED
    61. KEY DEVELOPMENTS
      1. KEY STRATEGY
      2. DAIRY FARMERS OF AMERICA, INC.
        1. COMPANY OVERVIEW
        2. FINANCIAL OVERVIEW
        3. SERVICE OFFERED
        4. KEY DEVELOPMENTS
        5. KEY STRATEGY
      3. FONTERRA CO-OPERATIVE
    62. GROUP
      1. COMPANY OVERVIEW
        1. FINANCIAL OVERVIEW
        2. PRODUCTS
    63. OFFERED
      1. KEY DEVELOPMENTS
        1. KEY STRATEGY
      2. ORGANIC
    64. VALLEY
      1. COMPANY OVERVIEW
        1. PRODUCTS OFFERED
        2. KEY
    65. DEVELOPMENTS
      1. KEY STRATEGY
      2. SAVENCIA FROMAGE & DAIRY
        1. COMPANY OVERVIEW
        2. FINANCIAL OVERVIEW
        3. PRODUCTS
    66. OFFERED
      1. KEY DEVELOPMENTS
        1. KEY STRATEGY
      2. ROYAL
    67. FRIESLANDCAMPINA N.V.
      1. COMPANY OVERVIEW
        1. FINANCIAL OVERVIEW
        2. PRODUCTS OFFERED
        3. KEY DEVELOPMENTS
        4. KEY STRATEGY
      2. DATA CITATIONS
    68. FOR MARKET SHARE ASSESSMENT
    69. 2035 (USD BILLION)
    70. (USD BILLION)
    71. GLOBAL BUTTER MARKET, BY REGION, 2019-2035(USD BILLION)
    72. BUTTER MARKET, BY COUNTRY, 2019-2035(USD BILLION)
    73. MARKET, BY PRODUCT TYPE, 2019-2035(USD BILLION)
    74. MARKET, BY CATEGORY, 2019-2035(USD BILLION)
    75. BY FORM, 2019-2035(USD BILLION)
    76. USE, 2019-2035(USD BILLION)
    77. BILLION)
    78. MARKET, BY END USE, 2019-2035(USD BILLION)
    79. PRODUCT TYPE, 2019-2035(USD BILLION)
    80. 2035(USD BILLION)
    81. BILLION)
    82. MEXICO BUTTER MARKET, BY CATEGORY, 2019-2035(USD BILLION)
    83. BUTTER MARKET, BY FORM, 2019-2035(USD BILLION)
    84. BY END USE, 2019-2035(USD BILLION)
    85. 2035(USD BILLION)
    86. BILLION)
    87. BUTTER MARKET, BY END USE, 2019-2035(USD BILLION)
    88. BY PRODUCT TYPE, 2019-2035(USD BILLION)
    89. CATEGORY, 2019-2035(USD BILLION)
    90. BILLION)
    91. UK BUTTER MARKET, BY CATEGORY, 2019-2035(USD BILLION)
    92. MARKET, BY FORM, 2019-2035(USD BILLION)
    93. 2035(USD BILLION)
    94. BILLION)
    95. BUTTER MARKET, BY END USE, 2019-2035(USD BILLION)
    96. BY PRODUCT TYPE, 2019-2035(USD BILLION)
    97. 2035(USD BILLION)
    98. BILLION)
    99. ITALY BUTTER MARKET, BY CATEGORY, 2019-2035(USD BILLION)
    100. BUTTER MARKET, BY FORM, 2019-2035(USD BILLION)
    101. BY END USE, 2019-2035(USD BILLION)
    102. TYPE, 2019-2035(USD BILLION)
    103. BILLION)
    104. REST OF EUROPE BUTTER MARKET, BY PRODUCT TYPE, 2019-2035(USD BILLION)
    105. REST OF EUROPE BUTTER MARKET, BY CATEGORY, 2019-2035(USD BILLION)
    106. REST OF EUROPE BUTTER MARKET, BY FORM, 2019-2035(USD BILLION)
    107. OF EUROPE BUTTER MARKET, BY END USE, 2019-2035(USD BILLION)
    108. BUTTER MARKET, BY COUNTRY, 2019-2035(USD BILLION)
    109. MARKET, BY PRODUCT TYPE, 2019-2035(USD BILLION)
    110. MARKET, BY CATEGORY, 2019-2035(USD BILLION)
    111. BY FORM, 2019-2035(USD BILLION)
    112. USE, 2019-2035(USD BILLION)
    113. 2035(USD BILLION)
    114. BILLION)
    115. CHINA BUTTER MARKET, BY END USE, 2019-2035(USD BILLION)
    116. MARKET, BY PRODUCT TYPE, 2019-2035(USD BILLION)
    117. BY CATEGORY, 2019-2035(USD BILLION)
    118. 2035(USD BILLION)
    119. BILLION)
    120. INDIA BUTTER MARKET, BY FORM, 2019-2035(USD BILLION)
    121. MARKET, BY END USE, 2019-2035(USD BILLION)
    122. BUTTER MARKET, BY PRODUCT TYPE, 2019-2035(USD BILLION)
    123. NEW ZEALAND BUTTER MARKET, BY CATEGORY, 2019-2035(USD BILLION)
    124. & NEW ZEALAND BUTTER MARKET, BY FORM, 2019-2035(USD BILLION)
    125. & NEW ZEALAND BUTTER MARKET, BY END USE, 2019-2035(USD BILLION)
    126. SOUTH KOREA BUTTER MARKET, BY PRODUCT TYPE, 2019-2035(USD BILLION)
    127. SOUTH KOREA BUTTER MARKET, BY CATEGORY, 2019-2035(USD BILLION)
    128. KOREA BUTTER MARKET, BY FORM, 2019-2035(USD BILLION)
    129. MARKET, BY END USE, 2019-2035(USD BILLION)
    130. MARKET, BY PRODUCT TYPE, 2019-2035(USD BILLION)
    131. BUTTER MARKET, BY CATEGORY, 2019-2035(USD BILLION)
    132. BUTTER MARKET, BY FORM, 2019-2035(USD BILLION)
    133. BUTTER MARKET, BY END USE, 2019-2035(USD BILLION)
    134. BUTTER MARKET, BY COUNTRY, 2019-2035(USD BILLION)
    135. BUTTER MARKET, BY PRODUCT TYPE, 2019-2035(USD BILLION)
    136. WORLD BUTTER MARKET, BY CATEGORY, 2019-2035(USD BILLION)
    137. WORLD BUTTER MARKET, BY FORM, 2019-2035(USD BILLION)
    138. BUTTER MARKET, BY END USE, 2019-2035(USD BILLION)
    139. MARKET, BY PRODUCT TYPE, 2019-2035(USD BILLION)
    140. MARKET, BY CATEGORY, 2019-2035(USD BILLION)
    141. BY FORM, 2019-2035(USD BILLION)
    142. USE, 2019-2035(USD BILLION)
    143. TYPE, 2019-2035(USD BILLION)
    144. 2035(USD BILLION)
    145. BILLION)
    146. AFRICA BUTTER MARKET, BY CATEGORY, 2019-2035(USD BILLION)
    147. BUTTER MARKET, BY FORM, 2019-2035(USD BILLION)
    148. BY END USE, 2019-2035(USD BILLION)
    149. GLOBAL BUTTER MARKET, KEY PLAYERS, BY REGION
    150. INC.: KEY DEVELOPMENTS
    151. ORNUA CO-OPERATIVE LIMITED.: PRODUCTS OFFERED
    152. LIMITED: KEY DEVELOPMENTS
    153. DAIRY FARMERS OF AMERICA, INC.: PRODUCTS OFFERED
    154. OF AMERICA, INC.: KEY DEVELOPMENTS
    155. OFFERED
    156. ORGANIC VALLEY: PRODUCTS OFFERED
    157. PRODUCTS OFFERED
    158. LIST
    159. OF FIGURES
    160. MARKET ANALYSIS, BY CATEGORY
    161. MARKET ANALYSIS, BY REGION/COUNTRY
    162. DRIVERS IMPACT ANALYSIS: GLOBAL BUTTER MARKET
    163. ANALYSIS: GLOBAL BUTTER MARKET
    164. BUTTER MARKET
    165. GLOBAL BUTTER MARKET: SUPPLY CHAIN ANALYSIS
    166. BY PRODUCT TYPE, SEGMENT ATTRACTIVENESS ANALYSIS
    167. BY PRODUCT TYPE, 2024 (% SHARE)
    168. SEGMENT ATTRACTIVENESS ANALYSIS
    169. (% SHARE)
    170. ANALYSIS
    171. GLOBAL BUTTER MARKET, BY END-USE, SEGMENT ATTRACTIVENESS ANALYSIS
    172. GLOBAL BUTTER MARKET, BY END-USE, 2024 (% SHARE)
    173. MARKET, BY REGION, 2024 (% SHARE)
    174. ANALYSIS
    175. BY COUNTRY, 2024 (% SHARE)
    176. REST OF THE WORLD MARKET: COMPARATIVE ANALYSIS
    177. BUTTER MARKET, BY COUNTRY, 2024 (% SHARE)
    178. BUTTER MARKET
    179. MILK MARKETING FEDERATION LTD: SWOT ANALYSIS
    180. LIMITED: FINANCIAL OVERVIEW SNAPSHOT (ANNUAL TURNOVER)
    181. LIMITED: SWOT ANALYSIS
    182. OVERVIEW SNAPSHOT
    183. SNAPSHOT

    Global Outlook (USD Billion,2019-2035)

    Global Butter, By Product Type (USD Billion,2019-2035)

    • Standard Butter
    • Clarified Butter
    • Whipped Butter
    • Others

    Global Butter, By Category (USD Billion,2019-2035)

    • Salted
    • Unsalted

    Global Butter, By Form (USD Billion,2019-2035)

    • Spreads
    • Liquid/ Oil
    • Blocks
    • Others

    Global Butter, By End-Use (USD Billion,2019-2035)

    • Food Processing
    • Food Service
    • Food Retail

    North America Outlook (USD Billion,2019-2035)

    North America Butter, By Product Type (USD Billion,2019-2035)

    • Standard Butter
    • Clarified Butter
    • Whipped Butter
    • Others

    North America Butter, By Category (USD Billion,2019-2035)

    • Salted
    • Unsalted

    North America Butter, By Form (USD Billion,2019-2035)

    • Spreads
    • Liquid/ Oil
    • Blocks
    • Others

    North America Butter, By End-Use (USD Billion,2019-2035)

    • Food Processing
    • Food Service
    • Food Retail

    US Outlook (USD Billion,2019-2035)

    US Butter, By Product Type (USD Billion,2019-2035)

    • Standard Butter
    • Clarified Butter
    • Whipped Butter
    • Others

    US Butter, By Category (USD Billion,2019-2035)

    • Salted
    • Unsalted

    US Butter, By Form (USD Billion,2019-2035)

    • Spreads
    • Liquid/ Oil
    • Blocks
    • Others

    US Butter, By End-Use (USD Billion,2019-2035)

    • Food Processing
    • Food Service
    • Food Retail

    Canada Outlook (USD Billion,2019-2035)

    Canada Butter, By Product Type (USD Billion,2019-2035)

    • Standard Butter
    • Clarified Butter
    • Whipped Butter
    • Others

    Canada Butter, By Category (USD Billion,2019-2035)

    • Salted
    • Unsalted

    Canada Butter, By Form (USD Billion,2019-2035)

    • Spreads
    • Liquid/ Oil
    • Blocks
    • Others

    Canada Butter, By End-Use (USD Billion,2019-2035)

    • Food Processing
    • Food Service
    • Food Retail

    Mexico Outlook (USD Billion,2019-2035)

    Mexico Butter, By Product Type (USD Billion,2019-2035)

    • Standard Butter
    • Clarified Butter
    • Whipped Butter
    • Others

    Mexico Butter, By Category (USD Billion,2019-2035)

    • Salted
    • Unsalted

    Mexico Butter, By Form (USD Billion,2019-2035)

    • Spreads
    • Liquid/ Oil
    • Blocks
    • Others

    Mexico Butter, By End-Use (USD Billion,2019-2035)

    • Food Processing
    • Food Service
    • Food Retail

    Europe Outlook (USD Billion,2019-2035)

    Europe Butter, By Product Type (USD Billion,2019-2035)

    • Standard Butter
    • Clarified Butter
    • Whipped Butter
    • Others

    Europe Butter, By Category (USD Billion,2019-2035)

    • Salted
    • Unsalted

    Europe Butter, By Form (USD Billion,2019-2035)

    • Spreads
    • Liquid/ Oil
    • Blocks
    • Others

    Europe Butter, By End-Use (USD Billion,2019-2035)

    • Food Processing
    • Food Service
    • Food Retail

    Germany Outlook (USD Billion,2019-2035)

    Germany Butter, By Product Type (USD Billion,2019-2035)

    • Standard Butter
    • Clarified Butter
    • Whipped Butter
    • Others

    Germany Butter, By Category (USD Billion,2019-2035)

    • Salted
    • Unsalted

    Germany Butter, By Form (USD Billion,2019-2035)

    • Spreads
    • Liquid/ Oil
    • Blocks
    • Others

    Germany Butter, By End-Use (USD Billion,2019-2035)

    • Food Processing
    • Food Service
    • Food Retail

    UK Outlook (USD Billion,2019-2035)

    UK Butter, By Product Type (USD Billion,2019-2035)

    • Standard Butter
    • Clarified Butter
    • Whipped Butter
    • Others

    UK Butter, By Category (USD Billion,2019-2035)

    • Salted
    • Unsalted

    UK Butter, By Form (USD Billion,2019-2035)

    • Spreads
    • Liquid/ Oil
    • Blocks
    • Others

    UK Butter, By End-Use (USD Billion,2019-2035)

    • Food Processing
    • Food Service
    • Food Retail

    France Outlook (USD Billion,2019-2035)

    France Butter, By Product Type (USD Billion,2019-2035)

    • Standard Butter
    • Clarified Butter
    • Whipped Butter
    • Others

    France Butter, By Category (USD Billion,2019-2035)

    • Salted
    • Unsalted

    France Butter, By Form (USD Billion,2019-2035)

    • Spreads
    • Liquid/ Oil
    • Blocks
    • Others

    France Butter, By End-Use (USD Billion,2019-2035)

    • Food Processing
    • Food Service
    • Food Retail

    Spain Outlook (USD Billion,2019-2035)

    Spain Butter, By Product Type (USD Billion,2019-2035)

    • Standard Butter
    • Clarified Butter
    • Whipped Butter
    • Others

    Spain Butter, By Category (USD Billion,2019-2035)

    • Salted
    • Unsalted

    Spain Butter, By Form (USD Billion,2019-2035)

    • Spreads
    • Liquid/ Oil
    • Blocks
    • Others

    Spain Butter, By End-Use (USD Billion,2019-2035)

    • Food Processing
    • Food Service
    • Food Retail

    Italy Outlook (USD Billion,2019-2035)

    Italy Butter, By Product Type (USD Billion,2019-2035)

    • Standard Butter
    • Clarified Butter
    • Whipped Butter
    • Others

    Italy Butter, By Category (USD Billion,2019-2035)

    • Salted
    • Unsalted

    Italy Butter, By Form (USD Billion,2019-2035)

    • Spreads
    • Liquid/ Oil
    • Blocks
    • Others

    Italy Butter, By End-Use (USD Billion,2019-2035)

    • Food Processing
    • Food Service
    • Food Retail

    Finland Outlook (USD Billion,2019-2035)

    Finland Butter, By Product Type (USD Billion,2019-2035)

    • Standard Butter
    • Clarified Butter
    • Whipped Butter
    • Others

    Finland Butter, By Category (USD Billion,2019-2035)

    • Salted
    • Unsalted

    Finland Butter, By Form (USD Billion,2019-2035)

    • Spreads
    • Liquid/ Oil
    • Blocks
    • Others

    Finland Butter, By End-Use (USD Billion,2019-2035)

    • Food Processing
    • Food Service
    • Food Retail

    Rest of Europe Outlook (USD Billion,2019-2035)

    Rest of Europe Butter, By Product Type (USD Billion,2019-2035)

    • Standard Butter
    • Clarified Butter
    • Whipped Butter
    • Others

    Rest of Europe Butter, By Category (USD Billion,2019-2035)

    • Salted
    • Unsalted

    Rest of Europe Butter, By Form (USD Billion,2019-2035)

    • Spreads
    • Liquid/ Oil
    • Blocks
    • Others

    Rest of Europe Butter, By End-Use (USD Billion,2019-2035)

    • Food Processing
    • Food Service
    • Food Retail

    Asia-Pacific Outlook (USD Billion,2019-2035)

    Asia-Pacific Butter, By Product Type (USD Billion,2019-2035)

    • Standard Butter
    • Clarified Butter
    • Whipped Butter
    • Others

    Asia-Pacific Butter, By Category (USD Billion,2019-2035)

    • Salted
    • Unsalted

    Asia-Pacific Butter, By Form (USD Billion,2019-2035)

    • Spreads
    • Liquid/ Oil
    • Blocks
    • Others

    Asia-Pacific Butter, By End-Use (USD Billion,2019-2035)

    • Food Processing
    • Food Service
    • Food Retail

    China Outlook (USD Billion,2019-2035)

    China Butter, By Product Type (USD Billion,2019-2035)

    • Standard Butter
    • Clarified Butter
    • Whipped Butter
    • Others

    China Butter, By Category (USD Billion,2019-2035)

    • Salted
    • Unsalted

    China Butter, By Form (USD Billion,2019-2035)

    • Spreads
    • Liquid/ Oil
    • Blocks
    • Others

    China Butter, By End-Use (USD Billion,2019-2035)

    • Food Processing
    • Food Service
    • Food Retail

    Japan Outlook (USD Billion,2019-2035)

    Japan Butter, By Product Type (USD Billion,2019-2035)

    • Standard Butter
    • Clarified Butter
    • Whipped Butter
    • Others

    Japan Butter, By Category (USD Billion,2019-2035)

    • Salted
    • Unsalted

    Japan Butter, By Form (USD Billion,2019-2035)

    • Spreads
    • Liquid/ Oil
    • Blocks
    • Others

    Japan Butter, By End-Use (USD Billion,2019-2035)

    • Food Processing
    • Food Service
    • Food Retail

    India Outlook (USD Billion,2019-2035)

    India Butter, By Product Type (USD Billion,2019-2035)

    • Standard Butter
    • Clarified Butter
    • Whipped Butter
    • Others

    India Butter, By Category (USD Billion,2019-2035)

    • Salted
    • Unsalted

    India Butter, By Form (USD Billion,2019-2035)

    • Spreads
    • Liquid/ Oil
    • Blocks
    • Others

    India Butter, By End-Use (USD Billion,2019-2035)

    • Food Processing
    • Food Service
    • Food Retail

    Australia & New Zealand Outlook (USD Billion,2019-2035)

    Australia & New Zealand Butter, By Product Type (USD Billion,2019-2035)

    • Standard Butter
    • Clarified Butter
    • Whipped Butter
    • Others

    Australia & New Zealand Butter, By Category (USD Billion,2019-2035)

    • Salted
    • Unsalted

    Australia & New Zealand Butter, By Form (USD Billion,2019-2035)

    • Spreads
    • Liquid/ Oil
    • Blocks
    • Others

    Australia & New Zealand Butter, By End-Use (USD Billion,2019-2035)

    • Food Processing
    • Food Service
    • Food Retail

    South Korea Outlook (USD Billion,2019-2035)

    South Korea Butter, By Product Type (USD Billion,2019-2035)

    • Standard Butter
    • Clarified Butter
    • Whipped Butter
    • Others

    South Korea Butter, By Category (USD Billion,2019-2035)

    • Salted
    • Unsalted

    South Korea Butter, By Form (USD Billion,2019-2035)

    • Spreads
    • Liquid/ Oil
    • Blocks
    • Others

    South Korea Butter, By End-Use (USD Billion,2019-2035)

    • Food Processing
    • Food Service
    • Food Retail

    Rest of Asia-Pacific Outlook (USD Billion,2019-2035)

    Rest of Asia-Pacific Butter, By Product Type (USD Billion,2019-2035)

    • Standard Butter
    • Clarified Butter
    • Whipped Butter
    • Others

    Rest of Asia-Pacific Butter, By Category (USD Billion,2019-2035)

    • Salted
    • Unsalted

    Rest of Asia-Pacific Butter, By Form (USD Billion,2019-2035)

    • Spreads
    • Liquid/ Oil
    • Blocks
    • Others

    Rest of Asia-Pacific Butter, By End-Use (USD Billion,2019-2035)

    • Food Processing
    • Food Service
    • Food Retail

    Rest of the World Outlook (USD Billion,2019-2035)

    Rest of the World Butter, By Product Type (USD Billion,2019-2035)

    • Standard Butter
    • Clarified Butter
    • Whipped Butter
    • Others

    Rest of the World Butter, By Category (USD Billion,2019-2035)

    • Salted
    • Unsalted

    Rest of the World Butter, By Form (USD Billion,2019-2035)

    • Spreads
    • Liquid/ Oil
    • Blocks
    • Others

    Rest of the World Butter, By End-Use (USD Billion,2019-2035)

    • Food Processing
    • Food Service
    • Food Retail

    South America Outlook (USD Billion,2019-2035)

    South America Butter, By Product Type (USD Billion,2019-2035)

    • Standard Butter
    • Clarified Butter
    • Whipped Butter
    • Others

    South America Butter, By Category (USD Billion,2019-2035)

    • Salted
    • Unsalted

    South America Butter, By Form (USD Billion,2019-2035)

    • Spreads
    • Liquid/ Oil
    • Blocks
    • Others

    South America Butter, By End-Use (USD Billion,2019-2035)

    • Food Processing
    • Food Service
    • Food Retail

    Middle East Outlook (USD Billion,2019-2035)

    Middle East Butter, By Product Type (USD Billion,2019-2035)

    • Standard Butter
    • Clarified Butter
    • Whipped Butter
    • Others

    Middle East Butter, By Category (USD Billion,2019-2035)

    • Salted
    • Unsalted

    Middle East Butter, By Form (USD Billion,2019-2035)

    • Spreads
    • Liquid/ Oil
    • Blocks
    • Others

    Middle East Butter, By End-Use (USD Billion,2019-2035)

    • Food Processing
    • Food Service
    • Food Retail

    Africa Outlook (USD Billion,2019-2035)

    Africa Butter, By Product Type (USD Billion,2019-2035)

    • Standard Butter
    • Clarified Butter
    • Whipped Butter
    • Others

    Africa Butter, By Category (USD Billion,2019-2035)

    • Salted
    • Unsalted

    Africa Butter, By Form (USD Billion,2019-2035)

    • Spreads
    • Liquid/ Oil
    • Blocks
    • Others

    Africa Butter, By End-Use (USD Billion,2019-2035)

    • Food Processing
    • Food Service
    • Food Retail
    Butter Market Research Report – Forecast Till 2035 Infographic
    Free Sample Request

    Kindly complete the form below to receive a free sample of this Report

    Customer Strories

    “I am very pleased with how market segments have been defined in a relevant way for my purposes (such as "Portable Freezers & refrigerators" and "last-mile"). In general the report is well structured. Thanks very much for your efforts.”

    Victoria Milne Founder
    Case Study

    Chemicals and Materials