• Cat-intel
  • MedIntelliX
  • Resources
  • About Us
  • Request Free Sample ×

    Kindly complete the form below to receive a free sample of this Report

    Leading companies partner with us for data-driven Insights

    clients tt-cursor

    Peanut Butter Market

    ID: MRFR/F-B & N/9879-CR
    228 Pages
    Varsha More
    July 2025

    Peanut Butter Market Research Report Information by Texture (Creamy, Crunchy, Powdered), by Claim (Low Sodium, No Sugar, Reduced Fat), by Nature (Organic and Regular), by End-Use (Direct Consumption & Culinary Purpose, Bakery & Confectionery, Dips & Spreads, Sweet & Savory Snacks, Others), by Distribution Channel (Supermarkets/Hypermarkets, Convenience Stores, Specialty Stores, Online) and Region (North America, Europe, Asia-Pacific, South America, Middle East & Africa) - Forecast till 2035

    Share:
    Download PDF ×

    We do not share your information with anyone. However, we may send you emails based on your report interest from time to time. You may contact us at any time to opt-out.

    Peanut Butter Market Research Report – Forecast Till 2035 Infographic
    Purchase Options
    $ 4,950.0
    $ 5,950.0
    $ 7,250.0
    Table of Contents

    Peanut Butter Market Summary

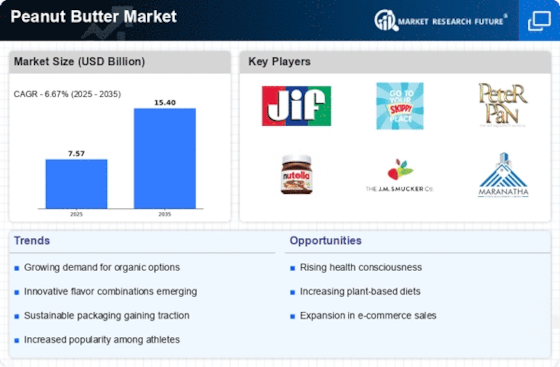
    The global peanut butter market is projected to grow from 4.5 USD billion in 2024 to 7.2 USD billion by 2035.

    Key Market Trends & Highlights

    Peanut Butter Key Trends and Highlights

    • The market is expected to experience a compound annual growth rate of 4.37 percent from 2025 to 2035.
    • By 2035, the market valuation is anticipated to reach 7.2 USD billion, indicating robust growth.
    • In 2024, the market is valued at 4.5 USD billion, highlighting its current economic significance.
    • Growing adoption of healthy eating habits due to increasing health awareness is a major market driver.

    Market Size & Forecast

    2024 Market Size 4.5 (USD Billion)
    2035 Market Size 7.2 (USD Billion)
    CAGR (2025 - 2035) 4.37%

    Major Players

    Apple Inc (US), Microsoft Corp (US), Amazon.com Inc (US), Alphabet Inc (US), Berkshire Hathaway Inc (US), Tesla Inc (US), Meta Platforms Inc (US), Johnson & Johnson (US), Visa Inc (US), Procter & Gamble Co (US)

    Peanut Butter Market Trends

    The global peanut butter market appears to be experiencing a notable shift towards healthier and more natural product offerings, reflecting consumer preferences for clean-label and organic options.

    U.S. Department of Agriculture

    Peanut Butter Market Drivers

    Rising Health Consciousness

    The Global Peanut Butter Market Industry experiences a surge in demand driven by increasing health consciousness among consumers. As individuals become more aware of the nutritional benefits of peanut butter, such as its high protein content and healthy fats, they are more inclined to incorporate it into their diets. This trend is particularly evident in regions where health trends are gaining traction, leading to a projected market value of 4.5 USD Billion in 2024. The emphasis on natural and organic products further propels this growth, as consumers seek healthier alternatives to traditional spreads.

    Market Trends and Projections

    Innovative Product Development

    Innovation plays a crucial role in the Global Peanut Butter Market Industry, as manufacturers continuously introduce new flavors and formulations to attract consumers. The emergence of flavored peanut butters, such as chocolate or honey-infused varieties, caters to diverse taste preferences. Additionally, the development of peanut butter alternatives, such as those made from other nuts or seeds, expands the market further. This trend not only enhances consumer choice but also stimulates market growth, as companies strive to differentiate their products in a competitive landscape.

    Diverse Applications in Food Products

    Peanut butter's versatility contributes significantly to the Global Peanut Butter Market Industry. It is not only consumed as a spread but also utilized in various food products such as snacks, sauces, and baked goods. This multifaceted usage enhances its appeal among manufacturers and consumers alike. For instance, the incorporation of peanut butter in protein bars and smoothies aligns with the growing trend of convenient, on-the-go nutrition. As a result, the market is expected to reach 7.2 USD Billion by 2035, reflecting a robust CAGR of 4.37% from 2025 to 2035.

    Global Distribution and E-commerce Growth

    The Global Peanut Butter Market Industry benefits from the expansion of distribution channels, particularly through e-commerce platforms. The convenience of online shopping allows consumers to access a wider variety of peanut butter products, including niche and specialty brands that may not be available in local stores. This trend is amplified by the increasing reliance on digital platforms for grocery shopping. As e-commerce continues to grow, it is likely to enhance market penetration and accessibility, contributing to the overall growth of the industry.

    Growing Vegan and Plant-Based Diet Trends

    The rise of veganism and plant-based diets significantly influences the Global Peanut Butter Market Industry. As more consumers adopt these lifestyles, the demand for plant-based protein sources, such as peanut butter, increases. This shift is particularly notable among younger demographics who prioritize sustainability and ethical consumption. Consequently, peanut butter is often viewed as a staple in vegan diets, further driving its popularity. The market's expansion is evident as it adapts to these dietary trends, positioning peanut butter as a key player in the plant-based food sector.

    Market Segment Insights

    Peanut Butter Market Segment Insights

    Peanut Butter by Texture Insights

    Based on Texture, this segment includes Creamy, Crunchy, Powdered. The Crunchy segment dominated the global market in 2024, while the Powdered segment is projected to be the fastest–growing segment during the forecast period. Crunchy peanut butter offers a coarser texture with visible peanut chunks, appealing to consumers who prefer a more textured mouthfeel and nutty bite. 

    It is often perceived as a less processed option compared to creamy peanut butter and is favored by individuals looking for a richer, more intense peanut flavor. The chunkier composition also adds a sensory element that is often sought after in snacks and sandwiches. While it is less common in regions like Asia-Pacific and Latin America, it maintains a strong foothold in North America and some parts of Europe.

    FIGURE 2: PEANUT BUTTER MARKET SHARE BY TEXTURE 2024 AND 2035 (USD BILLION)

    PEANUT BUTTER MARKET SHARE BY TEXTURE 2024 AND 2035

    Source: Secondary Research, Primary Research, MRFR Database and Analyst Review

    Peanut Butter by Claim Insights

    Based on Claim, this segment includes Low Sodium, No Sugar, Reduced Fat. The No Sugar segment dominated the global market in 2024, while it is projected to be the fastest–growing segment during the forecast period. No sugar peanut butter, also referred to as sugar-free or unsweetened peanut butter, is developed for consumers looking to limit or eliminate added sugars from their diet. 

    This segment is particularly appealing to people managing diabetes, obesity, or those following low-carb or ketogenic diets. In these variants, manufacturers avoid adding sweeteners like cane sugar, high fructose corn syrup, or molasses, and instead emphasize the natural sweetness derived from the peanuts themselves. Some brands might use natural sugar substitutes like stevia or erythritol, though purists prefer completely unsweetened versions.

    Peanut Butter by Nature Insights

    Based on Nature, this segment includes Organic and Regular. The Regular segment dominated the global market in 2024, while the Organic segment is projected to be the fastest–growing segment during the forecast period. Regular peanut butter dominates the Peanut Butter Market in terms of volume and value. It is made using conventionally grown peanuts and may contain additional ingredients such as salt, sugar, hydrogenated oils, and stabilizers to enhance shelf life, texture, and taste. 

    This type of peanut butter is widely available across mainstream retail outlets and is particularly favored for its affordability and consistent flavor profile. It includes both creamy and crunchy varieties, and in many regions, it serves as a staple pantry item.

    Peanut Butter by End-Use Insights

    Based on End-Use, this segment includes Direct Consumption & Culinary Purpose, Bakery & Confectionery, Dips & Spreads, Sweet & Savory Snacks, Others. The Direct Consumption & Culinary Purpose segment dominated the global market in 2024, while the Sweet & Savory Snacks segment is projected to be the fastest–growing segment during the forecast period. Peanut butter's use in direct consumption remains one of the most dominant segments in the global market. 

    Consumers across North America, Europe, and emerging Asian economies often consume it as a standalone spread on bread, toast, or crackers. The high protein content and satiety offered by peanut butter have made it a preferred option for health-conscious consumers, athletes, and children. Its use as a convenient breakfast or snack item aligns well with the growing trend toward high-protein, plant-based foods.

    Peanut Butter by Distribution Channel Insights

    Based on Distribution Channel, this segment includes Supermarkets/Hypermarkets, Convenience Stores, Specialty Stores, Online. The Supermarkets/Hypermarkets segment dominated the global market in 2024, while the Online segment is projected to be the fastest–growing segment during the forecast period. Supermarkets and hypermarkets are the most dominant distribution channels for peanut butter globally, primarily due to their widespread reach and the convenience of a one-stop shopping experience. 

    These large-format retail outlets provide a broad assortment of food and grocery products, including multiple brands and variants of peanut butter under one roof. Their wide shelf space allows both global and regional manufacturers to showcase a variety of peanut butter options, ranging from conventional and natural to flavored, low-sodium, or sugar-free types. Consumers also benefit from competitive pricing, promotional discounts, and product bundling, making this channel highly attractive for regular grocery shoppers.

    Peanut Butter

    Regional Insights

    Based on the Region, the global Peanut Butter are segmented into North America, Europe, Asia-Pacific, South America and Middle East & Africa. The Asia Pacific dominated the global market in 2024, while it is projected to be the fastest–growing segment during the forecast period. Major demand factors driving the Asia Pacific market are the growing demand for plant-based and vegan food options and rising popularity of peanut butter as a protein source. 

    The Asia Pacific peanut butter market has undergone significant transformation in recent years, primarily driven by rising health consciousness, urbanization, and increasing acceptance of Western eating habits across diverse consumer demographics. Traditionally, peanut butter was not a staple in many Asian diets. However, evolving lifestyles and dietary shifts, especially in urban areas of countries like China, India, Japan, South Korea, Indonesia, and Australia, have created a fertile ground for peanut butter to become more mainstream. 

    This change is closely tied to the rising demand for convenient, protein-rich food options, particularly among middle-class and millennial consumers who seek nutritious yet tasty alternatives to traditional breakfast and snack foods. With rising disposable incomes, there is growing adoption of spreads that are perceived as healthy and premium, such as peanut butter with low sugar, added nutrients, and natural or organic ingredients.

    FIGURE 3: PEANUT BUTTER MARKET VALUE BY REGION 2024 AND 2035 (USD BILLION)

    PEANUT BUTTER MARKET VALUE BY REGION 2024 AND 2035

    Source: Secondary Research, Primary Research, MRFR Database, and Analyst Review

    Further, the countries considered in the scope of the Application Tracking System Market are the US, Canada, Mexico, Germany, UK, France, Spain, Italy, China, India, Japan, South Korea, Australia & New Zealand, Brazil, Argentina, GCC Countries, Turkey, Northern Africa, Southern Africa and others.

    Key Players and Competitive Insights

    Many global, regional, and local vendors characterize the Peanut Butter Market. The market is highly competitive, with all the players competing to gain market share. Intense competition, rapid advances in technology, frequent changes in government policies, and environmental regulations are key factors that confront market growth. The vendors compete based on cost, product quality, reliability, and government regulations. Vendors must provide cost-efficient, high-quality products to survive and succeed in an intensely competitive market.

    The major competitors in the market are Hormel Foods Corporation, J.M. Smucker Company, Dr Oetker, The Hershey Company, Kraft Heinz, Kellogg Company, Mars, Inc., Unilever Plc, Associated British Foods plc, Conagra Brands, Inc. are among others. The Peanut Butter Market is a consolidated market due to increasing competition, acquisitions, mergers and other strategic market developments and decisions to improve operational effectiveness.

    Key Companies in the Peanut Butter Market market include

    Industry Developments

    January 2025: Mars introduced the M&M'S Peanut Butter Ice Cream Cookie Sandwich, combining M&M'S Milk Chocolate Minis, sugar cookies, and real peanut butter ice cream. This launch was timed to celebrate National Peanut Butter Day and targets Gen Z and millennial consumers who favor peanut butter flavors in ice cream products.

    April 2025: Hershey launched a new product called Reese's Filled Pretzels, which combines crunchy pretzels with peanut butter, expanding their peanut butter snack offerings.

    May 2024: Jif announced its biggest flavor innovation in nearly 10 years with the launch of a new Peanut Butter & Chocolate Flavored Spread, expanding its product offerings in the peanut butter category.

    August 2024: Hormel Foods finalized the acquisition of the SKIPPY peanut butter business from Unilever United States Inc. This acquisition included 11 varieties of shelf-stable peanut butter products and expanded Hormel's branded presence in the protein snack market.

    Peanut Butter Market Segmentation

    Peanut Butter by Texture Outlook

    • Creamy
    • Crunchy
    • Powdered

    Peanut Butter by Claim Outlook

    • Low Sodium
    • No Sugar
    • Reduced Fat

    Peanut Butter by Nature Outlook

    • Organic
    • Regular

    Peanut Butter by End-Use Outlook

    • Direct Consumption & Culinary Purpose
    • Bakery & Confectionery
    • Dips & Spreads
    • Sweet & Savory Snacks
    • Others

    Peanut Butter by Distribution Channel Outlook

    • Supermarkets/Hypermarkets
    • Convenience Stores
    • Specialty Stores
    • Online

    Peanut Butter Regional Outlook

    • North America
      • US
      • Canada
      • Mexico
    • Europe
      • Germany
      • UK
      • France
      • Spain
      • Italy
      • Rest of Europe
    • Asia-Pacific
      • China
      • India
      • Japan
      • South Korea
      • Australia & New Zealand
      • Rest of Asia Pacific
    • South America
      • Brazil
      • Argentina
      • Rest of South America
    • Middle East & Africa
      • GCC Countries
      • Turkey
      • Northern Africa
      • Southern Africa
      • Rest of Middle East & Africa

    Future Outlook

    Peanut Butter Market Future Outlook

    The Global Peanut Butter Market is projected to grow at a 4.37% CAGR from 2024 to 2035, driven by rising health consciousness, innovative product development, and increasing demand for plant-based protein.

    New opportunities lie in:

    • Develop organic and non-GMO peanut butter lines to cater to health-conscious consumers.
    • Leverage e-commerce platforms for direct-to-consumer sales, enhancing market reach.
    • Invest in sustainable sourcing and packaging to appeal to environmentally aware customers.

    By 2035, the market is expected to demonstrate robust growth, reflecting evolving consumer preferences and innovative product offerings.

    Market Segmentation

    Regional Outlook

    • US
    • Canada
    • Mexico

    Peanut Butter by Claim Outlook

    • Low Sodium
    • No Sugar
    • Reduced Fat

    Peanut Butter by Nature Outlook

    • Organic
    • Regular

    Peanut Butter by End-Use Outlook

    • Direct Consumption & Culinary Purpose
    • Bakery & Confectionery
    • Dips & Spreads
    • Sweet & Savory Snacks
    • Others

    Peanut Butter by Texture Outlook

    • Creamy
    • Crunchy
    • Powdered

    Peanut Butter by Distribution Channel Outlook

    • Supermarkets/Hypermarkets
    • Convenience Stores
    • Specialty Stores
    • Online

    Report Scope

    Report Attribute/Metric

    Details

    Market Size 2024

    USD 7.57 Billion

    Market Size 2025

    USD 8.06 Billion

    Market Size 2035

    USD 15.37 Billion

    Compound Annual Growth Rate (CAGR)

    6.67% (2025-2035)

    Base Year

    2024

    Forecast Period

    2025-2035

    Historical Data

    2019-2023

    Forecast Units

    Value, Volume (USD Billion, Thousand Tons)

    Report Coverage

    Revenue Forecast, Competitive Landscape, Growth Factors, and Trends

    Segments Covered

    By Texture, By Claim, By Nature, By End-Use, By Distribution Channel

    Geographies Covered

    North America, Europe, Asia Pacific, South America, Middle East & Africa

    Countries Covered

    The US, Canada, Mexico, Germany, UK, France, Spain, Italy, China, India, Japan, South Korea, Australia & New Zealand, Brazil, Argentina, GCC Countries, Turkey, Northern Africa, Southern Africa

    Key Companies Profiled

    Hormel Foods Corporation, J.M. Smucker Company, Dr Oetker, The Hershey Company, Kraft Heinz, Kellogg Company, Mars, Inc., Unilever Plc, Associated British Foods plc, Conagra Brands, Inc.

    Key Market Opportunities

    ·         Growth in demand for natural and organic peanut butter

    ·         Innovative peanut butter flavors attracting diverse consumer tastes

    Key Market Dynamics

    ·         Growing demand for plant-based and vegan food options

    ·         Rising Popularity of Peanut Butter as a Protein Source

    Market Highlights

    Author
    Varsha More
    Research Analyst

    Experienced business professional with a demonstrated history of working in the CFnB industry. Skilled in market research, and market estimation. Strong professional with a Masters focused in marketing management.

    Leave a Comment

    FAQs

    How much is the Peanut Butter Market?

    USD 7.57 Billion is the Peanut Butter Market in 2024

    Which Texture holds the largest market share?

    The Crunchy segment by Material holds the largest market share and grows at a CAGR of 6.27 % during the forecast period.

    Which region holds the largest market share in the Peanut Butter Market?

    Asia-Pacific holds the largest market share in the Peanut Butter Market.

    Who are the prominent players in the Peanut Butter Market?

    Hormel Foods Corporation, J.M. Smucker Company, Dr Oetker, The Hershey Company, Kraft Heinz, Kellogg Company, Mars, Inc., Unilever Plc, Associated British Foods plc, Conagra Brands, Inc. are prominent players in the Peanut Butter Market.

    Which Claim segment led the Peanut Butter Market?

    The No Sugar segment dominated the market in 2024.

    1. EXECUTIVE SUMMARY
    2. MARKET INTRODUCTION
    3. DEFINITION
      1. SCOPE OF THE STUDY
      2. RESEARCH OBJECTIVE
      3. MARKET
    4. STRUCTURE
      1. KEY BUYING CRITERIA
    5. RESEARCH METHODOLOGY
      1. OVERVIEW
      2. DATA FLOW
        1. DATA MINING PROCESS
      3. PURCHASED DATABASE:
    6. SECONDARY SOURCES:
      1. SECONDARY RESEARCH DATA FLOW:
      2. PRIMARY RESEARCH:
        1. PRIMARY RESEARCH DATA FLOW:
        2. PRIMARY RESEARCH: NUMBER OF INTERVIEWS
    7. CONDUCTED
      1. PRIMARY RESEARCH: REGIONAL COVERAGE
      2. APPROACHES FOR
    8. MARKET SIZE ESTIMATION:
      1. CONSUMPTION & NET TRADE APPROACH
    9. REVENUE ANALYSIS APPROACH
      1. DATA FORECASTING
        1. DATA FORECASTING
    10. TECHNIQUE
      1. DATA MODELING
        1. MICROECONOMIC FACTOR ANALYSIS:
    11. DATA MODELING:
      1. TEAMS AND ANALYST CONTRIBUTION
    12. MARKET DYNAMICS
      1. INTRODUCTION
      2. DRIVERS
        1. GROWING DEMAND FOR PLANT-BASED AND
    13. VEGAN FOOD OPTIONS
      1. RISING POPULARITY OF PEANUT BUTTER AS A PROTEIN SOURCE
      2. RESTRAINTS
        1. PRICE VOLATILITY OF RAW MATERIALS LIKE PEANUTS AND OILS
        2. LIMITED SHELF LIFE DUE TO NATURAL INGREDIENT PRESERVATION ISSUES
    14. OPPORTUNITY
      1. GROWTH IN DEMAND FOR NATURAL AND ORGANIC PEANUT BUTTER
        1. INNOVATIVE PEANUT BUTTER FLAVORS ATTRACTING DIVERSE CONSUMER TASTES
    15. CHALLENGE
      1. GROWING COMPETITION FROM ALTERNATIVE NUT BUTTER PRODUCTS
        1. SEASONAL FLUCTUATIONS IMPACTING PEANUT CROP YIELDS AND PRICES
      2. STRATEGIC
    16. INSIGHTS
      1. TECHNOLOGY UPDATE
        1. REGIONAL MARKETS TO LOOKOUT FOR
      2. REGULATORY UPDATE
      3. MARKET TRENDS
      4. IMPACT ANALYSIS OF COVID
        1. IMPACT ON THE OVERALL FOOD & BEVERAGES INDUSTRY
        2. IMPACT
    17. ON THE GLOBAL PEANUT BUTTER MARKET
      1. IMPACT ON THE SUPPLY CHAIN OF PEANUT
    18. BUTTER
      1. IMPACT ON MARKET DEMAND FOR PEANUT BUTTER
        1. IMPACT ON
    19. PRICING OF PEANUT BUTTER
    20. MARKET FACTOR ANALYSIS
      1. SUPPLY CHAIN ANALYSIS
        1. RAW MATERIAL SUPPLIER
        2. MANUFACTURING / PRODUCTION / PROCESSING
        3. PACKING
      2. VALUE CHAIN ANALYSIS
        1. PARTICIPANTS (AT DIFFERENT
    21. NODES)
      1. RAW MATERIAL AND INGREDIENT SUPPLIERS
        1. DISTRIBUTION
    22. CHANNELS
      1. END USERS
        1. INTEGRATION LEVELS
        2. KEY ISSUES
    23. ADDRESSED (KEY SUCCESS FACTORS)
      1. PORTER’S FIVE FORCES MODEL
    24. THREAT OF NEW ENTRANTS
      1. BARGAINING POWER OF SUPPLIERS
        1. THREAT
    25. OF SUBSTITUTES
      1. BARGAINING POWER OF BUYERS
        1. INTENSITY OF RIVALRY
      2. REGULATORY LANDSCAPE
    26. GLOBAL PEANUT BUTTER MARKET, BY TEXTURE
    27. INTRODUCTION
      1. CREAMY
      2. CRUNCHY
      3. POWDERED
    28. GLOBAL PEANUT
    29. BUTTER MARKET, BY CLAIM
      1. INTRODUCTION
      2. LOW SODIUM
      3. NO SUGAR
      4. REDUCED FAT
    30. GLOBAL PEANUT BUTTER MARKET, BY NATURE
      1. INTRODUCTION
      2. ORGANIC
      3. REGULAR
    31. GLOBAL PEANUT BUTTER MARKET, BY END-USE
      1. INTRODUCTION
      2. DIRECT CONSUMPTION & CULINARY PURPOSE
      3. BAKERY
    32. & CONFECTIONERY
      1. DIPS & SPREADS
      2. SWEET & SAVORY SNACKS
      3. OTHERS
    33. GLOBAL PEANUT BUTTER MARKET, BY DISTRIBUTION CHANNEL
    34. INTRODUCTION
      1. SUPERMARKETS/HYPERMARKETS
      2. CONVENIENCE STORES
      3. SPECIALTY STORES
      4. ONLINE
    35. GLOBAL PEANUT BUTTER MARKET, BY
    36. REGION
      1. OVERVIEW
      2. NORTH AMERICA
        1. US
        2. CANADA
        3. MEXICO
      3. EUROPE
        1. GERMANY
        2. UK
    37. FRANCE
      1. SPAIN
        1. ITALY
        2. REST OF EUROPE
    38. ASIA PACIFIC
      1. CHINA
        1. INDIA
        2. JAPAN
        3. SOUTH
    39. KOREA
      1. AUSTRALIA & NEW ZEALAND
        1. REST OF ASIA PACIFIC
      2. SOUTH AMERICA
        1. BRAZIL
        2. ARGENTINA
        3. REST OF
    40. SOUTH AMERICA
      1. MIDDLE EAST & AFRICA
        1. GCC COUNTRIES
    41. TURKEY
      1. NORTHERN AFRICA
        1. SOUTHERN AFRICA
        2. REST
    42. OF MIDDLE EAST & AFRICA
    43. COMPETITIVE LANDSCAPE
      1. COMPETITIVE
    44. OVERVIEW
      1. MAJOR PLAYERS IN THE GLOBAL PEANUT BUTTER MARKET
      2. MAJOR
    45. PLAYERS IN TERMS OF MARKET DISRUPTORS & INNOVATORS
      1. COMPETITIVE BENCHMARKING
      2. STRATEGIES OF MARKET LEADERS IN THE GLOBAL PEANUT BUTTER MARKET
    46. HORMEL FOODS CORPORATION
      1. KELLOGG COMPANY
        1. MARS, INC.
    47. UNILEVER PLC
      1. J.M. SMUCKER COMPANY
      2. LEADING PLAYERS IN TERMS
    48. OF THE NUMBER OF DEVELOPMENTS IN GLOBAL PPF MARKET
      1. KEY DEVELOPMENTS &
    49. GROWTH STRATEGIES
      1. PRODUCT LAUNCH/PRODUCT DEVELOPMENT
        1. PARTNERSHIPS/ACQUISITION
    50. COMPANY PROFILES
      1. HORMEL FOODS CORPORATION
        1. COMPANY OVERVIEW
        2. FINANCIAL OVERVIEW
        3. PRODUCTS/SERVICES OFFERED
        4. KEY
    51. DEVELOPMENTS
      1. SWOT ANALYSIS
        1. KEY STRATEGIES
      2. J.M.
    52. SMUCKER COMPANY
      1. COMPANY OVERVIEW
        1. FINANCIAL OVERVIEW
    53. PRODUCTS OFFERED
      1. KEY DEVELOPMENTS
        1. SWOT ANALYSIS
    54. KEY STRATEGIES
      1. DR OETKER
        1. COMPANY OVERVIEW
        2. FINANCIAL
    55. OVERVIEW
      1. PRODUCTS OFFERED
        1. KEY DEVELOPMENTS
        2. SWOT
    56. ANALYSIS
      1. KEY STRATEGIES
      2. THE HERSHEY COMPANY
        1. COMPANY
    57. OVERVIEW
      1. FINANCIAL OVERVIEW
        1. PRODUCTS OFFERED
    58. KEY DEVELOPMENTS
      1. SWOT ANALYSIS
        1. KEY STRATEGIES
    59. KRAFT HEINZ
      1. COMPANY OVERVIEW
        1. FINANCIAL OVERVIEW
    60. PRODUCTS/SERVICES OFFERED
      1. KEY DEVELOPMENTS
        1. SWOT ANALYSIS
        2. KEY STRATEGIES
      2. KELLOGG COMPANY
        1. COMPANY OVERVIEW
        2. FINANCIAL OVERVIEW
        3. PRODUCTS OFFERED
        4. KEY DEVELOPMENTS
        5. SWOT ANALYSIS
        6. KEY STRATEGIES
      3. MARS, INC.
    61. COMPANY OVERVIEW
      1. FINANCIAL OVERVIEW
        1. PRODUCTS OFFERED
        2. KEY DEVELOPMENTS
        3. SWOT ANALYSIS
        4. KEY STRATEGIES
      2. UNILEVER PLC
        1. COMPANY OVERVIEW
        2. FINANCIAL OVERVIEW
        3. PRODUCTS OFFERED
        4. KEY DEVELOPMENTS
        5. SWOT ANALYSIS
        6. KEY STRATEGIES
      3. ASSOCIATED BRITISH FOODS PLC
        1. COMPANY
    62. OVERVIEW
      1. FINANCIAL OVERVIEW
        1. PRODUCTS OFFERED
    63. KEY DEVELOPMENTS
      1. SWOT ANALYSIS
        1. KEY STRATEGIES
    64. CONAGRA BRANDS, INC.
      1. COMPANY OVERVIEW
        1. FINANCIAL OVERVIEW
        2. PRODUCTS OFFERED
        3. KEY DEVELOPMENTS
        4. SWOT ANALYSIS
        5. KEY STRATEGIES
    65. LIST
    66. OF TABLES
    67. PEANUT BUTTER MARKET, BY TEXTURE, 2019-2035 (USD BILLION)
    68. BUTTER MARKET, BY TEXTURE, 2019-2035 (THOUSAND TONS)
    69. BUTTER MARKET, BY CLAIM, 2019-2035 (USD BILLION)
    70. MARKET, BY CLAIM, 2019-2035 (THOUSAND TONS)
    71. BY NATURE, 2019-2035 (USD BILLION)
    72. NATURE, 2019-2035 (THOUSAND TONS)
    73. 2035 (USD BILLION)
    74. (THOUSAND TONS)
    75. 2035 (USD BILLION)
    76. CHANNEL, 2019-2035 (THOUSAND TONS)
    77. REGION, 2019-2035 (USD BILLION)
    78. 2035 (THOUSAND TONS)
    79. 2035 (USD BILLION)
    80. 2035 (THOUSAND TONS)
    81. 2035 (USD BILLION)
    82. 2035 (THOUSAND TONS)
    83. 2035 (USD BILLION)
    84. 2035 (THOUSAND TONS)
    85. 2035 (USD BILLION)
    86. 2035 (THOUSAND TONS)
    87. 2035 (USD BILLION)
    88. 2035 (THOUSAND TONS)
    89. CHANNEL, 2019-2035 (USD BILLION)
    90. BY DISTRIBUTION CHANNEL, 2019-2035 (THOUSAND TONS)
    91. MARKET, BY TEXTURE, 2019-2035 (USD BILLION)
    92. BY TEXTURE, 2019-2035 (THOUSAND TONS)
    93. CLAIM, 2019-2035 (USD BILLION)
    94. 2035 (THOUSAND TONS)
    95. (USD BILLION)
    96. TONS)
    97. US PEANUT BUTTER MARKET, BY DISTRIBUTION CHANNEL, 2019-2035 (USD BILLION)
    98. TONS)
    99. CANADA PEANUT BUTTER MARKET, BY CLAIM, 2019-2035 (THOUSAND TONS)
    100. CANADA PEANUT BUTTER MARKET, BY NATURE, 2019-2035 (USD BILLION)
    101. PEANUT BUTTER MARKET, BY NATURE, 2019-2035 (THOUSAND TONS)
    102. PEANUT BUTTER MARKET, BY END-USE, 2019-2035 (USD BILLION)
    103. BUTTER MARKET, BY END-USE, 2019-2035 (THOUSAND TONS)
    104. BUTTER MARKET, BY DISTRIBUTION CHANNEL, 2019-2035 (USD BILLION)
    105. PEANUT BUTTER MARKET, BY DISTRIBUTION CHANNEL, 2019-2035 (THOUSAND TONS)
    106. MEXICO PEANUT BUTTER MARKET, BY TEXTURE, 2019-2035 (USD BILLION)
    107. MEXICO PEANUT BUTTER MARKET, BY TEXTURE, 2019-2035 (THOUSAND TONS)
    108. MEXICO PEANUT BUTTER MARKET, BY CLAIM, 2019-2035 (USD BILLION)
    109. PEANUT BUTTER MARKET, BY CLAIM, 2019-2035 (THOUSAND TONS)
    110. BUTTER MARKET, BY NATURE, 2019-2035 (USD BILLION)
    111. MARKET, BY NATURE, 2019-2035 (THOUSAND TONS)
    112. MARKET, BY END-USE, 2019-2035 (USD BILLION)
    113. BY END-USE, 2019-2035 (THOUSAND TONS)
    114. BY DISTRIBUTION CHANNEL, 2019-2035 (USD BILLION)
    115. MARKET, BY DISTRIBUTION CHANNEL, 2019-2035 (THOUSAND TONS)
    116. PEANUT BUTTER MARKET, BY COUNTRY, 2019-2035 (USD BILLION)
    117. BUTTER MARKET, BY COUNTRY, 2019-2035 (THOUSAND TONS)
    118. BUTTER MARKET, BY TEXTURE, 2019-2035 (USD BILLION)
    119. MARKET, BY TEXTURE, 2019-2035 (THOUSAND TONS)
    120. MARKET, BY CLAIM, 2019-2035 (USD BILLION)
    121. BY CLAIM, 2019-2035 (THOUSAND TONS)
    122. NATURE, 2019-2035 (USD BILLION)
    123. 2035 (THOUSAND TONS)
    124. 2035 (USD BILLION)
    125. (THOUSAND TONS)
    126. 2035 (USD BILLION)
    127. CHANNEL, 2019-2035 (THOUSAND TONS)
    128. TEXTURE, 2019-2035 (USD BILLION)
    129. TEXTURE, 2019-2035 (THOUSAND TONS)
    130. CLAIM, 2019-2035 (USD BILLION)
    131. 2035 (THOUSAND TONS)
    132. 2035 (USD BILLION)
    133. (THOUSAND TONS)
    134. (USD BILLION)
    135. (THOUSAND TONS)
    136. 2035 (USD BILLION)
    137. CHANNEL, 2019-2035 (THOUSAND TONS)
    138. 2035 (USD BILLION)
    139. (THOUSAND TONS)
    140. BILLION)
    141. UK PEANUT BUTTER MARKET, BY NATURE, 2019-2035 (THOUSAND TONS)
    142. PEANUT BUTTER MARKET, BY END-USE, 2019-2035 (USD BILLION)
    143. BUTTER MARKET, BY END-USE, 2019-2035 (THOUSAND TONS)
    144. MARKET, BY DISTRIBUTION CHANNEL, 2019-2035 (USD BILLION)
    145. BUTTER MARKET, BY DISTRIBUTION CHANNEL, 2019-2035 (THOUSAND TONS)
    146. FRANCE PEANUT BUTTER MARKET, BY TEXTURE, 2019-2035 (USD BILLION)
    147. PEANUT BUTTER MARKET, BY TEXTURE, 2019-2035 (THOUSAND TONS)
    148. PEANUT BUTTER MARKET, BY CLAIM, 2019-2035 (USD BILLION)
    149. BUTTER MARKET, BY CLAIM, 2019-2035 (THOUSAND TONS)
    150. MARKET, BY NATURE, 2019-2035 (USD BILLION)
    151. BY NATURE, 2019-2035 (THOUSAND TONS)
    152. BY END-USE, 2019-2035 (USD BILLION)
    153. END-USE, 2019-2035 (THOUSAND TONS)
    154. DISTRIBUTION CHANNEL, 2019-2035 (USD BILLION)
    155. MARKET, BY DISTRIBUTION CHANNEL, 2019-2035 (THOUSAND TONS)
    156. BUTTER MARKET, BY TEXTURE, 2019-2035 (USD BILLION)
    157. MARKET, BY TEXTURE, 2019-2035 (THOUSAND TONS)
    158. MARKET, BY CLAIM, 2019-2035 (USD BILLION)
    159. BY CLAIM, 2019-2035 (THOUSAND TONS)
    160. NATURE, 2019-2035 (USD BILLION)
    161. 2035 (THOUSAND TONS)
    162. 2035 (USD BILLION)
    163. (THOUSAND TONS)
    164. 2035 (USD BILLION)
    165. CHANNEL, 2019-2035 (THOUSAND TONS)
    166. TEXTURE, 2019-2035 (USD BILLION)
    167. 2035 (THOUSAND TONS)
    168. (USD BILLION)
    169. TONS)
    170. ITALY PEANUT BUTTER MARKET, BY END-USE, 2019-2035 (THOUSAND TONS)
    171. ITALY PEANUT BUTTER MARKET, BY DISTRIBUTION CHANNEL, 2019-2035 (USD BILLION)
    172. TONS)
    173. (USD BILLION)
    174. (THOUSAND TONS)
    175. (USD BILLION)
    176. (THOUSAND TONS)
    177. (USD BILLION)
    178. (THOUSAND TONS)
    179. 2035 (USD BILLION)
    180. 2035 (THOUSAND TONS)
    181. DISTRIBUTION CHANNEL, 2019-2035 (USD BILLION)
    182. BUTTER MARKET, BY DISTRIBUTION CHANNEL, 2019-2035 (THOUSAND TONS)
    183. ASIA PACIFIC PEANUT BUTTER MARKET, BY COUNTRY, 2019-2035 (USD BILLION)
    184. ASIA PACIFIC PEANUT BUTTER MARKET, BY COUNTRY, 2019-2035 (THOUSAND TONS)
    185. (USD BILLION)
    186. CHANNEL, 2019-2035 (THOUSAND TONS)
    187. TEXTURE, 2019-2035 (USD BILLION)
    188. 2035 (THOUSAND TONS)
    189. (USD BILLION)
    190. TONS)
    191. CHINA PEANUT BUTTER MARKET, BY END-USE, 2019-2035 (THOUSAND TONS)
    192. CHINA PEANUT BUTTER MARKET, BY DISTRIBUTION CHANNEL, 2019-2035 (USD BILLION)
    193. TONS)
    194. INDIA PEANUT BUTTER MARKET, BY CLAIM, 2019-2035 (THOUSAND TONS)
    195. INDIA PEANUT BUTTER MARKET, BY NATURE, 2019-2035 (USD BILLION)
    196. PEANUT BUTTER MARKET, BY NATURE, 2019-2035 (THOUSAND TONS)
    197. PEANUT BUTTER MARKET, BY END-USE, 2019-2035 (USD BILLION)
    198. BUTTER MARKET, BY END-USE, 2019-2035 (THOUSAND TONS)
    199. BUTTER MARKET, BY DISTRIBUTION CHANNEL, 2019-2035 (USD BILLION)
    200. PEANUT BUTTER MARKET, BY DISTRIBUTION CHANNEL, 2019-2035 (THOUSAND TONS)
    201. JAPAN PEANUT BUTTER MARKET, BY TEXTURE, 2019-2035 (USD BILLION)
    202. JAPAN PEANUT BUTTER MARKET, BY TEXTURE, 2019-2035 (THOUSAND TONS)
    203. JAPAN PEANUT BUTTER MARKET, BY CLAIM, 2019-2035 (USD BILLION)
    204. PEANUT BUTTER MARKET, BY CLAIM, 2019-2035 (THOUSAND TONS)
    205. BUTTER MARKET, BY NATURE, 2019-2035 (USD BILLION)
    206. MARKET, BY NATURE, 2019-2035 (THOUSAND TONS)
    207. MARKET, BY END-USE, 2019-2035 (USD BILLION)
    208. BY END-USE, 2019-2035 (THOUSAND TONS)
    209. BY DISTRIBUTION CHANNEL, 2019-2035 (USD BILLION)
    210. MARKET, BY DISTRIBUTION CHANNEL, 2019-2035 (THOUSAND TONS)
    211. KOREA PEANUT BUTTER MARKET, BY TEXTURE, 2019-2035 (USD BILLION)
    212. KOREA PEANUT BUTTER MARKET, BY TEXTURE, 2019-2035 (THOUSAND TONS)
    213. SOUTH KOREA PEANUT BUTTER MARKET, BY CLAIM, 2019-2035 (USD BILLION)
    214. SOUTH KOREA PEANUT BUTTER MARKET, BY CLAIM, 2019-2035 (THOUSAND TONS)
    215. SOUTH KOREA PEANUT BUTTER MARKET, BY NATURE, 2019-2035 (USD BILLION)
    216. SOUTH KOREA PEANUT BUTTER MARKET, BY NATURE, 2019-2035 (THOUSAND TONS)
    217. SOUTH KOREA PEANUT BUTTER MARKET, BY END-USE, 2019-2035 (USD BILLION)
    218. SOUTH KOREA PEANUT BUTTER MARKET, BY END-USE, 2019-2035 (THOUSAND TONS)
    219. SOUTH KOREA PEANUT BUTTER MARKET, BY DISTRIBUTION CHANNEL, 2019-2035 (USD BILLION)
    220. (THOUSAND TONS)
    221. BY TEXTURE, 2019-2035 (USD BILLION)
    222. BUTTER MARKET, BY TEXTURE, 2019-2035 (THOUSAND TONS)
    223. NEW ZEALAND PEANUT BUTTER MARKET, BY CLAIM, 2019-2035 (USD BILLION)
    224. AUSTRALIA & NEW ZEALAND PEANUT BUTTER MARKET, BY CLAIM, 2019-2035 (THOUSAND
    225. TONS)
    226. 2035 (USD BILLION)
    227. MARKET, BY NATURE, 2019-2035 (THOUSAND TONS)
    228. ZEALAND PEANUT BUTTER MARKET, BY END-USE, 2019-2035 (USD BILLION)
    229. AUSTRALIA & NEW ZEALAND PEANUT BUTTER MARKET, BY END-USE, 2019-2035 (THOUSAND
    230. TONS)
    231. CHANNEL, 2019-2035 (USD BILLION)
    232. BUTTER MARKET, BY DISTRIBUTION CHANNEL, 2019-2035 (THOUSAND TONS)
    233. REST OF ASIA PACIFIC PEANUT BUTTER MARKET, BY TEXTURE, 2019-2035 (USD BILLION)
    234. TONS)
    235. (USD BILLION)
    236. 2035 (THOUSAND TONS)
    237. BY NATURE, 2019-2035 (USD BILLION)
    238. MARKET, BY NATURE, 2019-2035 (THOUSAND TONS)
    239. PEANUT BUTTER MARKET, BY END-USE, 2019-2035 (USD BILLION)
    240. ASIA PACIFIC PEANUT BUTTER MARKET, BY END-USE, 2019-2035 (THOUSAND TONS)
    241. REST OF ASIA PACIFIC PEANUT BUTTER MARKET, BY DISTRIBUTION CHANNEL, 2019-2035
    242. (USD BILLION)
    243. CHANNEL, 2019-2035 (THOUSAND TONS)
    244. BY COUNTRY, 2019-2035 (USD BILLION)
    245. BY COUNTRY, 2019-2035 (THOUSAND TONS)
    246. MARKET, BY TEXTURE, 2019-2035 (USD BILLION)
    247. BUTTER MARKET, BY TEXTURE, 2019-2035 (THOUSAND TONS)
    248. PEANUT BUTTER MARKET, BY CLAIM, 2019-2035 (USD BILLION)
    249. PEANUT BUTTER MARKET, BY CLAIM, 2019-2035 (THOUSAND TONS)
    250. PEANUT BUTTER MARKET, BY NATURE, 2019-2035 (USD BILLION)
    251. PEANUT BUTTER MARKET, BY NATURE, 2019-2035 (THOUSAND TONS)
    252. AMERICA PEANUT BUTTER MARKET, BY END-USE, 2019-2035 (USD BILLION)
    253. SOUTH AMERICA PEANUT BUTTER MARKET, BY END-USE, 2019-2035 (THOUSAND TONS)
    254. SOUTH AMERICA PEANUT BUTTER MARKET, BY DISTRIBUTION CHANNEL, 2019-2035 (USD
    255. BILLION)
    256. 2035 (THOUSAND TONS)
    257. 2035 (USD BILLION)
    258. 2035 (THOUSAND TONS)
    259. 2035 (USD BILLION)
    260. (THOUSAND TONS)
    261. (USD BILLION)
    262. TONS)
    263. BILLION)
    264. (THOUSAND TONS)
    265. (USD BILLION)
    266. (THOUSAND TONS)
    267. (USD BILLION)
    268. (THOUSAND TONS)
    269. (USD BILLION)
    270. (THOUSAND TONS)
    271. (USD BILLION)
    272. (THOUSAND TONS)
    273. 2035 (USD BILLION)
    274. CHANNEL, 2019-2035 (THOUSAND TONS)
    275. MARKET, BY TEXTURE, 2019-2035 (USD BILLION)
    276. PEANUT BUTTER MARKET, BY TEXTURE, 2019-2035 (THOUSAND TONS)
    277. OF SOUTH AMERICA PEANUT BUTTER MARKET, BY CLAIM, 2019-2035 (USD BILLION)
    278. REST OF SOUTH AMERICA PEANUT BUTTER MARKET, BY CLAIM, 2019-2035 (THOUSAND TONS)
    279. BILLION)
    280. (THOUSAND TONS)
    281. 2035 (USD BILLION)
    282. BY END-USE, 2019-2035 (THOUSAND TONS)
    283. BUTTER MARKET, BY DISTRIBUTION CHANNEL, 2019-2035 (USD BILLION)
    284. OF SOUTH AMERICA PEANUT BUTTER MARKET, BY DISTRIBUTION CHANNEL, 2019-2035 (THOUSAND
    285. TONS)
    286. 2035 (USD BILLION)
    287. BY COUNTRY, 2019-2035 (THOUSAND TONS)
    288. BUTTER MARKET, BY TEXTURE, 2019-2035 (USD BILLION)
    289. AFRICA PEANUT BUTTER MARKET, BY TEXTURE, 2019-2035 (THOUSAND TONS)
    290. MIDDLE EAST & AFRICA PEANUT BUTTER MARKET, BY CLAIM, 2019-2035 (USD BILLION)
    291. TONS)
    292. (USD BILLION)
    293. 2035 (THOUSAND TONS)
    294. MARKET, BY END-USE, 2019-2035 (USD BILLION)
    295. PEANUT BUTTER MARKET, BY END-USE, 2019-2035 (THOUSAND TONS)
    296. EAST & AFRICA PEANUT BUTTER MARKET, BY DISTRIBUTION CHANNEL, 2019-2035 (USD
    297. BILLION)
    298. CHANNEL, 2019-2035 (THOUSAND TONS)
    299. BY TEXTURE, 2019-2035 (USD BILLION)
    300. BY TEXTURE, 2019-2035 (THOUSAND TONS)
    301. MARKET, BY CLAIM, 2019-2035 (USD BILLION)
    302. MARKET, BY CLAIM, 2019-2035 (THOUSAND TONS)
    303. BUTTER MARKET, BY NATURE, 2019-2035 (USD BILLION)
    304. BUTTER MARKET, BY NATURE, 2019-2035 (THOUSAND TONS)
    305. PEANUT BUTTER MARKET, BY END-USE, 2019-2035 (USD BILLION)
    306. PEANUT BUTTER MARKET, BY END-USE, 2019-2035 (THOUSAND TONS)
    307. PEANUT BUTTER MARKET, BY DISTRIBUTION CHANNEL, 2019-2035 (USD BILLION)
    308. GCC COUNTRIES PEANUT BUTTER MARKET, BY DISTRIBUTION CHANNEL, 2019-2035 (THOUSAND
    309. TONS)
    310. TURKEY PEANUT BUTTER MARKET, BY CLAIM, 2019-2035 (THOUSAND TONS)
    311. TURKEY PEANUT BUTTER MARKET, BY NATURE, 2019-2035 (USD BILLION)
    312. TURKEY PEANUT BUTTER MARKET, BY NATURE, 2019-2035 (THOUSAND TONS)
    313. TURKEY PEANUT BUTTER MARKET, BY END-USE, 2019-2035 (USD BILLION)
    314. TURKEY PEANUT BUTTER MARKET, BY END-USE, 2019-2035 (THOUSAND TONS)
    315. TURKEY PEANUT BUTTER MARKET, BY DISTRIBUTION CHANNEL, 2019-2035 (USD BILLION)
    316. TONS)
    317. (USD BILLION)
    318. (THOUSAND TONS)
    319. (USD BILLION)
    320. (THOUSAND TONS)
    321. 2035 (USD BILLION)
    322. NATURE, 2019-2035 (THOUSAND TONS)
    323. BY END-USE, 2019-2035 (USD BILLION)
    324. MARKET, BY END-USE, 2019-2035 (THOUSAND TONS)
    325. BUTTER MARKET, BY DISTRIBUTION CHANNEL, 2019-2035 (USD BILLION)
    326. AFRICA PEANUT BUTTER MARKET, BY DISTRIBUTION CHANNEL, 2019-2035 (THOUSAND TONS)
    327. TONS)
    328. BILLION)
    329. (THOUSAND TONS)
    330. 2035 (USD BILLION)
    331. NATURE, 2019-2035 (THOUSAND TONS)
    332. BY END-USE, 2019-2035 (USD BILLION)
    333. MARKET, BY END-USE, 2019-2035 (THOUSAND TONS)
    334. BUTTER MARKET, BY DISTRIBUTION CHANNEL, 2019-2035 (USD BILLION)
    335. AFRICA PEANUT BUTTER MARKET, BY DISTRIBUTION CHANNEL, 2019-2035 (THOUSAND TONS)
    336. (USD BILLION)
    337. BY TEXTURE, 2019-2035 (THOUSAND TONS)
    338. PEANUT BUTTER MARKET, BY CLAIM, 2019-2035 (USD BILLION)
    339. EAST & AFRICA PEANUT BUTTER MARKET, BY CLAIM, 2019-2035 (THOUSAND TONS)
    340. REST OF MIDDLE EAST & AFRICA PEANUT BUTTER MARKET, BY NATURE, 2019-2035
    341. (USD BILLION)
    342. BY NATURE, 2019-2035 (THOUSAND TONS)
    343. PEANUT BUTTER MARKET, BY END-USE, 2019-2035 (USD BILLION)
    344. MIDDLE EAST & AFRICA PEANUT BUTTER MARKET, BY END-USE, 2019-2035 (THOUSAND TONS)
    345. CHANNEL, 2019-2035 (USD BILLION)
    346. PEANUT BUTTER MARKET, BY DISTRIBUTION CHANNEL, 2019-2035 (THOUSAND TONS)
    347. MAJOR PLAYERS IN TERMS OF MARKET DISRUPTORS & INNOVATORS
    348. THE MOST ACTIVE PLAYERS IN THE GLOBAL PPF MARKET
    349. DEVELOPMENT
    350. CORPORATION: PRODUCTS/SERVICES OFFERED
    351. KEY DEVELOPMENTS
    352. J.M. SMUCKER COMPANY: KEY DEVELOPMENTS
    353. KEY DEVELOPMENTS
    354. KELLOGG COMPANY: PRODUCTS OFFERED
    355. BRANDS, INC.: PRODUCTS OFFERED
    356. GLOBAL PEANUT BUTTER MARKET SNAPSHOT, 2024
    357. MARKET: STRUCTURE
    358. GLOBAL PEANUT BUTTER MARKET: MARKET DYNAMICS
    359. CHAIN ANALYSIS: GLOBAL PEANUT BUTTER MARKET
    360. MODEL: GLOBAL PEANUT BUTTER MARKET
    361. TEXTURE, 2024 (% SHARE)
    362. (% SHARE)
    363. GLOBAL PEANUT BUTTER MARKET, BY DISTRIBUTION CHANNEL, 2024 (% SHARE)
    364. GLOBAL MARKET: COMPARATIVE ANALYSIS
    365. BY REGION, 2024 (% SHARE)
    366. EUROPE MARKET: COMPARATIVE ANALYSIS
    367. BY COUNTRY, 2024 (% SHARE)
    368. SOUTH AMERICA MARKET: COMPARATIVE ANALYSIS
    369. BUTTER MARKET, BY COUNTRY, 2024 (% SHARE)
    370. MARKET: COMPARATIVE ANALYSIS
    371. MARKET, BY COUNTRY, 2024 (% SHARE)
    372. BUTTER MARKET: MARKET SHARE 2024
    373. HORMEL FOODS CORPORATION: SWOT ANALYSIS
    374. ANALYSIS
    375. FINANCIAL OVERVIEW SNAPSHOT
    376. SWOT ANALYSIS
    377. KELLOGG COMPANY: SWOT ANALYSIS
    378. UNILEVER PLC: FINANCIAL OVERVIEW SNAPSHOT
    379. ASSOCIATED BRITISH FOODS PLC: SWOT ANALYSIS
    380. SWOT ANALYSIS

    Global Outlook (USD Billion,Thousand Tons,2019-2035)

    Global Peanut Butter, By Texture (USD Billion,Thousand Tons,2019-2035)

    • Creamy
    • Crunchy
    • Powdered

    Global Peanut Butter, By Claim (USD Billion,Thousand Tons,2019-2035)

    • Low Sodium
    • No Sugar
    • Reduced Fat

    Global Peanut Butter, By Nature (USD Billion,Thousand Tons,2019-2035)

    • Organic
    • Regular

    Global Peanut Butter, By End-Use (USD Billion,Thousand Tons,2019-2035)

    • Direct Consumption & Culinary Purpose
    • Bakery & Confectionery
    • Dips & Spreads
    • Sweet & Savory Snacks
    • Others

    Global Peanut Butter, By Distribution Channel (USD Billion,Thousand Tons,2019-2035)

    • Supermarkets/Hypermarkets
    • Convenience Stores
    • Specialty Stores
    • Online

    North America Outlook (USD Billion,Thousand Tons,2019-2035)

    North America Peanut Butter, By Texture (USD Billion,Thousand Tons,2019-2035)

    • Creamy
    • Crunchy
    • Powdered

    North America Peanut Butter, By Claim (USD Billion,Thousand Tons,2019-2035)

    • Low Sodium
    • No Sugar
    • Reduced Fat

    North America Peanut Butter, By Nature (USD Billion,Thousand Tons,2019-2035)

    • Organic
    • Regular

    North America Peanut Butter, By End-Use (USD Billion,Thousand Tons,2019-2035)

    • Direct Consumption & Culinary Purpose
    • Bakery & Confectionery
    • Dips & Spreads
    • Sweet & Savory Snacks
    • Others

    North America Peanut Butter, By Distribution Channel (USD Billion,Thousand Tons,2019-2035)

    • Supermarkets/Hypermarkets
    • Convenience Stores
    • Specialty Stores
    • Online

    US Outlook (USD Billion,Thousand Tons,2019-2035)

    US Peanut Butter, By Texture (USD Billion,Thousand Tons,2019-2035)

    • Creamy
    • Crunchy
    • Powdered

    US Peanut Butter, By Claim (USD Billion,Thousand Tons,2019-2035)

    • Low Sodium
    • No Sugar
    • Reduced Fat

    US Peanut Butter, By Nature (USD Billion,Thousand Tons,2019-2035)

    • Organic
    • Regular

    US Peanut Butter, By End-Use (USD Billion,Thousand Tons,2019-2035)

    • Direct Consumption & Culinary Purpose
    • Bakery & Confectionery
    • Dips & Spreads
    • Sweet & Savory Snacks
    • Others

    US Peanut Butter, By Distribution Channel (USD Billion,Thousand Tons,2019-2035)

    • Supermarkets/Hypermarkets
    • Convenience Stores
    • Specialty Stores
    • Online

    Canada Outlook (USD Billion,Thousand Tons,2019-2035)

    Canada Peanut Butter, By Texture (USD Billion,Thousand Tons,2019-2035)

    • Creamy
    • Crunchy
    • Powdered

    Canada Peanut Butter, By Claim (USD Billion,Thousand Tons,2019-2035)

    • Low Sodium
    • No Sugar
    • Reduced Fat

    Canada Peanut Butter, By Nature (USD Billion,Thousand Tons,2019-2035)

    • Organic
    • Regular

    Canada Peanut Butter, By End-Use (USD Billion,Thousand Tons,2019-2035)

    • Direct Consumption & Culinary Purpose
    • Bakery & Confectionery
    • Dips & Spreads
    • Sweet & Savory Snacks
    • Others

    Canada Peanut Butter, By Distribution Channel (USD Billion,Thousand Tons,2019-2035)

    • Supermarkets/Hypermarkets
    • Convenience Stores
    • Specialty Stores
    • Online

    Mexico Outlook (USD Billion,Thousand Tons,2019-2035)

    Mexico Peanut Butter, By Texture (USD Billion,Thousand Tons,2019-2035)

    • Creamy
    • Crunchy
    • Powdered

    Mexico Peanut Butter, By Claim (USD Billion,Thousand Tons,2019-2035)

    • Low Sodium
    • No Sugar
    • Reduced Fat

    Mexico Peanut Butter, By Nature (USD Billion,Thousand Tons,2019-2035)

    • Organic
    • Regular

    Mexico Peanut Butter, By End-Use (USD Billion,Thousand Tons,2019-2035)

    • Direct Consumption & Culinary Purpose
    • Bakery & Confectionery
    • Dips & Spreads
    • Sweet & Savory Snacks
    • Others

    Mexico Peanut Butter, By Distribution Channel (USD Billion,Thousand Tons,2019-2035)

    • Supermarkets/Hypermarkets
    • Convenience Stores
    • Specialty Stores
    • Online

    Europe Outlook (USD Billion,Thousand Tons,2019-2035)

    Europe Peanut Butter, By Texture (USD Billion,Thousand Tons,2019-2035)

    • Creamy
    • Crunchy
    • Powdered

    Europe Peanut Butter, By Claim (USD Billion,Thousand Tons,2019-2035)

    • Low Sodium
    • No Sugar
    • Reduced Fat

    Europe Peanut Butter, By Nature (USD Billion,Thousand Tons,2019-2035)

    • Organic
    • Regular

    Europe Peanut Butter, By End-Use (USD Billion,Thousand Tons,2019-2035)

    • Direct Consumption & Culinary Purpose
    • Bakery & Confectionery
    • Dips & Spreads
    • Sweet & Savory Snacks
    • Others

    Europe Peanut Butter, By Distribution Channel (USD Billion,Thousand Tons,2019-2035)

    • Supermarkets/Hypermarkets
    • Convenience Stores
    • Specialty Stores
    • Online

    Germany Outlook (USD Billion,Thousand Tons,2019-2035)

    Germany Peanut Butter, By Texture (USD Billion,Thousand Tons,2019-2035)

    • Creamy
    • Crunchy
    • Powdered

    Germany Peanut Butter, By Claim (USD Billion,Thousand Tons,2019-2035)

    • Low Sodium
    • No Sugar
    • Reduced Fat

    Germany Peanut Butter, By Nature (USD Billion,Thousand Tons,2019-2035)

    • Organic
    • Regular

    Germany Peanut Butter, By End-Use (USD Billion,Thousand Tons,2019-2035)

    • Direct Consumption & Culinary Purpose
    • Bakery & Confectionery
    • Dips & Spreads
    • Sweet & Savory Snacks
    • Others

    Germany Peanut Butter, By Distribution Channel (USD Billion,Thousand Tons,2019-2035)

    • Supermarkets/Hypermarkets
    • Convenience Stores
    • Specialty Stores
    • Online

    UK Outlook (USD Billion,Thousand Tons,2019-2035)

    UK Peanut Butter, By Texture (USD Billion,Thousand Tons,2019-2035)

    • Creamy
    • Crunchy
    • Powdered

    UK Peanut Butter, By Claim (USD Billion,Thousand Tons,2019-2035)

    • Low Sodium
    • No Sugar
    • Reduced Fat

    UK Peanut Butter, By Nature (USD Billion,Thousand Tons,2019-2035)

    • Organic
    • Regular

    UK Peanut Butter, By End-Use (USD Billion,Thousand Tons,2019-2035)

    • Direct Consumption & Culinary Purpose
    • Bakery & Confectionery
    • Dips & Spreads
    • Sweet & Savory Snacks
    • Others

    UK Peanut Butter, By Distribution Channel (USD Billion,Thousand Tons,2019-2035)

    • Supermarkets/Hypermarkets
    • Convenience Stores
    • Specialty Stores
    • Online

    France Outlook (USD Billion,Thousand Tons,2019-2035)

    France Peanut Butter, By Texture (USD Billion,Thousand Tons,2019-2035)

    • Creamy
    • Crunchy
    • Powdered

    France Peanut Butter, By Claim (USD Billion,Thousand Tons,2019-2035)

    • Low Sodium
    • No Sugar
    • Reduced Fat

    France Peanut Butter, By Nature (USD Billion,Thousand Tons,2019-2035)

    • Organic
    • Regular

    France Peanut Butter, By End-Use (USD Billion,Thousand Tons,2019-2035)

    • Direct Consumption & Culinary Purpose
    • Bakery & Confectionery
    • Dips & Spreads
    • Sweet & Savory Snacks
    • Others

    France Peanut Butter, By Distribution Channel (USD Billion,Thousand Tons,2019-2035)

    • Supermarkets/Hypermarkets
    • Convenience Stores
    • Specialty Stores
    • Online

    Spain Outlook (USD Billion,Thousand Tons,2019-2035)

    Spain Peanut Butter, By Texture (USD Billion,Thousand Tons,2019-2035)

    • Creamy
    • Crunchy
    • Powdered

    Spain Peanut Butter, By Claim (USD Billion,Thousand Tons,2019-2035)

    • Low Sodium
    • No Sugar
    • Reduced Fat

    Spain Peanut Butter, By Nature (USD Billion,Thousand Tons,2019-2035)

    • Organic
    • Regular

    Spain Peanut Butter, By End-Use (USD Billion,Thousand Tons,2019-2035)

    • Direct Consumption & Culinary Purpose
    • Bakery & Confectionery
    • Dips & Spreads
    • Sweet & Savory Snacks
    • Others

    Spain Peanut Butter, By Distribution Channel (USD Billion,Thousand Tons,2019-2035)

    • Supermarkets/Hypermarkets
    • Convenience Stores
    • Specialty Stores
    • Online

    Italy Outlook (USD Billion,Thousand Tons,2019-2035)

    Italy Peanut Butter, By Texture (USD Billion,Thousand Tons,2019-2035)

    • Creamy
    • Crunchy
    • Powdered

    Italy Peanut Butter, By Claim (USD Billion,Thousand Tons,2019-2035)

    • Low Sodium
    • No Sugar
    • Reduced Fat

    Italy Peanut Butter, By Nature (USD Billion,Thousand Tons,2019-2035)

    • Organic
    • Regular

    Italy Peanut Butter, By End-Use (USD Billion,Thousand Tons,2019-2035)

    • Direct Consumption & Culinary Purpose
    • Bakery & Confectionery
    • Dips & Spreads
    • Sweet & Savory Snacks
    • Others

    Italy Peanut Butter, By Distribution Channel (USD Billion,Thousand Tons,2019-2035)

    • Supermarkets/Hypermarkets
    • Convenience Stores
    • Specialty Stores
    • Online

    Rest of Europe Outlook (USD Billion,Thousand Tons,2019-2035)

    Rest of Europe Peanut Butter, By Texture (USD Billion,Thousand Tons,2019-2035)

    • Creamy
    • Crunchy
    • Powdered

    Rest of Europe Peanut Butter, By Claim (USD Billion,Thousand Tons,2019-2035)

    • Low Sodium
    • No Sugar
    • Reduced Fat

    Rest of Europe Peanut Butter, By Nature (USD Billion,Thousand Tons,2019-2035)

    • Organic
    • Regular

    Rest of Europe Peanut Butter, By End-Use (USD Billion,Thousand Tons,2019-2035)

    • Direct Consumption & Culinary Purpose
    • Bakery & Confectionery
    • Dips & Spreads
    • Sweet & Savory Snacks
    • Others

    Rest of Europe Peanut Butter, By Distribution Channel (USD Billion,Thousand Tons,2019-2035)

    • Supermarkets/Hypermarkets
    • Convenience Stores
    • Specialty Stores
    • Online

    Asia-Pacific Outlook (USD Billion,Thousand Tons,2019-2035)

    Asia-Pacific Peanut Butter, By Texture (USD Billion,Thousand Tons,2019-2035)

    • Creamy
    • Crunchy
    • Powdered

    Asia-Pacific Peanut Butter, By Claim (USD Billion,Thousand Tons,2019-2035)

    • Low Sodium
    • No Sugar
    • Reduced Fat

    Asia-Pacific Peanut Butter, By Nature (USD Billion,Thousand Tons,2019-2035)

    • Organic
    • Regular

    Asia-Pacific Peanut Butter, By End-Use (USD Billion,Thousand Tons,2019-2035)

    • Direct Consumption & Culinary Purpose
    • Bakery & Confectionery
    • Dips & Spreads
    • Sweet & Savory Snacks
    • Others

    Asia-Pacific Peanut Butter, By Distribution Channel (USD Billion,Thousand Tons,2019-2035)

    • Supermarkets/Hypermarkets
    • Convenience Stores
    • Specialty Stores
    • Online

    China Outlook (USD Billion,Thousand Tons,2019-2035)

    China Peanut Butter, By Texture (USD Billion,Thousand Tons,2019-2035)

    • Creamy
    • Crunchy
    • Powdered

    China Peanut Butter, By Claim (USD Billion,Thousand Tons,2019-2035)

    • Low Sodium
    • No Sugar
    • Reduced Fat

    China Peanut Butter, By Nature (USD Billion,Thousand Tons,2019-2035)

    • Organic
    • Regular

    China Peanut Butter, By End-Use (USD Billion,Thousand Tons,2019-2035)

    • Direct Consumption & Culinary Purpose
    • Bakery & Confectionery
    • Dips & Spreads
    • Sweet & Savory Snacks
    • Others

    China Peanut Butter, By Distribution Channel (USD Billion,Thousand Tons,2019-2035)

    • Supermarkets/Hypermarkets
    • Convenience Stores
    • Specialty Stores
    • Online

    India Outlook (USD Billion,Thousand Tons,2019-2035)

    India Peanut Butter, By Texture (USD Billion,Thousand Tons,2019-2035)

    • Creamy
    • Crunchy
    • Powdered

    India Peanut Butter, By Claim (USD Billion,Thousand Tons,2019-2035)

    • Low Sodium
    • No Sugar
    • Reduced Fat

    India Peanut Butter, By Nature (USD Billion,Thousand Tons,2019-2035)

    • Organic
    • Regular

    India Peanut Butter, By End-Use (USD Billion,Thousand Tons,2019-2035)

    • Direct Consumption & Culinary Purpose
    • Bakery & Confectionery
    • Dips & Spreads
    • Sweet & Savory Snacks
    • Others

    India Peanut Butter, By Distribution Channel (USD Billion,Thousand Tons,2019-2035)

    • Supermarkets/Hypermarkets
    • Convenience Stores
    • Specialty Stores
    • Online

    Japan Outlook (USD Billion,Thousand Tons,2019-2035)

    Japan Peanut Butter, By Texture (USD Billion,Thousand Tons,2019-2035)

    • Creamy
    • Crunchy
    • Powdered

    Japan Peanut Butter, By Claim (USD Billion,Thousand Tons,2019-2035)

    • Low Sodium
    • No Sugar
    • Reduced Fat

    Japan Peanut Butter, By Nature (USD Billion,Thousand Tons,2019-2035)

    • Organic
    • Regular

    Japan Peanut Butter, By End-Use (USD Billion,Thousand Tons,2019-2035)

    • Direct Consumption & Culinary Purpose
    • Bakery & Confectionery
    • Dips & Spreads
    • Sweet & Savory Snacks
    • Others

    Japan Peanut Butter, By Distribution Channel (USD Billion,Thousand Tons,2019-2035)

    • Supermarkets/Hypermarkets
    • Convenience Stores
    • Specialty Stores
    • Online

    South Korea Outlook (USD Billion,Thousand Tons,2019-2035)

    South Korea Peanut Butter, By Texture (USD Billion,Thousand Tons,2019-2035)

    • Creamy
    • Crunchy
    • Powdered

    South Korea Peanut Butter, By Claim (USD Billion,Thousand Tons,2019-2035)

    • Low Sodium
    • No Sugar
    • Reduced Fat

    South Korea Peanut Butter, By Nature (USD Billion,Thousand Tons,2019-2035)

    • Organic
    • Regular

    South Korea Peanut Butter, By End-Use (USD Billion,Thousand Tons,2019-2035)

    • Direct Consumption & Culinary Purpose
    • Bakery & Confectionery
    • Dips & Spreads
    • Sweet & Savory Snacks
    • Others

    South Korea Peanut Butter, By Distribution Channel (USD Billion,Thousand Tons,2019-2035)

    • Supermarkets/Hypermarkets
    • Convenience Stores
    • Specialty Stores
    • Online

    Australia & New Zealand Outlook (USD Billion,Thousand Tons,2019-2035)

    Australia & New Zealand Peanut Butter, By Texture (USD Billion,Thousand Tons,2019-2035)

    • Creamy
    • Crunchy
    • Powdered

    Australia & New Zealand Peanut Butter, By Claim (USD Billion,Thousand Tons,2019-2035)

    • Low Sodium
    • No Sugar
    • Reduced Fat

    Australia & New Zealand Peanut Butter, By Nature (USD Billion,Thousand Tons,2019-2035)

    • Organic
    • Regular

    Australia & New Zealand Peanut Butter, By End-Use (USD Billion,Thousand Tons,2019-2035)

    • Direct Consumption & Culinary Purpose
    • Bakery & Confectionery
    • Dips & Spreads
    • Sweet & Savory Snacks
    • Others

    Australia & New Zealand Peanut Butter, By Distribution Channel (USD Billion,Thousand Tons,2019-2035)

    • Supermarkets/Hypermarkets
    • Convenience Stores
    • Specialty Stores
    • Online

    Rest of Asia-Pacific Outlook (USD Billion,Thousand Tons,2019-2035)

    Rest of Asia-Pacific Peanut Butter, By Texture (USD Billion,Thousand Tons,2019-2035)

    • Creamy
    • Crunchy
    • Powdered

    Rest of Asia-Pacific Peanut Butter, By Claim (USD Billion,Thousand Tons,2019-2035)

    • Low Sodium
    • No Sugar
    • Reduced Fat

    Rest of Asia-Pacific Peanut Butter, By Nature (USD Billion,Thousand Tons,2019-2035)

    • Organic
    • Regular

    Rest of Asia-Pacific Peanut Butter, By End-Use (USD Billion,Thousand Tons,2019-2035)

    • Direct Consumption & Culinary Purpose
    • Bakery & Confectionery
    • Dips & Spreads
    • Sweet & Savory Snacks
    • Others

    Rest of Asia-Pacific Peanut Butter, By Distribution Channel (USD Billion,Thousand Tons,2019-2035)

    • Supermarkets/Hypermarkets
    • Convenience Stores
    • Specialty Stores
    • Online

    South America Outlook (USD Billion,Thousand Tons,2019-2035)

    South America Peanut Butter, By Texture (USD Billion,Thousand Tons,2019-2035)

    • Creamy
    • Crunchy
    • Powdered

    South America Peanut Butter, By Claim (USD Billion,Thousand Tons,2019-2035)

    • Low Sodium
    • No Sugar
    • Reduced Fat

    South America Peanut Butter, By Nature (USD Billion,Thousand Tons,2019-2035)

    • Organic
    • Regular

    South America Peanut Butter, By End-Use (USD Billion,Thousand Tons,2019-2035)

    • Direct Consumption & Culinary Purpose
    • Bakery & Confectionery
    • Dips & Spreads
    • Sweet & Savory Snacks
    • Others

    South America Peanut Butter, By Distribution Channel (USD Billion,Thousand Tons,2019-2035)

    • Supermarkets/Hypermarkets
    • Convenience Stores
    • Specialty Stores
    • Online

    Brazil Outlook (USD Billion,Thousand Tons,2019-2035)

    Brazil Peanut Butter, By Texture (USD Billion,Thousand Tons,2019-2035)

    • Creamy
    • Crunchy
    • Powdered

    Brazil Peanut Butter, By Claim (USD Billion,Thousand Tons,2019-2035)

    • Low Sodium
    • No Sugar
    • Reduced Fat

    Brazil Peanut Butter, By Nature (USD Billion,Thousand Tons,2019-2035)

    • Organic
    • Regular

    Brazil Peanut Butter, By End-Use (USD Billion,Thousand Tons,2019-2035)

    • Direct Consumption & Culinary Purpose
    • Bakery & Confectionery
    • Dips & Spreads
    • Sweet & Savory Snacks
    • Others

    Brazil Peanut Butter, By Distribution Channel (USD Billion,Thousand Tons,2019-2035)

    • Supermarkets/Hypermarkets
    • Convenience Stores
    • Specialty Stores
    • Online

    Argentina Outlook (USD Billion,Thousand Tons,2019-2035)

    Argentina Peanut Butter, By Texture (USD Billion,Thousand Tons,2019-2035)

    • Creamy
    • Crunchy
    • Powdered

    Argentina Peanut Butter, By Claim (USD Billion,Thousand Tons,2019-2035)

    • Low Sodium
    • No Sugar
    • Reduced Fat

    Argentina Peanut Butter, By Nature (USD Billion,Thousand Tons,2019-2035)

    • Organic
    • Regular

    Argentina Peanut Butter, By End-Use (USD Billion,Thousand Tons,2019-2035)

    • Direct Consumption & Culinary Purpose
    • Bakery & Confectionery
    • Dips & Spreads
    • Sweet & Savory Snacks
    • Others

    Argentina Peanut Butter, By Distribution Channel (USD Billion,Thousand Tons,2019-2035)

    • Supermarkets/Hypermarkets
    • Convenience Stores
    • Specialty Stores
    • Online

    Rest of South America Outlook (USD Billion,Thousand Tons,2019-2035)

    Rest of South America Peanut Butter, By Texture (USD Billion,Thousand Tons,2019-2035)

    • Creamy
    • Crunchy
    • Powdered

    Rest of South America Peanut Butter, By Claim (USD Billion,Thousand Tons,2019-2035)

    • Low Sodium
    • No Sugar
    • Reduced Fat

    Rest of South America Peanut Butter, By Nature (USD Billion,Thousand Tons,2019-2035)

    • Organic
    • Regular

    Rest of South America Peanut Butter, By End-Use (USD Billion,Thousand Tons,2019-2035)

    • Direct Consumption & Culinary Purpose
    • Bakery & Confectionery
    • Dips & Spreads
    • Sweet & Savory Snacks
    • Others

    Rest of South America Peanut Butter, By Distribution Channel (USD Billion,Thousand Tons,2019-2035)

    • Supermarkets/Hypermarkets
    • Convenience Stores
    • Specialty Stores
    • Online

    Middle East & Africa Outlook (USD Billion,Thousand Tons,2019-2035)

    Middle East & Africa Peanut Butter, By Texture (USD Billion,Thousand Tons,2019-2035)

    • Creamy
    • Crunchy
    • Powdered

    Middle East & Africa Peanut Butter, By Claim (USD Billion,Thousand Tons,2019-2035)

    • Low Sodium
    • No Sugar
    • Reduced Fat

    Middle East & Africa Peanut Butter, By Nature (USD Billion,Thousand Tons,2019-2035)

    • Organic
    • Regular

    Middle East & Africa Peanut Butter, By End-Use (USD Billion,Thousand Tons,2019-2035)

    • Direct Consumption & Culinary Purpose
    • Bakery & Confectionery
    • Dips & Spreads
    • Sweet & Savory Snacks
    • Others

    Middle East & Africa Peanut Butter, By Distribution Channel (USD Billion,Thousand Tons,2019-2035)

    • Supermarkets/Hypermarkets
    • Convenience Stores
    • Specialty Stores
    • Online

    GCC Countries Outlook (USD Billion,Thousand Tons,2019-2035)

    GCC Countries Peanut Butter, By Texture (USD Billion,Thousand Tons,2019-2035)

    • Creamy
    • Crunchy
    • Powdered

    GCC Countries Peanut Butter, By Claim (USD Billion,Thousand Tons,2019-2035)

    • Low Sodium
    • No Sugar
    • Reduced Fat

    GCC Countries Peanut Butter, By Nature (USD Billion,Thousand Tons,2019-2035)

    • Organic
    • Regular

    GCC Countries Peanut Butter, By End-Use (USD Billion,Thousand Tons,2019-2035)

    • Direct Consumption & Culinary Purpose
    • Bakery & Confectionery
    • Dips & Spreads
    • Sweet & Savory Snacks
    • Others

    GCC Countries Peanut Butter, By Distribution Channel (USD Billion,Thousand Tons,2019-2035)

    • Supermarkets/Hypermarkets
    • Convenience Stores
    • Specialty Stores
    • Online

    Turkey Outlook (USD Billion,Thousand Tons,2019-2035)

    Turkey Peanut Butter, By Texture (USD Billion,Thousand Tons,2019-2035)

    • Creamy
    • Crunchy
    • Powdered

    Turkey Peanut Butter, By Claim (USD Billion,Thousand Tons,2019-2035)

    • Low Sodium
    • No Sugar
    • Reduced Fat

    Turkey Peanut Butter, By Nature (USD Billion,Thousand Tons,2019-2035)

    • Organic
    • Regular

    Turkey Peanut Butter, By End-Use (USD Billion,Thousand Tons,2019-2035)

    • Direct Consumption & Culinary Purpose
    • Bakery & Confectionery
    • Dips & Spreads
    • Sweet & Savory Snacks
    • Others

    Turkey Peanut Butter, By Distribution Channel (USD Billion,Thousand Tons,2019-2035)

    • Supermarkets/Hypermarkets
    • Convenience Stores
    • Specialty Stores
    • Online

    Northern Africa Outlook (USD Billion,Thousand Tons,2019-2035)

    Northern Africa Peanut Butter, By Texture (USD Billion,Thousand Tons,2019-2035)

    • Creamy
    • Crunchy
    • Powdered

    Northern Africa Peanut Butter, By Claim (USD Billion,Thousand Tons,2019-2035)

    • Low Sodium
    • No Sugar
    • Reduced Fat

    Northern Africa Peanut Butter, By Nature (USD Billion,Thousand Tons,2019-2035)

    • Organic
    • Regular

    Northern Africa Peanut Butter, By End-Use (USD Billion,Thousand Tons,2019-2035)

    • Direct Consumption & Culinary Purpose
    • Bakery & Confectionery
    • Dips & Spreads
    • Sweet & Savory Snacks
    • Others

    Northern Africa Peanut Butter, By Distribution Channel (USD Billion,Thousand Tons,2019-2035)

    • Supermarkets/Hypermarkets
    • Convenience Stores
    • Specialty Stores
    • Online

    Southern Africa Outlook (USD Billion,Thousand Tons,2019-2035)

    Southern Africa Peanut Butter, By Texture (USD Billion,Thousand Tons,2019-2035)

    • Creamy
    • Crunchy
    • Powdered

    Southern Africa Peanut Butter, By Claim (USD Billion,Thousand Tons,2019-2035)

    • Low Sodium
    • No Sugar
    • Reduced Fat

    Southern Africa Peanut Butter, By Nature (USD Billion,Thousand Tons,2019-2035)

    • Organic
    • Regular

    Southern Africa Peanut Butter, By End-Use (USD Billion,Thousand Tons,2019-2035)

    • Direct Consumption & Culinary Purpose
    • Bakery & Confectionery
    • Dips & Spreads
    • Sweet & Savory Snacks
    • Others

    Southern Africa Peanut Butter, By Distribution Channel (USD Billion,Thousand Tons,2019-2035)

    • Supermarkets/Hypermarkets
    • Convenience Stores
    • Specialty Stores
    • Online

    Rest of Middle East & Africa Outlook (USD Billion,Thousand Tons,2019-2035)

    Rest of Middle East & Africa Peanut Butter, By Texture (USD Billion,Thousand Tons,2019-2035)

    • Creamy
    • Crunchy
    • Powdered

    Rest of Middle East & Africa Peanut Butter, By Claim (USD Billion,Thousand Tons,2019-2035)

    • Low Sodium
    • No Sugar
    • Reduced Fat

    Rest of Middle East & Africa Peanut Butter, By Nature (USD Billion,Thousand Tons,2019-2035)

    • Organic
    • Regular

    Rest of Middle East & Africa Peanut Butter, By End-Use (USD Billion,Thousand Tons,2019-2035)

    • Direct Consumption & Culinary Purpose
    • Bakery & Confectionery
    • Dips & Spreads
    • Sweet & Savory Snacks
    • Others

    Rest of Middle East & Africa Peanut Butter, By Distribution Channel (USD Billion,Thousand Tons,2019-2035)

    • Supermarkets/Hypermarkets
    • Convenience Stores
    • Specialty Stores
    • Online
    Report Infographic
    Free Sample Request

    Kindly complete the form below to receive a free sample of this Report

    Customer Strories

    “I am very pleased with how market segments have been defined in a relevant way for my purposes (such as "Portable Freezers & refrigerators" and "last-mile"). In general the report is well structured. Thanks very much for your efforts.”

    Victoria Milne Founder
    Case Study

    Chemicals and Materials