• Cat-intel
  • MedIntelliX
  • Resources
  • About Us
  • English
    Chinese
    French
    Japanese
    Korean
    German
    Spanish

    Phosphoric Acid Market Analysis

    ID: MRFR/CnM/10544-CR
    111 Pages
    Chitranshi Jaiswal
    July 2025

    Phosphoric Acid Market Research Report: By Source (Wet Process, Thermal Process), By Application (Fertilizers, Feed & Food Additives, Detergents, Water Treatment Chemicals, Others) and By Regional (North America, Europe, South America, Asia Pacific, Middle East and Africa) - Forecast to 2035.

    Share:
    Download PDF ×

    We do not share your information with anyone. However, we may send you emails based on your report interest from time to time. You may contact us at any time to opt-out.

    Phosphoric Acid Market Research Report – Forecast Till 2035 Infographic
    $ 4,950.0
    $ 5,950.0
    $ 7,250.0

    Market Analysis

    In-depth Analysis of Phosphoric Acid Market Industry Landscape

    The phosphoric acid market is currently witnessing significant transformations in its dynamics due to several factors affecting both supply and demand within the chemistry and agriculture sectors. A major consumer of this vital chemical compound, which is widely used in various applications, is the agricultural sector. One of the major drivers of market dynamics is the increasing demand for fertilizers, and phosphoric acid is a critical component used in its production. The agricultural sector heavily influences the market dynamics of the phosphoric acid industry. Phosphoric acid is an essential ingredient in manufacturing phosphate fertilizers, which help promote plant growth by making crops more productive. That is why it has been suggested that phosphoric acid can serve as a solution to nutrient deficiencies within soils, which is witnessed within this particular industry. Additionally, the market dynamics are influenced by the industrial sector and its varied applications. Detergent production, water treatment chemicals, and food & beverages all require phosphoric acid. The versatility of phosphoric acid in addressing the diverse needs of numerous manufacturing and processing industries has effects on market dynamics. Technological advancements in phosphoric acid production have led to changes in market dynamics. Through these processes, continuous innovation, such as those involving improved extraction methods or environmentally friendly ways of producing it, can be applied to ensure that less land boundary modification occurs from farming practices geared towards enhancing phosphatic rock processing efficiency. Environmental concerns and sustainable practices are important drivers of market dynamics. The chemical industry is increasingly feeling the weight of more sustainable practices, and those phosphoric acid producers who embrace environmentally responsible sourcing, production processes, and waste disposal play a role in market dynamics by following the broader trend of sustainable chemical solutions. Global economic conditions and agricultural trends influence market dynamics in the Phosphoric Acid sector. Manufacturing capabilities, quality assurance, supply stability, and retention contribute greatly to market dynamics on the supply side. Regulatory standards and compliance feature significantly in the phosphoric acid industry as they affect its market dynamics. Governments and regulatory bodies establish guidelines for the use and production of chemicals to ensure safety, environmental protection, and conformity to quality standards.

    Market Summary

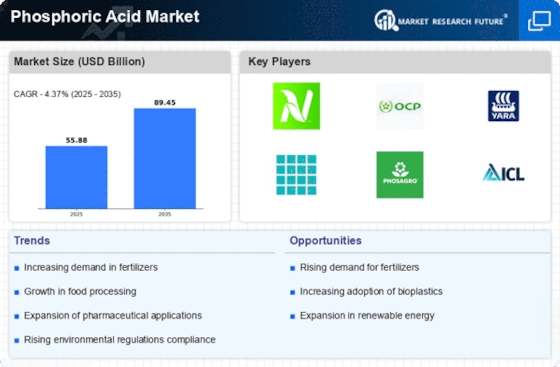
    As per Market Research Future Analysis, the Global Phosphoric Acid Market was valued at 54.42 USD Billion in 2023 and is projected to grow to 89.45 USD Billion by 2035, driven by increasing demand for fertilizers and sustainable agricultural practices. The market is expected to witness a CAGR of 4.37% from 2025 to 2035, with significant contributions from both the Wet and Thermal Process methodologies.

    Key Market Trends & Highlights

    The Phosphoric Acid Market is experiencing transformative trends driven by agricultural demands and technological advancements.

    • Market Size in 2024: 55.88 USD Billion; expected to reach 89.45 USD Billion by 2035.
    • Fertilizer applications account for over 80% of phosphoric acid consumption worldwide.
    • Wet Process is projected to grow from 31.08 USD Billion in 2024 to 50.59 USD Billion by 2035.
    • North America leads the market with a valuation of 15.5 USD Billion in 2024, expected to grow to 24.0 USD Billion by 2035.

    Market Size & Forecast

    2023 Market Size USD 54.42 Billion
    2024 Market Size USD 55.88 Billion
    2035 Market Size USD 89.45 Billion
    CAGR (2025-2035) 4.37%
    Largest Regional Market Share in 2024 North America.

    Major Players

    Key Companies include PhosAgro, Innophos, Fosfatos del Brasil, Nutrien, The Mosaic Company, BASF, J.R. Simplot Company, ICL Group.

    Market Trends

    The Phosphoric Acid Market is undergoing substantial changes as a result of the growing demand for agricultural fertilizers. The primary reason for this increase is the increasing demand for sustainable agricultural practices and high-yield crops. The agriculture sector is receiving increased support from governments worldwide, which has a positive impact on the consumption of phosphoric acid. Governments are prioritizing food security. The increase in the population is a significant market driver, as it requires the enhancement of agricultural productivity.

    This has the potential to expand the phosphoric acid supply chain. In emerging economies, there is a significant market for phosphoric acid due to the increasing number of agricultural activities and industrial applications. This presents opportunities for development.The demand for phosphoric acid is expected to increase in tandem with the expansion of industries such as pharmaceuticals and food processing. Additionally, the potential for value-added phosphoric acid derivatives and the transition to greener production methods offer new opportunities for market participants.

    In general, the landscape for phosphoric acid is transitioning toward sustainability and innovation as stakeholders strive to address the changing requirements of agriculture and industry.


    The ongoing demand for phosphoric acid in agriculture and food processing sectors appears to be driving a robust growth trajectory, reflecting its essential role in enhancing crop yields and food quality.

    U.S. Geological Survey (USGS)

    Phosphoric Acid Market Market Drivers

    Market Trends and Projections

    The Global Phosphoric Acid Market Industry is characterized by dynamic trends and projections that indicate a promising future. The market is expected to grow from 55.9 USD Billion in 2024 to 89.5 USD Billion by 2035, reflecting a robust demand trajectory. This growth is underpinned by various factors, including the rising agricultural needs, expanding industrial applications, and technological advancements. The anticipated CAGR of 4.37% from 2025 to 2035 suggests a sustained interest in phosphoric acid across multiple sectors, highlighting its versatility and essential role in modern applications.

    Growth in Food and Beverage Sector

    The Global Phosphoric Acid Market Industry benefits from the expanding food and beverage sector, where phosphoric acid is utilized as an acidulant and flavor enhancer. The increasing consumer preference for processed foods and beverages, particularly carbonated soft drinks, propels the demand for phosphoric acid. As the global population grows, the food and beverage industry is projected to expand significantly, contributing to the market's anticipated growth. By 2035, the market is expected to reach 89.5 USD Billion, indicating a strong correlation between the food sector's growth and phosphoric acid consumption.

    Rising Demand in Fertilizer Production

    The Global Phosphoric Acid Market Industry experiences a robust demand surge due to its critical role in fertilizer production. Phosphoric acid serves as a key ingredient in the manufacturing of phosphate fertilizers, which are essential for enhancing crop yields. With the global population projected to reach approximately 9.7 billion by 2050, the need for efficient agricultural practices intensifies. This trend is reflected in the market's valuation, expected to reach 55.9 USD Billion in 2024, driven by the agricultural sector's increasing reliance on phosphoric acid to meet food production demands.

    Technological Advancements in Production

    Technological advancements in the production of phosphoric acid are transforming the Global Phosphoric Acid Market Industry. Innovations in extraction and purification processes enhance efficiency and reduce environmental impact. For instance, the adoption of cleaner production technologies not only lowers operational costs but also aligns with global sustainability goals. This shift is likely to attract investments, further stimulating market growth. As the industry evolves, the projected compound annual growth rate (CAGR) of 4.37% from 2025 to 2035 suggests that these advancements will play a pivotal role in shaping the future landscape of phosphoric acid production.

    Increasing Use in Industrial Applications

    The Global Phosphoric Acid Market Industry is witnessing a notable increase in the use of phosphoric acid across various industrial applications. Industries such as metal treatment, ceramics, and electronics utilize phosphoric acid for its properties as a rust inhibitor and pH adjuster. The diversification of applications is likely to drive demand, as industries seek to enhance product quality and performance. This trend indicates a broader acceptance of phosphoric acid beyond traditional uses, contributing to the market's growth trajectory. The anticipated market value of 55.9 USD Billion in 2024 underscores the importance of industrial applications in driving demand.

    Environmental Regulations and Sustainability Initiatives

    The Global Phosphoric Acid Market Industry is influenced by increasing environmental regulations and sustainability initiatives. Governments worldwide are implementing stricter regulations on chemical production and usage, prompting manufacturers to adopt greener practices. This shift towards sustainability not only addresses environmental concerns but also enhances the market's appeal to eco-conscious consumers. As companies invest in sustainable production methods, the market is poised for growth, aligning with global efforts to reduce carbon footprints. The projected CAGR of 4.37% from 2025 to 2035 reflects the potential for sustainable practices to drive market expansion.

    Market Segment Insights

    Phosphoric Acid Market Source Insights

    The Phosphoric Acid Market is experiencing notable growth across its Source segment, encompassing various methods of production. In 2024, the overall market is projected to be valued at 55.88 USD billion, with significant contributions from both the Wet Process and Thermal Process methodologies. The Wet Process holds a majority share, valued at 31.08 USD Billion in 2024, and is anticipated to grow substantially to 50.59 USD Billion by 2035.

    This method is favored due to its efficiency and relatively lower energy requirements, making it pivotal in the production landscape.Conversely, the Thermal Process, valued at 24.80 USD Billion in 2024, is expected to reach 38.74 USD Billion in 2035, showcasing a significant growth trajectory. Although it currently holds a smaller market share compared to the Wet Process, the Thermal Process is regarded as essential for producing higher purity phosphoric acid, which is crucial for certain applications in the phosphate fertilizer industry and other chemical sectors.

    The segmentation of the Phosphoric Acid Market highlights the distinct advantages of each method, with Wet Process dominating due to its cost-effectiveness and established industrial practices.Market trends indicate an increasing demand for phosphoric acid as a key ingredient in fertilizers, food additives, and pharmaceuticals, driven by the growing agricultural sector and a surge in population. However, the industry faces challenges such as environmental concerns tied to the production processes and fluctuations in raw material prices, which could impact profitability and sustainability.

    Nonetheless, opportunities abound as technological advancements in production methods and the rising emphasis on sustainable practices present avenues for market participants to innovate and enhance yield efficiency.Overall, the Source segment's performance is integral to the overall dynamics of the Phosphoric Acid Market and its future growth trajectory.

    Source: Primary Research, Secondary Research, Market Research Future Database, and Analyst Review

    Phosphoric Acid Market Application Insights

    The Phosphoric Acid Market is projected to reach a value of 55.88 USD billion by 2024, driven by diverse applications across various sectors. Within the application segment, Fertilizers play a critical role, as phosphoric acid is essential for enhancing crop productivity and addressing food security challenges ly. This makes it a significant contributor to the agricultural sector, particularly in developing regions striving for self-sufficiency.

    Additionally, Feed and Food Additives utilize phosphoric acid to improve animal nutrition and preserve food quality, which reflects its growing importance in the agro-food industry.Detergents also rely on phosphoric acid for their cleaning properties, making it a vital component in household and industrial cleaning products. Water Treatment Chemicals leverage this compound to enhance water quality, highlighting its relevance in environmental management and public health. Other applications contribute to various industrial processes, ensuring the versatile nature of phosphoric acid in the market.

    As the industry evolves, trends such as increasing agricultural demands, environmental regulations, and a focus on sustainability will shape the future landscape of the Phosphoric Acid Market.

    Get more detailed insights about Phosphoric Acid Market Research Report – Forecast Till 2035

    Regional Insights

    The Regional aspect of the Phosphoric Acid Market showcases significant valuation across multiple areas, with North America leading with a value of 15.5 USD Billion in 2024, projected to grow to 24.0 USD billion by 2035, highlighting its majority holding in the industry. Europe follows closely, valued at 13.0 USD billion in 2024, expected to reach 20.0 USD billion by 2035, driven by strong agricultural performance and increasing fertilizer demand.

    In South America, the market is valued at 5.5 USD Billion in 2024, with growth to 9.0 USD billion anticipated by 2035, indicating a developing market with potential opportunities.Asia Pacific is a significant player in the Phosphoric Acid Market, with a valuation of 17.0 USD billion in 2024, projected to increase to 28.0 USD billion by 2035, owing to the region's booming agriculture and industrial sectors.

    The Middle East and Africa contribute a smaller share, valued at 5.88 USD billion in 2024, expected to grow to 8.33 USD billion by 2035, showing potential for market expansion due to rising population and demand for fertilizers. Overall, these regional insights into the Phosphoric Acid Market revenue reflect a dynamic industry landscape influenced by agricultural trends and industrial demands.

    Phosphoric Acid Market Regional Insights

    Source: Primary Research, Secondary Research, Market Research Future Database, and Analyst Review

    Key Players and Competitive Insights

    The Phosphoric Acid Market has been experiencing significant shifts due to a variety of factors, including increasing demand from various end-use industries, technological advancements, and changes in trading patterns. In recent years, phosphoric acid has gained prominence as a key ingredient in fertilizers, food additives, and other chemical processes, thereby intensifying competition among market players. Companies are focusing on enhancing their product offerings, improving production processes, and expanding their geographical footprint to secure a competitive edge.

    The growing trend towards sustainable practices and environmentally friendly products has further prompted stakeholders to innovate and adapt their strategies in order to meet changing consumer preferences and regulatory requirements. Overall, the competitive landscape of the Phosphoric Acid Market is characterized by strategic partnerships, collaborations, mergers, and acquisitions, all aimed at consolidating market share and reinforcing brand identity in this dynamic industry.

    PhosAgro is a dominant force in the phosphoric acid market, consistently setting production milestones. For the first time in 2023, it exceeded 3 million tonnes of phosphoric acid and intends to increase its capacity by modernizing its facilities. These accomplishments are indicative of PhosAgro's strategic investments, efficient operations, and dedication to the integration of phosphate rock processing. PhosAgro's leadership in the supply of high-quality phosphoric acid to the fertilizer and industrial markets is assured by its scale and innovation.

    Innophos is a prominent manufacturer of specialty phosphoric acid, known for its emphasis on high-purity varieties that are specifically designed for demanding applications. Innophos provides phosphoric acid that is food, technical, and battery-grade, and it meets the rigorous quality standards of the industry. The company has manufacturing facilities in North America, Mexico, Canada, and China. The organization prioritizes the resilience of its supply chain by employing integrated production processes to guarantee traceable and dependable deliveries. Innophos customizes formulations to meet the unique requirements of a variety of industries, including pharmaceuticals, water treatment, food and beverage, and lithium-ion battery materials.

    In markets that necessitate refined, high-performance phosphoric acid solutions, Innophos is a preferred partner due to its dedication to innovation and extensive knowledge of phosphate chemistry.

    Key Companies in the Phosphoric Acid Market market include

    Industry Developments

    • Q2 2024: Coromandel International initiates establishment of INR 1,000 crore phosphoric and sulphuric acid complex in 2024 at its Kakinada facility in Andhra Pradesh Coromandel International began construction of a new phosphoric and sulphuric acid complex at its Kakinada facility in Andhra Pradesh, India, with an investment of INR 1,000 crore. The project aims to expand production capacity and is scheduled for completion within two years.
    • Q2 2024: Paradeep Phosphates Limited sanctions brownfield expansion of in-house phosphoric acid production capacity, with an estimated investment of INR 2,500 million Paradeep Phosphates Limited approved a brownfield expansion of its phosphoric acid production capacity, investing INR 2,500 million to achieve full backward integration in fertilizer manufacturing and reduce reliance on imports.

    Future Outlook

    Phosphoric Acid Market Future Outlook

    The Global Phosphoric Acid Market is projected to grow at a 4.37% CAGR from 2024 to 2035, driven by increasing agricultural demand, industrial applications, and technological advancements.

    New opportunities lie in:

    • Invest in sustainable production technologies to reduce environmental impact.
    • Expand into emerging markets with tailored phosphoric acid solutions.
    • Develop high-purity phosphoric acid for specialized industrial applications.

    By 2035, the market is expected to exhibit robust growth, positioning itself as a key player in global chemical industries.

    Market Segmentation

    Phosphoric Acid Market Source Outlook

    • Wet Process
    • Thermal Process

    Phosphoric Acid Market Regional Outlook

    • North America
    • Europe
    • South America
    • Asia Pacific
    • Middle East and Africa

    Phosphoric Acid Market Application Outlook

    • Fertilizers
    • Feed & Food Additives
    • Detergents
    • Water Treatment Chemicals
    • Others

    Report Scope

    Report Attribute/Metric Details
    Market Size 2023 54.42(USD Billion)
    Market Size 2024 55.88(USD Billion)
    Market Size 2035 89.45 (USD Billion)
    Compound Annual Growth Rate (CAGR) 4.37% (2025 - 2035)
    Report Coverage Revenue Forecast, Competitive Landscape, Growth Factors, and Trends
    Base Year 2024
    Market Forecast Period 2025 - 2035
    Historical Data 2019 - 2024
    Market Forecast Units USD Billion
    Key Companies Profiled Canpotex, AdvanSix, PhosAgro, Innophos, Fosfatos del Brasil, OCI Nitrogen, K+S Aktiengesellschaft, Yara International, OCP Group, Nutrien, The Mosaic Company, BASF, Coromandel International, J.R. Simplot Company, ICL Group
    Segments Covered Source, Application, Regional
    Key Market Opportunities Growing demand in fertilizers, Innovations in organic phosphorus, Expansion in food processing, increasing environmental regulations, and Rising applications in pharmaceuticals
    Key Market Dynamics Increasing agricultural demand, Industrial applications growth, Regulatory impacts, Raw material price fluctuations, Technological advancements in production
    Countries Covered North America, Europe, APAC, South America, MEA

    Market Highlights

    Author

    Chitranshi Jaiswal
    Research Analyst Level I

    She holds an experience of about 6+ years in market research and business consulting, working under the spectrum of information communication technology, telecommunications and semiconductor domains. aarti conceptualizes and implements a scalable business strategy and provides strategic leadership to the clients. her expertise lies in market estimation, competitive intelligence, pipeline analysis, customer assessment, etc.

    Leave a Comment

    Latest Comments

    John Doe

    This is a great article! Really helped me understand the topic better.

    Posted on July 23, 2025, 10:15 AM
    Jane Smith

    Thanks for sharing this. I’ve bookmarked it for later reference.

    Posted on July 22, 2025, 7:45 PM

    FAQs

    What is the expected market size of the Phosphoric Acid Market in 2024?

    The Phosphoric Acid Market is expected to be valued at 55.88 USD billion in 2024.

    What will be the market value of the Phosphoric Acid Market by 2035?

    By 2035, the Phosphoric Acid Market is anticipated to reach a value of 89.45 USD billion.

    What is the projected compound annual growth rate (CAGR) for the Phosphoric Acid Market from 2025 to 2035?

    The expected CAGR for the Phosphoric Acid Market from 2025 to 2035 is 4.37%.

    Which region is expected to hold the largest market share for the Phosphoric Acid Market in 2024?

    North America is projected to have the largest market share, valued at 15.5 USD Billion in 2024.

    What is the expected market size for the Phosphoric Acid Market in the Asia Pacific region by 2035?

    The Asia Pacific region is expected to reach a market size of 28.0 USD billion by 2035.

    Who are the key players in the Phosphoric Acid Market?

    Major players in the market include Canpotex, AdvanSix, PhosAgro, and OCI Nitrogen, among others.

    What is the market size for the Wet Process of Phosphoric Acid in 2024?

    The Wet Process of Phosphoric Acid is valued at 31.08 USD billion in 2024.

    What is the expected growth of the Thermal Process segment by 2035?

    The Thermal Process segment is anticipated to reach 38.74 USD billion by 2035.

    What is the value of the South American Phosphoric Acid Market in 2024?

    The South American Phosphoric Acid Market is valued at 5.5 USD Billion in 2024.

    What are the primary applications driving the demand for Phosphoric Acid?

    The primary applications driving demand for Phosphoric Acid include fertilizers, food additives, and industrial applications.

    1.     1. EXECUTIVE SUMMARY   
    2.         1.1. Market Overview 
    3.   1.2. Key Findings     
    4.         1.3. Market Segmentation     
    5.         1.4. Competitive Landscape 
    6.   1.5. Challenges and Opportunities     
    7.         1.6. Future Outlook 
    8. MARKET INTRODUCTION   
    9.       2.1. Definition     
    10.         2.2. Scope of the study 
    11.     2.2.1. Research Objective         
    12.             2.2.2. Assumption 
    13.           2.2.3. Limitations       
    14.   3. RESEARCH METHODOLOGY   
    15.         3.1. Overview     
    16.         3.2. Data Mining   
      1. Secondary Research     
    17.         3.4. Primary Research   
    18.             3.4.1. Primary
    19. Interviews and Information Gathering Process         
    20.             3.4.2. Breakdown
    21. of Primary Respondents           
    22.         3.5. Forecasting Model 
    23.   3.6. Market Size Estimation   
    24.             3.6.1. Bottom-Up Approach 
    25.           3.6.2. Top-Down Approach     
    26.     3.7. Data Triangulation     
    27.         3.8. Validation   
    28. MARKET DYNAMICS   
    29.       4.1. Overview     
    30.         4.2. Drivers     
    31.         4.3. Restraints   
      1. Opportunities        
    32.     5. MARKET FACTOR ANALYSIS   
    33.         5.1. Value chain Analysis 
    34.   5.2. Porter's Five Forces Analysis   
    35.             5.2.1. Bargaining Power of Suppliers 
    36.           5.2.2. Bargaining Power of Buyers   
    37.         5.2.3. Threat of New Entrants       
    38.     5.2.4. Threat of Substitutes         
    39.             5.2.5. Intensity
    40. of Rivalry           
    41.         5.3. COVID-19 Impact Analysis   
    42.             5.3.1. Market
    43. Impact Analysis         
    44.             5.3.2. Regional Impact   
    45.         5.3.3. Opportunity and Threat Analysis   
    46.     6. Phosphoric Acid Market, BY Source (USD Billion)   
    47.         6.1. Wet Process   
      1. Thermal Process        
    48.     7. Phosphoric Acid Market, BY Application (USD Billion) 
      1. Fertilizers     
    49.       7.2. Feed & Food Additives     
    50.         7.3. Detergents   
      1. Water Treatment Chemicals     
    51.         7.5. Others        
    52.     8. Phosphoric Acid Market, BY Regional
    53. (USD Billion)   
    54.       8.1. North America   
    55.             8.1.1. US     
    56.       8.1.2. Canada           
    57.         8.2. Europe   
    58.             8.2.1. Germany 
    59.           8.2.2. UK         
    60.             8.2.3. France 
    61.           8.2.4. Russia         
    62.             8.2.5. Italy 
    63.           8.2.6. Spain         
    64.             8.2.7. Rest
    65. of Europe           
    66.         8.3. APAC   
    67.             8.3.1. China 
    68.           8.3.2. India         
    69.             8.3.3. Japan 
    70.           8.3.4. South Korea       
    71.     8.3.5. Malaysia         
    72.             8.3.6. Thailand 
    73.           8.3.7. Indonesia         
    74.             8.3.8. Rest
    75. of APAC           
    76.         8.4. South America   
    77.             8.4.1. Brazil 
    78.           8.4.2. Mexico         
    79.             8.4.3. Argentina 
    80.           8.4.4. Rest of South America     
    81.     8.5. MEA   
    82.           8.5.1. GCC Countries       
    83.     8.5.2. South Africa         
    84.             8.5.3. Rest
    85. of MEA              
    86.     9. Competitive Landscape   
    87.         9.1. Overview   
      1. Competitive Analysis     
    88.         9.3. Market share Analysis     
    89.         9.4. Major Growth Strategy
    90. in the Phosphoric Acid Market     
    91.         9.5. Competitive Benchmarking     
    92.         9.6. Leading Players in Terms
    93. of Number of Developments in the Phosphoric Acid Market     
    94.         9.7. Key developments and
    95. growth strategies   
    96.           9.7.1. New Product Launch/Service Deployment 
    97.           9.7.2. Merger & Acquisitions   
    98.         9.7.3. Joint Ventures         
      1. Major Players Financial Matrix    
    99.             9.8.1. Sales and Operating Income 
    100.           9.8.2. Major Players R&D Expenditure. 2023 
    101.     10. Company Profiles   
    102.         10.1. Canpotex   
    103.             10.1.1. Financial
    104. Overview         
    105.             10.1.2. Products Offered 
    106.           10.1.3. Key Developments     
    107.       10.1.4. SWOT Analysis         
    108.             10.1.5. Key
    109. Strategies           
    110.         10.2. AdvanSix   
    111.             10.2.1. Financial
    112. Overview         
    113.             10.2.2. Products Offered 
    114.           10.2.3. Key Developments     
    115.       10.2.4. SWOT Analysis         
    116.             10.2.5. Key
    117. Strategies           
    118.         10.3. PhosAgro   
    119.             10.3.1. Financial
    120. Overview         
    121.             10.3.2. Products Offered 
    122.           10.3.3. Key Developments     
    123.       10.3.4. SWOT Analysis         
    124.             10.3.5. Key
    125. Strategies           
    126.         10.4. Innophos   
    127.             10.4.1. Financial
    128. Overview         
    129.             10.4.2. Products Offered 
    130.           10.4.3. Key Developments     
    131.       10.4.4. SWOT Analysis         
    132.             10.4.5. Key
    133. Strategies           
    134.         10.5. Fosfatos del Brasil   
    135.             10.5.1. Financial
    136. Overview         
    137.             10.5.2. Products Offered 
    138.           10.5.3. Key Developments     
    139.       10.5.4. SWOT Analysis         
    140.             10.5.5. Key
    141. Strategies           
    142.         10.6. OCI Nitrogen   
    143.             10.6.1. Financial
    144. Overview         
    145.             10.6.2. Products Offered 
    146.           10.6.3. Key Developments     
    147.       10.6.4. SWOT Analysis         
    148.             10.6.5. Key
    149. Strategies           
    150.         10.7. K+S Aktiengesellschaft   
    151.             10.7.1. Financial
    152. Overview         
    153.             10.7.2. Products Offered 
    154.           10.7.3. Key Developments     
    155.       10.7.4. SWOT Analysis         
    156.             10.7.5. Key
    157. Strategies           
    158.         10.8. Yara International   
    159.             10.8.1. Financial
    160. Overview         
    161.             10.8.2. Products Offered 
    162.           10.8.3. Key Developments     
    163.       10.8.4. SWOT Analysis         
    164.             10.8.5. Key
    165. Strategies           
    166.         10.9. OCP Group   
    167.             10.9.1. Financial
    168. Overview         
    169.             10.9.2. Products Offered 
    170.           10.9.3. Key Developments     
    171.       10.9.4. SWOT Analysis         
    172.             10.9.5. Key
    173. Strategies           
    174.         10.10. Nutrien   
    175.             10.10.1. Financial
    176. Overview         
    177.             10.10.2. Products Offered 
    178.           10.10.3. Key Developments     
    179.       10.10.4. SWOT Analysis         
    180.             10.10.5. Key
    181. Strategies           
    182.         10.11. The Mosaic Company   
    183.             10.11.1. Financial
    184. Overview         
    185.             10.11.2. Products Offered 
    186.           10.11.3. Key Developments     
    187.       10.11.4. SWOT Analysis         
    188.             10.11.5. Key
    189. Strategies           
    190.         10.12. BASF   
    191.             10.12.1. Financial
    192. Overview         
    193.             10.12.2. Products Offered 
    194.           10.12.3. Key Developments     
    195.       10.12.4. SWOT Analysis         
    196.             10.12.5. Key
    197. Strategies           
    198.         10.13. Coromandel International   
    199.             10.13.1. Financial
    200. Overview         
    201.             10.13.2. Products Offered 
    202.           10.13.3. Key Developments     
    203.       10.13.4. SWOT Analysis         
    204.             10.13.5. Key
    205. Strategies           
    206.         10.14. J.R. Simplot Company   
    207.             10.14.1. Financial
    208. Overview         
    209.             10.14.2. Products Offered 
    210.           10.14.3. Key Developments     
    211.       10.14.4. SWOT Analysis         
    212.             10.14.5. Key
    213. Strategies           
    214.         10.15. ICL Group   
    215.             10.15.1. Financial
    216. Overview         
    217.             10.15.2. Products Offered 
    218.           10.15.3. Key Developments     
    219.       10.15.4. SWOT Analysis         
    220.             10.15.5. Key
    221. Strategies              
    222.     11. Appendix   
    223.         11.1. References   
      1. Related Reports        
    224.     Table 1. LIST OF ASSUMPTIONS   
    225.     Table 2. North America Phosphoric Acid
    226. Market SIZE ESTIMATES & FORECAST, BY SOURCE, 2019-2035 (USD Billions) 
    227.     Table 3.
    228. North America Phosphoric Acid Market SIZE ESTIMATES & FORECAST, BY APPLICATION,
    229. 2035 (USD Billions)   
    230.     Table 4. North America Phosphoric Acid Market SIZE ESTIMATES
    231. & FORECAST, BY REGIONAL, 2019-2035 (USD Billions)   
    232.     Table 5. US Phosphoric Acid Market SIZE
    233. ESTIMATES & FORECAST, BY SOURCE, 2019-2035 (USD Billions)   
    234.     Table 6. US Phosphoric Acid Market SIZE
    235. ESTIMATES & FORECAST, BY APPLICATION, 2019-2035 (USD Billions)   
    236.     Table 7. US Phosphoric Acid Market SIZE
    237. ESTIMATES & FORECAST, BY REGIONAL, 2019-2035 (USD Billions)   
    238.     Table 8. Canada Phosphoric Acid Market
    239. SIZE ESTIMATES & FORECAST, BY SOURCE, 2019-2035 (USD Billions)   
    240.     Table 9. Canada Phosphoric Acid Market
    241. SIZE ESTIMATES & FORECAST, BY APPLICATION, 2019-2035 (USD Billions)   
    242.     Table 10. Canada Phosphoric Acid Market
    243. SIZE ESTIMATES & FORECAST, BY REGIONAL, 2019-2035 (USD Billions)   
    244.     Table 11. Europe Phosphoric Acid Market
    245. SIZE ESTIMATES & FORECAST, BY SOURCE, 2019-2035 (USD Billions)   
    246.     Table 12. Europe Phosphoric Acid Market
    247. SIZE ESTIMATES & FORECAST, BY APPLICATION, 2019-2035 (USD Billions)   
    248.     Table 13. Europe Phosphoric Acid Market
    249. SIZE ESTIMATES & FORECAST, BY REGIONAL, 2019-2035 (USD Billions)   
    250.     Table 14. Germany Phosphoric Acid Market
    251. SIZE ESTIMATES & FORECAST, BY SOURCE, 2019-2035 (USD Billions)   
    252.     Table 15. Germany Phosphoric Acid Market
    253. SIZE ESTIMATES & FORECAST, BY APPLICATION, 2019-2035 (USD Billions)   
    254.     Table 16. Germany Phosphoric Acid Market
    255. SIZE ESTIMATES & FORECAST, BY REGIONAL, 2019-2035 (USD Billions)   
    256.     Table 17. UK Phosphoric Acid Market SIZE
    257. ESTIMATES & FORECAST, BY SOURCE, 2019-2035 (USD Billions)   
    258.     Table 18. UK Phosphoric Acid Market SIZE
    259. ESTIMATES & FORECAST, BY APPLICATION, 2019-2035 (USD Billions)   
    260.     Table 19. UK Phosphoric Acid Market SIZE
    261. ESTIMATES & FORECAST, BY REGIONAL, 2019-2035 (USD Billions)   
    262.     Table 20. France Phosphoric Acid Market
    263. SIZE ESTIMATES & FORECAST, BY SOURCE, 2019-2035 (USD Billions)   
    264.     Table 21. France Phosphoric Acid Market
    265. SIZE ESTIMATES & FORECAST, BY APPLICATION, 2019-2035 (USD Billions)   
    266.     Table 22. France Phosphoric Acid Market
    267. SIZE ESTIMATES & FORECAST, BY REGIONAL, 2019-2035 (USD Billions)   
    268.     Table 23. Russia Phosphoric Acid Market
    269. SIZE ESTIMATES & FORECAST, BY SOURCE, 2019-2035 (USD Billions)   
    270.     Table 24. Russia Phosphoric Acid Market
    271. SIZE ESTIMATES & FORECAST, BY APPLICATION, 2019-2035 (USD Billions)   
    272.     Table 25. Russia Phosphoric Acid Market
    273. SIZE ESTIMATES & FORECAST, BY REGIONAL, 2019-2035 (USD Billions)   
    274.     Table 26. Italy Phosphoric Acid Market
    275. SIZE ESTIMATES & FORECAST, BY SOURCE, 2019-2035 (USD Billions)   
    276.     Table 27. Italy Phosphoric Acid Market
    277. SIZE ESTIMATES & FORECAST, BY APPLICATION, 2019-2035 (USD Billions)   
    278.     Table 28. Italy Phosphoric Acid Market
    279. SIZE ESTIMATES & FORECAST, BY REGIONAL, 2019-2035 (USD Billions)   
    280.     Table 29. Spain Phosphoric Acid Market
    281. SIZE ESTIMATES & FORECAST, BY SOURCE, 2019-2035 (USD Billions)   
    282.     Table 30. Spain Phosphoric Acid Market
    283. SIZE ESTIMATES & FORECAST, BY APPLICATION, 2019-2035 (USD Billions)   
    284.     Table 31. Spain Phosphoric Acid Market
    285. SIZE ESTIMATES & FORECAST, BY REGIONAL, 2019-2035 (USD Billions)   
    286.     Table 32. Rest of Europe Phosphoric Acid
    287. Market SIZE ESTIMATES & FORECAST, BY SOURCE, 2019-2035 (USD Billions) 
    288.     Table 33.
    289. Rest of Europe Phosphoric Acid Market SIZE ESTIMATES & FORECAST, BY APPLICATION,
    290. 2035 (USD Billions)   
    291.     Table 34. Rest of Europe Phosphoric Acid Market SIZE ESTIMATES
    292. & FORECAST, BY REGIONAL, 2019-2035 (USD Billions)   
    293.     Table 35. APAC Phosphoric Acid Market SIZE
    294. ESTIMATES & FORECAST, BY SOURCE, 2019-2035 (USD Billions)   
    295.     Table 36. APAC Phosphoric Acid Market SIZE
    296. ESTIMATES & FORECAST, BY APPLICATION, 2019-2035 (USD Billions)   
    297.     Table 37. APAC Phosphoric Acid Market SIZE
    298. ESTIMATES & FORECAST, BY REGIONAL, 2019-2035 (USD Billions)   
    299.     Table 38. China Phosphoric Acid Market
    300. SIZE ESTIMATES & FORECAST, BY SOURCE, 2019-2035 (USD Billions)   
    301.     Table 39. China Phosphoric Acid Market
    302. SIZE ESTIMATES & FORECAST, BY APPLICATION, 2019-2035 (USD Billions)   
    303.     Table 40. China Phosphoric Acid Market
    304. SIZE ESTIMATES & FORECAST, BY REGIONAL, 2019-2035 (USD Billions)   
    305.     Table 41. India Phosphoric Acid Market
    306. SIZE ESTIMATES & FORECAST, BY SOURCE, 2019-2035 (USD Billions)   
    307.     Table 42. India Phosphoric Acid Market
    308. SIZE ESTIMATES & FORECAST, BY APPLICATION, 2019-2035 (USD Billions)   
    309.     Table 43. India Phosphoric Acid Market
    310. SIZE ESTIMATES & FORECAST, BY REGIONAL, 2019-2035 (USD Billions)   
    311.     Table 44. Japan Phosphoric Acid Market
    312. SIZE ESTIMATES & FORECAST, BY SOURCE, 2019-2035 (USD Billions)   
    313.     Table 45. Japan Phosphoric Acid Market
    314. SIZE ESTIMATES & FORECAST, BY APPLICATION, 2019-2035 (USD Billions)   
    315.     Table 46. Japan Phosphoric Acid Market
    316. SIZE ESTIMATES & FORECAST, BY REGIONAL, 2019-2035 (USD Billions)   
    317.     Table 47. South Korea Phosphoric Acid Market
    318. SIZE ESTIMATES & FORECAST, BY SOURCE, 2019-2035 (USD Billions)   
    319.     Table 48. South Korea Phosphoric Acid Market
    320. SIZE ESTIMATES & FORECAST, BY APPLICATION, 2019-2035 (USD Billions)   
    321.     Table 49. South Korea Phosphoric Acid Market
    322. SIZE ESTIMATES & FORECAST, BY REGIONAL, 2019-2035 (USD Billions)   
    323.     Table 50. Malaysia Phosphoric Acid Market
    324. SIZE ESTIMATES & FORECAST, BY SOURCE, 2019-2035 (USD Billions)   
    325.     Table 51. Malaysia Phosphoric Acid Market
    326. SIZE ESTIMATES & FORECAST, BY APPLICATION, 2019-2035 (USD Billions)   
    327.     Table 52. Malaysia Phosphoric Acid Market
    328. SIZE ESTIMATES & FORECAST, BY REGIONAL, 2019-2035 (USD Billions)   
    329.     Table 53. Thailand Phosphoric Acid Market
    330. SIZE ESTIMATES & FORECAST, BY SOURCE, 2019-2035 (USD Billions)   
    331.     Table 54. Thailand Phosphoric Acid Market
    332. SIZE ESTIMATES & FORECAST, BY APPLICATION, 2019-2035 (USD Billions)   
    333.     Table 55. Thailand Phosphoric Acid Market
    334. SIZE ESTIMATES & FORECAST, BY REGIONAL, 2019-2035 (USD Billions)   
    335.     Table 56. Indonesia Phosphoric Acid Market
    336. SIZE ESTIMATES & FORECAST, BY SOURCE, 2019-2035 (USD Billions)   
    337.     Table 57. Indonesia Phosphoric Acid Market
    338. SIZE ESTIMATES & FORECAST, BY APPLICATION, 2019-2035 (USD Billions)   
    339.     Table 58. Indonesia Phosphoric Acid Market
    340. SIZE ESTIMATES & FORECAST, BY REGIONAL, 2019-2035 (USD Billions)   
    341.     Table 59. Rest of APAC Phosphoric Acid
    342. Market SIZE ESTIMATES & FORECAST, BY SOURCE, 2019-2035 (USD Billions) 
    343.     Table 60.
    344. Rest of APAC Phosphoric Acid Market SIZE ESTIMATES & FORECAST, BY APPLICATION,
    345. 2035 (USD Billions)   
    346.     Table 61. Rest of APAC Phosphoric Acid Market SIZE ESTIMATES
    347. & FORECAST, BY REGIONAL, 2019-2035 (USD Billions)   
    348.     Table 62. South America Phosphoric Acid
    349. Market SIZE ESTIMATES & FORECAST, BY SOURCE, 2019-2035 (USD Billions) 
    350.     Table 63.
    351. South America Phosphoric Acid Market SIZE ESTIMATES & FORECAST, BY APPLICATION,
    352. 2035 (USD Billions)   
    353.     Table 64. South America Phosphoric Acid Market SIZE ESTIMATES
    354. & FORECAST, BY REGIONAL, 2019-2035 (USD Billions)   
    355.     Table 65. Brazil Phosphoric Acid Market
    356. SIZE ESTIMATES & FORECAST, BY SOURCE, 2019-2035 (USD Billions)   
    357.     Table 66. Brazil Phosphoric Acid Market
    358. SIZE ESTIMATES & FORECAST, BY APPLICATION, 2019-2035 (USD Billions)   
    359.     Table 67. Brazil Phosphoric Acid Market
    360. SIZE ESTIMATES & FORECAST, BY REGIONAL, 2019-2035 (USD Billions)   
    361.     Table 68. Mexico Phosphoric Acid Market
    362. SIZE ESTIMATES & FORECAST, BY SOURCE, 2019-2035 (USD Billions)   
    363.     Table 69. Mexico Phosphoric Acid Market
    364. SIZE ESTIMATES & FORECAST, BY APPLICATION, 2019-2035 (USD Billions)   
    365.     Table 70. Mexico Phosphoric Acid Market
    366. SIZE ESTIMATES & FORECAST, BY REGIONAL, 2019-2035 (USD Billions)   
    367.     Table 71. Argentina Phosphoric Acid Market
    368. SIZE ESTIMATES & FORECAST, BY SOURCE, 2019-2035 (USD Billions)   
    369.     Table 72. Argentina Phosphoric Acid Market
    370. SIZE ESTIMATES & FORECAST, BY APPLICATION, 2019-2035 (USD Billions)   
    371.     Table 73. Argentina Phosphoric Acid Market
    372. SIZE ESTIMATES & FORECAST, BY REGIONAL, 2019-2035 (USD Billions)   
    373.     Table 74. Rest of South America Phosphoric
    374. Acid Market SIZE ESTIMATES & FORECAST, BY SOURCE, 2019-2035 (USD Billions) 
    375.     Table 75.
    376. Rest of South America Phosphoric Acid Market SIZE ESTIMATES & FORECAST, BY APPLICATION,
    377. 2035 (USD Billions)   
    378.     Table 76. Rest of South America Phosphoric Acid Market SIZE
    379. ESTIMATES & FORECAST, BY REGIONAL, 2019-2035 (USD Billions)   
    380.     Table 77. MEA Phosphoric Acid Market SIZE
    381. ESTIMATES & FORECAST, BY SOURCE, 2019-2035 (USD Billions)   
    382.     Table 78. MEA Phosphoric Acid Market SIZE
    383. ESTIMATES & FORECAST, BY APPLICATION, 2019-2035 (USD Billions)   
    384.     Table 79. MEA Phosphoric Acid Market SIZE
    385. ESTIMATES & FORECAST, BY REGIONAL, 2019-2035 (USD Billions)   
    386.     Table 80. GCC Countries Phosphoric Acid
    387. Market SIZE ESTIMATES & FORECAST, BY SOURCE, 2019-2035 (USD Billions) 
    388.     Table 81.
    389. GCC Countries Phosphoric Acid Market SIZE ESTIMATES & FORECAST, BY APPLICATION,
    390. 2035 (USD Billions)   
    391.     Table 82. GCC Countries Phosphoric Acid Market SIZE ESTIMATES
    392. & FORECAST, BY REGIONAL, 2019-2035 (USD Billions)   
    393.     Table 83. South Africa Phosphoric Acid
    394. Market SIZE ESTIMATES & FORECAST, BY SOURCE, 2019-2035 (USD Billions) 
    395.     Table 84.
    396. South Africa Phosphoric Acid Market SIZE ESTIMATES & FORECAST, BY APPLICATION,
    397. 2035 (USD Billions)   
    398.     Table 85. South Africa Phosphoric Acid Market SIZE ESTIMATES
    399. & FORECAST, BY REGIONAL, 2019-2035 (USD Billions)   
    400.     Table 86. Rest of MEA Phosphoric Acid Market
    401. SIZE ESTIMATES & FORECAST, BY SOURCE, 2019-2035 (USD Billions)   
    402.     Table 87. Rest of MEA Phosphoric Acid Market
    403. SIZE ESTIMATES & FORECAST, BY APPLICATION, 2019-2035 (USD Billions)   
    404.     Table 88. Rest of MEA Phosphoric Acid Market
    405. SIZE ESTIMATES & FORECAST, BY REGIONAL, 2019-2035 (USD Billions)   
    406.     Table 89. PRODUCT LAUNCH/PRODUCT DEVELOPMENT/APPROVAL 
    407.     Table 90.
    408. ACQUISITION/PARTNERSHIP   
    409. LIST
    410. Of figures
    411.     Figure 1. MARKET SYNOPSIS 
    412.     Figure 2. NORTH AMERICA PHOSPHORIC ACID
    413. MARKET ANALYSIS 
    414.     Figure 4. US PHOSPHORIC ACID MARKET ANALYSIS
    415. BY APPLICATION 
    416.     Figure 6. CANADA PHOSPHORIC ACID MARKET
    417. ANALYSIS BY SOURCE 
    418.   Figure 7. CANADA PHOSPHORIC ACID MARKET ANALYSIS BY APPLICATION 
    419.     Figure 8. CANADA PHOSPHORIC ACID MARKET
    420. ANALYSIS BY REGIONAL 
    421.   Figure 9. EUROPE PHOSPHORIC ACID MARKET ANALYSIS 
    422.     Figure 10. GERMANY PHOSPHORIC ACID MARKET
    423. ANALYSIS BY SOURCE 
    424.   Figure 11. GERMANY PHOSPHORIC ACID MARKET ANALYSIS BY APPLICATION 
    425.     Figure 12. GERMANY PHOSPHORIC ACID MARKET
    426. ANALYSIS BY REGIONAL 
    427.   Figure 13. UK PHOSPHORIC ACID MARKET ANALYSIS BY SOURCE 
    428.     Figure 14. UK PHOSPHORIC ACID MARKET ANALYSIS
    429. BY APPLICATION 
    430.     Figure 16. FRANCE PHOSPHORIC ACID MARKET
    431. ANALYSIS BY SOURCE 
    432.   Figure 17. FRANCE PHOSPHORIC ACID MARKET ANALYSIS BY APPLICATION 
    433.     Figure 18. FRANCE PHOSPHORIC ACID MARKET
    434. ANALYSIS BY REGIONAL 
    435.   Figure 19. RUSSIA PHOSPHORIC ACID MARKET ANALYSIS BY SOURCE 
    436.     Figure 20. RUSSIA PHOSPHORIC ACID MARKET
    437. ANALYSIS BY APPLICATION 
    438.   Figure 21. RUSSIA PHOSPHORIC ACID MARKET ANALYSIS BY REGIONAL 
    439.     Figure 22. ITALY PHOSPHORIC ACID MARKET
    440. ANALYSIS BY SOURCE 
    441.   Figure 23. ITALY PHOSPHORIC ACID MARKET ANALYSIS BY APPLICATION 
    442.     Figure 24. ITALY PHOSPHORIC ACID MARKET
    443. ANALYSIS BY REGIONAL 
    444.   Figure 25. SPAIN PHOSPHORIC ACID MARKET ANALYSIS BY SOURCE 
    445.     Figure 26. SPAIN PHOSPHORIC ACID MARKET
    446. ANALYSIS BY APPLICATION 
    447.   Figure 27. SPAIN PHOSPHORIC ACID MARKET ANALYSIS BY REGIONAL 
    448.     Figure 28. REST OF EUROPE PHOSPHORIC ACID
    449. MARKET ANALYSIS BY SOURCE 
    450.   Figure 29. REST OF EUROPE PHOSPHORIC ACID MARKET ANALYSIS BY APPLICATION 
    451.     Figure 30. REST OF EUROPE PHOSPHORIC ACID
    452. MARKET ANALYSIS BY REGIONAL 
    453.   Figure 31. APAC PHOSPHORIC ACID MARKET ANALYSIS 
    454.     Figure 32. CHINA PHOSPHORIC ACID MARKET
    455. ANALYSIS BY SOURCE 
    456.   Figure 33. CHINA PHOSPHORIC ACID MARKET ANALYSIS BY APPLICATION 
    457.     Figure 34. CHINA PHOSPHORIC ACID MARKET
    458. ANALYSIS BY REGIONAL 
    459.   Figure 35. INDIA PHOSPHORIC ACID MARKET ANALYSIS BY SOURCE 
    460.     Figure 36. INDIA PHOSPHORIC ACID MARKET
    461. ANALYSIS BY APPLICATION 
    462.   Figure 37. INDIA PHOSPHORIC ACID MARKET ANALYSIS BY REGIONAL 
    463.     Figure 38. JAPAN PHOSPHORIC ACID MARKET
    464. ANALYSIS BY SOURCE 
    465.   Figure 39. JAPAN PHOSPHORIC ACID MARKET ANALYSIS BY APPLICATION 
    466.     Figure 40. JAPAN PHOSPHORIC ACID MARKET
    467. ANALYSIS BY REGIONAL 
    468.   Figure 41. SOUTH KOREA PHOSPHORIC ACID MARKET ANALYSIS BY SOURCE 
    469.     Figure 42. SOUTH KOREA PHOSPHORIC ACID
    470. MARKET ANALYSIS BY APPLICATION 
    471.   Figure 43. SOUTH KOREA PHOSPHORIC ACID MARKET ANALYSIS BY REGIONAL 
    472.     Figure 44. MALAYSIA PHOSPHORIC ACID MARKET
    473. ANALYSIS BY SOURCE 
    474.   Figure 45. MALAYSIA PHOSPHORIC ACID MARKET ANALYSIS BY APPLICATION 
    475.     Figure 46. MALAYSIA PHOSPHORIC ACID MARKET
    476. ANALYSIS BY REGIONAL 
    477.   Figure 47. THAILAND PHOSPHORIC ACID MARKET ANALYSIS BY SOURCE 
    478.     Figure 48. THAILAND PHOSPHORIC ACID MARKET
    479. ANALYSIS BY APPLICATION 
    480.   Figure 49. THAILAND PHOSPHORIC ACID MARKET ANALYSIS BY REGIONAL 
    481.     Figure 50. INDONESIA PHOSPHORIC ACID MARKET
    482. ANALYSIS BY SOURCE 
    483.   Figure 51. INDONESIA PHOSPHORIC ACID MARKET ANALYSIS BY APPLICATION 
    484.     Figure 52. INDONESIA PHOSPHORIC ACID MARKET
    485. ANALYSIS BY REGIONAL 
    486.   Figure 53. REST OF APAC PHOSPHORIC ACID MARKET ANALYSIS BY SOURCE 
    487.     Figure 54. REST OF APAC PHOSPHORIC ACID
    488. MARKET ANALYSIS BY APPLICATION 
    489.   Figure 55. REST OF APAC PHOSPHORIC ACID MARKET ANALYSIS BY REGIONAL 
    490.     Figure 56. SOUTH AMERICA PHOSPHORIC ACID
    491. MARKET ANALYSIS 
    492.     Figure 58. BRAZIL PHOSPHORIC ACID MARKET
    493. ANALYSIS BY APPLICATION 
    494.   Figure 59. BRAZIL PHOSPHORIC ACID MARKET ANALYSIS BY REGIONAL 
    495.     Figure 60. MEXICO PHOSPHORIC ACID MARKET
    496. ANALYSIS BY SOURCE 
    497.   Figure 61. MEXICO PHOSPHORIC ACID MARKET ANALYSIS BY APPLICATION 
    498.     Figure 62. MEXICO PHOSPHORIC ACID MARKET
    499. ANALYSIS BY REGIONAL 
    500.   Figure 63. ARGENTINA PHOSPHORIC ACID MARKET ANALYSIS BY SOURCE 
    501.     Figure 64. ARGENTINA PHOSPHORIC ACID MARKET
    502. ANALYSIS BY APPLICATION 
    503.   Figure 65. ARGENTINA PHOSPHORIC ACID MARKET ANALYSIS BY REGIONAL 
    504.     Figure 66. REST OF SOUTH AMERICA PHOSPHORIC
    505. ACID MARKET ANALYSIS BY SOURCE 
    506.   Figure 67. REST OF SOUTH AMERICA PHOSPHORIC ACID MARKET ANALYSIS BY APPLICATION 
    507.     Figure 68. REST OF SOUTH AMERICA PHOSPHORIC
    508. ACID MARKET ANALYSIS BY REGIONAL 
    509.     Figure 69. MEA PHOSPHORIC ACID MARKET ANALYSIS 
    510.     Figure 70. GCC COUNTRIES PHOSPHORIC ACID
    511. MARKET ANALYSIS BY SOURCE 
    512.   Figure 71. GCC COUNTRIES PHOSPHORIC ACID MARKET ANALYSIS BY APPLICATION 
    513.     Figure 72. GCC COUNTRIES PHOSPHORIC ACID
    514. MARKET ANALYSIS BY REGIONAL 
    515.   Figure 73. SOUTH AFRICA PHOSPHORIC ACID MARKET ANALYSIS BY SOURCE 
    516.     Figure 74. SOUTH AFRICA PHOSPHORIC ACID
    517. MARKET ANALYSIS BY APPLICATION 
    518.   Figure 75. SOUTH AFRICA PHOSPHORIC ACID MARKET ANALYSIS BY REGIONAL 
    519.     Figure 76. REST OF MEA PHOSPHORIC ACID
    520. MARKET ANALYSIS BY SOURCE 
    521.   Figure 77. REST OF MEA PHOSPHORIC ACID MARKET ANALYSIS BY APPLICATION 
    522.     Figure 78. REST OF MEA PHOSPHORIC ACID
    523. MARKET ANALYSIS BY REGIONAL 
    524.   Figure 79. KEY BUYING CRITERIA OF PHOSPHORIC ACID MARKET 
    525.     Figure 80. RESEARCH PROCESS OF MRFR 
    526.     Figure 81. DRO ANALYSIS OF PHOSPHORIC ACID
    527. MARKET 
    528.     Figure
    529. DRIVERS IMPACT ANALYSIS: PHOSPHORIC ACID MARKET 
    530.     Figure 83. RESTRAINTS IMPACT ANALYSIS:
    531. PHOSPHORIC ACID MARKET 
    532.   Figure 84. SUPPLY / VALUE CHAIN: PHOSPHORIC ACID MARKET 
    533.     Figure 85. PHOSPHORIC ACID MARKET, BY SOURCE,
    534. (% SHARE) 
    535.     Figure 87. PHOSPHORIC ACID MARKET, BY APPLICATION,
    536. (% SHARE) 
    537.     Figure 89. PHOSPHORIC ACID MARKET, BY REGIONAL,
    538. (% SHARE) 
    539.     Figure 91. BENCHMARKING OF MAJOR COMPETITORS 

    Phosphoric Acid Market Segmentation


    • Phosphoric Acid Market By Source (USD Billion, 2019-2035)

      • Wet Process
      • Thermal Process


    • Phosphoric Acid Market By Application (USD Billion, 2019-2035)

      • Fertilizers
      • Feed & Food Additives
      • Detergents
      • Water Treatment Chemicals
      • Others


    • Phosphoric Acid Market By Regional (USD Billion, 2019-2035)

      • North America
      • Europe
      • South America
      • Asia Pacific
      • Middle East and Africa


    Phosphoric Acid Market Regional Outlook (USD Billion, 2019-2035)


    • North America Outlook (USD Billion, 2019-2035)

      • North America Phosphoric Acid Market by Source Type

        • Wet Process
        • Thermal Process
      • North America Phosphoric Acid Market by Application Type

        • Fertilizers
        • Feed & Food Additives
        • Detergents
        • Water Treatment Chemicals
        • Others
      • North America Phosphoric Acid Market by Regional Type

        • US
        • Canada
      • US Outlook (USD Billion, 2019-2035)
      • US Phosphoric Acid Market by Source Type

        • Wet Process
        • Thermal Process
      • US Phosphoric Acid Market by Application Type

        • Fertilizers
        • Feed & Food Additives
        • Detergents
        • Water Treatment Chemicals
        • Others
      • CANADA Outlook (USD Billion, 2019-2035)
      • CANADA Phosphoric Acid Market by Source Type

        • Wet Process
        • Thermal Process
      • CANADA Phosphoric Acid Market by Application Type

        • Fertilizers
        • Feed & Food Additives
        • Detergents
        • Water Treatment Chemicals
        • Others
    • Europe Outlook (USD Billion, 2019-2035)

      • Europe Phosphoric Acid Market by Source Type

        • Wet Process
        • Thermal Process
      • Europe Phosphoric Acid Market by Application Type

        • Fertilizers
        • Feed & Food Additives
        • Detergents
        • Water Treatment Chemicals
        • Others
      • Europe Phosphoric Acid Market by Regional Type

        • Germany
        • UK
        • France
        • Russia
        • Italy
        • Spain
        • Rest of Europe
      • GERMANY Outlook (USD Billion, 2019-2035)
      • GERMANY Phosphoric Acid Market by Source Type

        • Wet Process
        • Thermal Process
      • GERMANY Phosphoric Acid Market by Application Type

        • Fertilizers
        • Feed & Food Additives
        • Detergents
        • Water Treatment Chemicals
        • Others
      • UK Outlook (USD Billion, 2019-2035)
      • UK Phosphoric Acid Market by Source Type

        • Wet Process
        • Thermal Process
      • UK Phosphoric Acid Market by Application Type

        • Fertilizers
        • Feed & Food Additives
        • Detergents
        • Water Treatment Chemicals
        • Others
      • FRANCE Outlook (USD Billion, 2019-2035)
      • FRANCE Phosphoric Acid Market by Source Type

        • Wet Process
        • Thermal Process
      • FRANCE Phosphoric Acid Market by Application Type

        • Fertilizers
        • Feed & Food Additives
        • Detergents
        • Water Treatment Chemicals
        • Others
      • RUSSIA Outlook (USD Billion, 2019-2035)
      • RUSSIA Phosphoric Acid Market by Source Type

        • Wet Process
        • Thermal Process
      • RUSSIA Phosphoric Acid Market by Application Type

        • Fertilizers
        • Feed & Food Additives
        • Detergents
        • Water Treatment Chemicals
        • Others
      • ITALY Outlook (USD Billion, 2019-2035)
      • ITALY Phosphoric Acid Market by Source Type

        • Wet Process
        • Thermal Process
      • ITALY Phosphoric Acid Market by Application Type

        • Fertilizers
        • Feed & Food Additives
        • Detergents
        • Water Treatment Chemicals
        • Others
      • SPAIN Outlook (USD Billion, 2019-2035)
      • SPAIN Phosphoric Acid Market by Source Type

        • Wet Process
        • Thermal Process
      • SPAIN Phosphoric Acid Market by Application Type

        • Fertilizers
        • Feed & Food Additives
        • Detergents
        • Water Treatment Chemicals
        • Others
      • REST OF EUROPE Outlook (USD Billion, 2019-2035)
      • REST OF EUROPE Phosphoric Acid Market by Source Type

        • Wet Process
        • Thermal Process
      • REST OF EUROPE Phosphoric Acid Market by Application Type

        • Fertilizers
        • Feed & Food Additives
        • Detergents
        • Water Treatment Chemicals
        • Others
    • APAC Outlook (USD Billion, 2019-2035)

      • APAC Phosphoric Acid Market by Source Type

        • Wet Process
        • Thermal Process
      • APAC Phosphoric Acid Market by Application Type

        • Fertilizers
        • Feed & Food Additives
        • Detergents
        • Water Treatment Chemicals
        • Others
      • APAC Phosphoric Acid Market by Regional Type

        • China
        • India
        • Japan
        • South Korea
        • Malaysia
        • Thailand
        • Indonesia
        • Rest of APAC
      • CHINA Outlook (USD Billion, 2019-2035)
      • CHINA Phosphoric Acid Market by Source Type

        • Wet Process
        • Thermal Process
      • CHINA Phosphoric Acid Market by Application Type

        • Fertilizers
        • Feed & Food Additives
        • Detergents
        • Water Treatment Chemicals
        • Others
      • INDIA Outlook (USD Billion, 2019-2035)
      • INDIA Phosphoric Acid Market by Source Type

        • Wet Process
        • Thermal Process
      • INDIA Phosphoric Acid Market by Application Type

        • Fertilizers
        • Feed & Food Additives
        • Detergents
        • Water Treatment Chemicals
        • Others
      • JAPAN Outlook (USD Billion, 2019-2035)
      • JAPAN Phosphoric Acid Market by Source Type

        • Wet Process
        • Thermal Process
      • JAPAN Phosphoric Acid Market by Application Type

        • Fertilizers
        • Feed & Food Additives
        • Detergents
        • Water Treatment Chemicals
        • Others
      • SOUTH KOREA Outlook (USD Billion, 2019-2035)
      • SOUTH KOREA Phosphoric Acid Market by Source Type

        • Wet Process
        • Thermal Process
      • SOUTH KOREA Phosphoric Acid Market by Application Type

        • Fertilizers
        • Feed & Food Additives
        • Detergents
        • Water Treatment Chemicals
        • Others
      • MALAYSIA Outlook (USD Billion, 2019-2035)
      • MALAYSIA Phosphoric Acid Market by Source Type

        • Wet Process
        • Thermal Process
      • MALAYSIA Phosphoric Acid Market by Application Type

        • Fertilizers
        • Feed & Food Additives
        • Detergents
        • Water Treatment Chemicals
        • Others
      • THAILAND Outlook (USD Billion, 2019-2035)
      • THAILAND Phosphoric Acid Market by Source Type

        • Wet Process
        • Thermal Process
      • THAILAND Phosphoric Acid Market by Application Type

        • Fertilizers
        • Feed & Food Additives
        • Detergents
        • Water Treatment Chemicals
        • Others
      • INDONESIA Outlook (USD Billion, 2019-2035)
      • INDONESIA Phosphoric Acid Market by Source Type

        • Wet Process
        • Thermal Process
      • INDONESIA Phosphoric Acid Market by Application Type

        • Fertilizers
        • Feed & Food Additives
        • Detergents
        • Water Treatment Chemicals
        • Others
      • REST OF APAC Outlook (USD Billion, 2019-2035)
      • REST OF APAC Phosphoric Acid Market by Source Type

        • Wet Process
        • Thermal Process
      • REST OF APAC Phosphoric Acid Market by Application Type

        • Fertilizers
        • Feed & Food Additives
        • Detergents
        • Water Treatment Chemicals
        • Others
    • South America Outlook (USD Billion, 2019-2035)

      • South America Phosphoric Acid Market by Source Type

        • Wet Process
        • Thermal Process
      • South America Phosphoric Acid Market by Application Type

        • Fertilizers
        • Feed & Food Additives
        • Detergents
        • Water Treatment Chemicals
        • Others
      • South America Phosphoric Acid Market by Regional Type

        • Brazil
        • Mexico
        • Argentina
        • Rest of South America
      • BRAZIL Outlook (USD Billion, 2019-2035)
      • BRAZIL Phosphoric Acid Market by Source Type

        • Wet Process
        • Thermal Process
      • BRAZIL Phosphoric Acid Market by Application Type

        • Fertilizers
        • Feed & Food Additives
        • Detergents
        • Water Treatment Chemicals
        • Others
      • MEXICO Outlook (USD Billion, 2019-2035)
      • MEXICO Phosphoric Acid Market by Source Type

        • Wet Process
        • Thermal Process
      • MEXICO Phosphoric Acid Market by Application Type

        • Fertilizers
        • Feed & Food Additives
        • Detergents
        • Water Treatment Chemicals
        • Others
      • ARGENTINA Outlook (USD Billion, 2019-2035)
      • ARGENTINA Phosphoric Acid Market by Source Type

        • Wet Process
        • Thermal Process
      • ARGENTINA Phosphoric Acid Market by Application Type

        • Fertilizers
        • Feed & Food Additives
        • Detergents
        • Water Treatment Chemicals
        • Others
      • REST OF SOUTH AMERICA Outlook (USD Billion, 2019-2035)
      • REST OF SOUTH AMERICA Phosphoric Acid Market by Source Type

        • Wet Process
        • Thermal Process
      • REST OF SOUTH AMERICA Phosphoric Acid Market by Application Type

        • Fertilizers
        • Feed & Food Additives
        • Detergents
        • Water Treatment Chemicals
        • Others
    • MEA Outlook (USD Billion, 2019-2035)

      • MEA Phosphoric Acid Market by Source Type

        • Wet Process
        • Thermal Process
      • MEA Phosphoric Acid Market by Application Type

        • Fertilizers
        • Feed & Food Additives
        • Detergents
        • Water Treatment Chemicals
        • Others
      • MEA Phosphoric Acid Market by Regional Type

        • GCC Countries
        • South Africa
        • Rest of MEA
      • GCC COUNTRIES Outlook (USD Billion, 2019-2035)
      • GCC COUNTRIES Phosphoric Acid Market by Source Type

        • Wet Process
        • Thermal Process
      • GCC COUNTRIES Phosphoric Acid Market by Application Type

        • Fertilizers
        • Feed & Food Additives
        • Detergents
        • Water Treatment Chemicals
        • Others
      • SOUTH AFRICA Outlook (USD Billion, 2019-2035)
      • SOUTH AFRICA Phosphoric Acid Market by Source Type

        • Wet Process
        • Thermal Process
      • SOUTH AFRICA Phosphoric Acid Market by Application Type

        • Fertilizers
        • Feed & Food Additives
        • Detergents
        • Water Treatment Chemicals
        • Others
      • REST OF MEA Outlook (USD Billion, 2019-2035)
      • REST OF MEA Phosphoric Acid Market by Source Type

        • Wet Process
        • Thermal Process
      • REST OF MEA Phosphoric Acid Market by Application Type

        • Fertilizers
        • Feed & Food Additives
        • Detergents
        • Water Treatment Chemicals
        • Others


    Infographic

    Free Sample Request

    Kindly complete the form below to receive a free sample of this Report

    Get Free Sample

    Customer Strories

    “I am very pleased with how market segments have been defined in a relevant way for my purposes (such as "Portable Freezers & refrigerators" and "last-mile"). In general the report is well structured. Thanks very much for your efforts.”

    Victoria Milne

    Founder
    Case Study

    Smartphone Motherboard Parts Manufacturing Research