• Cat-intel
  • MedIntelliX
  • Resources
  • About Us
  • Request Free Sample ×

    Kindly complete the form below to receive a free sample of this Report

    Leading companies partner with us for data-driven Insights

    clients tt-cursor

    Virtual Engineering Market

    ID: MRFR/ICT/10357-HCR
    160 Pages
    Aarti Dhapte
    September 2025

    Virtual Engineering Market Research Report Information By Software Type (Computer-Aided Design, Computer-Aided Engineering, Computer-Aided Manufacturing, Computer-Aided Engineering, Architecture, Engineering and Construction, Electronic Design Automation, Organization Size (SME’s and Large Enterprises), Application (Automation Design , Plant Design, Product Design, 3D Modelling), Industry Vertical (Aerospace & Defense, Automotive, Banking, IT & Telecommunication, Oil & Gas, Healthcare and Others) By Regions - Forecast Till 2032

    Share:
    Download PDF ×

    We do not share your information with anyone. However, we may send you emails based on your report interest from time to time. You may contact us at any time to opt-out.

    Virtual Engineering Market Research Report - Global Forecast till 2032 Infographic
    Purchase Options
    $ 4,950.0
    $ 5,950.0
    $ 7,250.0
    Table of Contents

    Virtual Engineering Market Summary

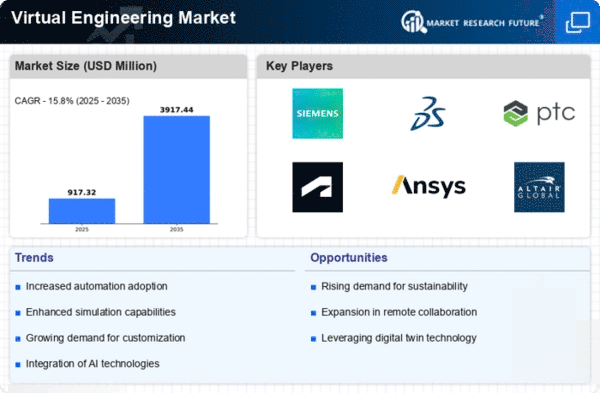
    The Global Virtual Engineering Market is projected to grow from 792.1 USD Million in 2024 to 4015.5 USD Million by 2035.

    Key Market Trends & Highlights

    Virtual Engineering Key Trends and Highlights

    • The market is expected to experience a compound annual growth rate (CAGR) of 15.9 percent from 2025 to 2035.
    • By 2035, the market valuation is anticipated to reach 4015.5 USD Million, indicating substantial growth potential.
    • In 2024, the market is valued at 792.1 USD Million, reflecting the current demand for virtual engineering solutions.
    • Growing adoption of advanced simulation technologies due to increased efficiency requirements is a major market driver.

    Market Size & Forecast

    2024 Market Size 792.1 (USD Million)
    2035 Market Size 4015.5 (USD Million)
    CAGR (2025-2035) 15.9%

    Major Players

    Siemens PLM Software, Dassault Systems, Ansys, Autodesk, Inc, Altair Engineering, Inc, Hexagon AB (MSC Software), Bentley Systems, HCL Technologies, Carlson Software, PTC, IBM Corporation, Accenture, Bosch Rexroth, Capgemini

    Virtual Engineering Market Trends

    Growing Demand for Innovative Technologies

    Virtual engineering tools have proven indispensable in a variety of sectors. The merging of technologies including as simulation, computer-aided design (CAD), and virtual reality (VR) has enabled the creation of user-friendly, low-cost VP systems. These tools are increasingly seen as the next generation of computerized design systems. Because of benefits such as reduced time consumption and cost-effectiveness, virtual engineering is commonly employed as an alternative for fast prototyping. Furthermore, virtual engineering entails doing tasks in a computer-controlled environment where real-world situations may be produced for evaluating products or systems prior to manufacture.

    Virtual engineering allows engineers to optimize designs, forecast product performance, and discover possible concerns early in the development process. This results in higher product quality, dependability, and functionality. As a result, the increased need for virtual prototyping will aid in the expansion of the virtual engineering industry. However, as the manufacturing business becomes more competitive, virtual engineering approaches for product development are being used to assist improve product quality. This aids manufacturers in maintaining their competitive position.

    The Global Virtual Engineering Market is poised for transformative growth as industries increasingly leverage advanced simulation technologies to enhance product development and operational efficiency.

    U.S. Department of Commerce

    Virtual Engineering Market Drivers

    Expansion of Industry 4.0

    The ongoing expansion of Industry 4.0 significantly influences the Global Virtual Engineering Market Industry. As manufacturing processes become increasingly digitized and interconnected, the need for virtual engineering solutions grows. Industry 4.0 emphasizes automation, data exchange, and smart manufacturing, all of which benefit from virtual engineering methodologies. For example, the integration of the Internet of Things (IoT) with virtual engineering allows for real-time monitoring and optimization of production processes. This synergy is expected to drive market growth, as organizations seek to leverage virtual engineering to enhance operational efficiency and innovation.

    Market Growth Projections

    The Global Virtual Engineering Market Industry is poised for remarkable growth, with projections indicating a rise from 792.1 USD Million in 2024 to 4015.5 USD Million by 2035. This trajectory suggests a robust CAGR of 15.9% from 2025 to 2035, reflecting the increasing integration of virtual engineering across various sectors. The growth is driven by factors such as technological advancements, cost efficiency, and sustainability initiatives. As industries continue to evolve and adapt to new challenges, the demand for virtual engineering solutions is expected to expand, solidifying its role as a cornerstone of modern engineering practices.

    Technological Advancements

    The Global Virtual Engineering Market Industry is propelled by rapid technological advancements in simulation and modeling tools. Innovations in software and hardware, such as high-performance computing and artificial intelligence, enhance the capabilities of virtual engineering. These technologies enable engineers to create more accurate models and simulations, leading to improved product designs and reduced time-to-market. For instance, the integration of AI in design processes allows for predictive analytics, which can optimize engineering workflows. As a result, the market is projected to reach 792.1 USD Million in 2024, reflecting the growing reliance on advanced technologies in engineering practices.

    Growing Focus on Sustainability

    Sustainability is becoming a pivotal concern within the Global Virtual Engineering Market Industry. As industries face increasing pressure to reduce their carbon footprints, virtual engineering offers a pathway to more sustainable practices. By enabling virtual testing and simulation, companies can minimize resource consumption and waste generation during the product development phase. This approach aligns with global sustainability goals and regulations, making virtual engineering an attractive option for environmentally conscious organizations. The industry's growth trajectory, with a projected CAGR of 15.9% from 2025 to 2035, indicates a strong alignment between virtual engineering and sustainability initiatives.

    Rising Adoption in Emerging Markets

    Emerging markets are witnessing a notable increase in the adoption of virtual engineering solutions, thereby driving the Global Virtual Engineering Market Industry. Countries in Asia-Pacific and Latin America are investing in advanced engineering technologies to enhance their manufacturing capabilities. This trend is fueled by the need for competitive advantage in global markets, prompting local companies to embrace virtual engineering for product development and innovation. As these regions continue to develop their industrial sectors, the market is likely to experience substantial growth, contributing to the overall expansion of the virtual engineering landscape.

    Increased Demand for Cost Efficiency

    Cost efficiency remains a critical driver for the Global Virtual Engineering Market Industry. Organizations are increasingly adopting virtual engineering solutions to minimize expenses associated with physical prototyping and testing. By utilizing virtual simulations, companies can identify design flaws early in the development process, thereby reducing material waste and labor costs. This shift towards virtual solutions is particularly evident in sectors such as automotive and aerospace, where the cost of physical prototypes can be exorbitant. The anticipated growth to 4015.5 USD Million by 2035 underscores the financial benefits that virtual engineering brings to organizations seeking to optimize their operations.

    Market Segment Insights

    Virtual Engineering Market Component Segment Insights

    Virtual Engineering Software Type Insights

    Based on Solution, the Virtual Engineering Market segmentation includes Computer-Aided Design (CAD), Computer-Aided Engineering (CAE), Computer-Aided Manufacturing (CAM), Computer-Aided Engineering (CAE), Architecture, Engineering and Construction (AEC), Electronic Design Automation (EDA). The CAD category led with almost 38.1% of the market. Companies have seen an enormous spike in the need for CAD tools to assist product design and development across a wide variety of industries, including automotive, construction, manufacturing, and healthcare. CAD tools save operating expenses and boost manufacturing efficiency. CAD also provides a method for standardizing the drawing process, removing uncertainty from simulation operations.

    Furthermore, CAD is a basic tool that explains several features of a product prototype during simulation and testing. As a result, this segment is expected to capture a large market share throughout the projection period.

    Figure2: Virtual Engineering Market, by Software Type, 2022 VS 2032 (USD Million)

    Source: Secondary Research, Primary Research, Market Research Future Database, and Analyst Review 

    Virtual Engineering Market Deployment Segment Insights

    Based on Deployment, the Virtual Engineering Market segmentation includes On-premises and Cloud. In 2022, the on-premises segment represented most of the market. This expansion can be associated with a high demand for on-premises virtual engineering tools used for maintaining the privacy of a product model or design. Furthermore, the widespread use of cloud-based tools by small and medium-sized manufacturers to decrease the high infrastructure costs associated with on-premises deployment of virtual engineering tools is expected to fuel market expansion in the coming years.

    Virtual Engineering Market Industry Vertical Segment Insights

    Based on the Industry Vertical, the Virtual Engineering Market segmentation includes Aerospace & Defense, Automotive, Banking, IT & Telecommunication, Oil & Gas, Healthcare and Others. In terms of revenue, the automotive industry accounted for the largest a percentage of the worldwide virtual engineering market in 2022. This expansion may be ascribed to OEMs' increased use of CAD and other technologies to boost productivity in designing and manufacturing, as well as precisely test product prototypes before investing in mass production.

    Get more detailed insights about Virtual Engineering Market Research Report - Global Forecast till 2032

    Regional Insights

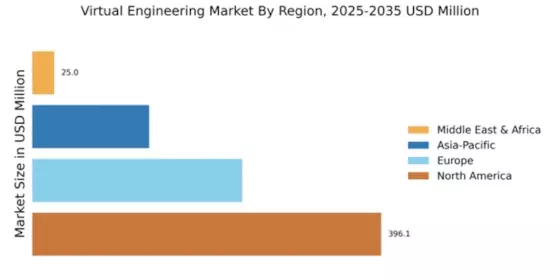
    By Region, the study provides market insights into North America, Europe, Asia-Pacific, and the Rest of the World. In terms of revenue, North America accounted for around 33.7% of the market due to the increasing use of CAD tools by the aviation and automotive sectors to develop prototypes of aircraft equipment and engines. Furthermore, manufacturers are investing heavily in the deployment of virtual prototype technologies for designing and simulating Advanced Driver-Assistance Systems (ADAS) solutions for newly built automobiles. Furthermore, prominent automobile manufactures like as Ford, General Motors, and Tesla have made substantial contributions to regional market growth.

    Companies in the automotive industry, such as Tesla and General Motors, are using virtual engineering solutions to create and stimulate innovative driver-assistance systems solutions in newest built vehicles. North America is presently the most advanced and competitive automotive market in terms of electric vehicle manufacturing and distribution. The presence of automotive manufacturers contributes to the region's rapid production of electric vehicles and will lead to growth of virtual engineering. Thus, the regional market is expected to grow significantly throughout the projection period.

    Figure3: VIRTUAL ENGINEERING MARKET SIZE BY REGION 2022 VS 2032 (USD MILLION)

    VIRTUAL ENGINEERING MARKET SIZE BY REGION 2022 VS 2032 (USD MILLION)

    Source: Secondary Research, Primary Research, Market Research Future Database, and Analyst Review

    Further, the major countries studied in the market report are the U.S., Canada, Germany, France, the UK, Italy, Spain, China, Japan, India, Australia, South Korea, and Brazil.

    APAC is predicted to be the fastest-growing market due to rising demand for virtual engineering in consumer electronics and automobile production. The presence of some of the world's leading consumer electronics manufacturers in important markets such as China and Japan is also expected to drive regional market expansion over the projection period.

    Europe is also predicted to grow significantly between 2023 and 2032 due to the technological advancements, industry adoption, supportive funding, and policies by the European government in the region.

    Key Players and Competitive Insights

    With a strong presence across different verticals and geographies, the Virtual Engineering Market is competitive and dominated by established, pure-play vendors. These vendors have a robust geographic footprint and partner ecosystem to cater to diverse customer segments.

    The major players in the market include Siemens PLM Software, Dassault Systems, Ansys, Autodesk, Inc, Altair Engineering, Inc, Hexagon AB (MSC Software), Bentley Systems, HCL Technologies, Carlson Software, PTC, IBM Corporation, Accenture, Capgemini, Bosch Rexroth, among other players.

    The Virtual Engineering Market is a consists of many players. Several important industry participants continually strive to create innovations. To strengthen their market positions, a few major companies are forming alliances and increasing their worldwide reach in growing countries.

    Key Companies in the Virtual Engineering Market market include

    Industry Developments

    In November 2022, IBM revealed new tools to help organizations demolish data silos and integrate analytics to make data-driven decisions and quickly address unplanned interruptions. Through business intelligence planning, budgeting, reporting, forecasting, and dashboard capabilities, IBM Business Analytics Enterprise provides customers with a holistic view of data sources throughout their organization.

    In November 2022, Bentley Systems announced the introduction of Bentley Infrastructure Cloud in November 2022, a collection of business solutions spanning the whole infrastructure value chain and lifecycle. Bentley Infrastructure Cloud's complete and evergreen digital twins will enable improved infrastructure creation, delivery, and maintenance.

    Future Outlook

    Virtual Engineering Market Future Outlook

    The Global Virtual Engineering Market is projected to grow at a 15.9% CAGR from 2024 to 2035, driven by advancements in AI, automation, and demand for digital twin technologies.

    New opportunities lie in:

    • Develop AI-driven simulation tools for real-time engineering analysis.
    • Invest in cloud-based virtual collaboration platforms for global teams.
    • Create customized virtual engineering solutions for emerging industries.

    By 2035, the market is expected to achieve substantial growth, positioning itself as a leader in engineering innovation.

    Market Segmentation

    Virtual Engineering Regional Outlook

    • US
    • Canada

    Virtual Engineering Application Outlook

    • Automation Design
    • Plant Design
    • Product Design
    • 3D Modelling
    • Others

    Virtual Engineering Software Type Outlook

    • Computer-Aided Designing (CAD)
    • Computer-Aided Manufacturing (CAM)
    • Computer-Aided Engineering (CAE)
    • Architecture, Engineering and Construction (AEC)
    • Electronic Design Automation (EDA)

    Virtual Engineering Deployment Mode Outlook

    • On-premises
    • Cloud

    Virtual Engineering Industry Vertical Outlook

    • Aerospace & Defense
    • Automotive
    • Banking
    • IT & Telecommunication
    • Oil & Gas
    • Healthcare
    • Others

    Virtual Engineering Organization Size Outlook

    • SME’s
    • Large Enterprises

    Report Scope

    Report Attribute/Metric Details
    Market Size2022 USD 552.3 million
    Market Size 2023 USD 684.4 million
    Market Size 2032 USD 2,579.2 million
    Compound Annual Growth Rate (CAGR) 15.9 % (2023-2032)
    Base Year 2022
    Market Forecast Period 2023-2032
    Historical Data 2019- 2022
    Market Forecast Units Value (USD Million)
    Report Coverage Revenue Forecast, Market Competitive Landscape, Growth Factors, and Trends
    Segments Covered Software Type, Deployment, Organization Size, Application, Industry Vertical and Region
    Geographies Covered Europe, North America, Asia-Pacific, and the Rest of the World
    Countries Covered The U.S, Germany, Canada, U.K., Italy, France, Spain, Japan, China, Australia, India, South Korea, and Brazil
    Key Companies Profiled Siemens PLM Software, Dassault Systems, Ansys, Autodesk, Inc., Altair Engineering, Inc., Hexagon AB (MSC Software), Bentley Systems, HCL Technologies, Carlson Software, PTC, IBM Corporation, Accenture, and Others
    Key Market Opportunities Rising Demand for 3D Modelling
    Key Market Dynamics Adoption of Cloud Based Software Robust Demand for Computer-Aided Design (CAD) Software

    Market Highlights

    Author
    Aarti Dhapte
    Team Lead - Research

    She holds an experience of about 6+ years in Market Research and Business Consulting, working under the spectrum of Information Communication Technology, Telecommunications and Semiconductor domains. Aarti conceptualizes and implements a scalable business strategy and provides strategic leadership to the clients. Her expertise lies in market estimation, competitive intelligence, pipeline analysis, customer assessment, etc.

    Leave a Comment

    FAQs

    How much is the Virtual Engineering Market?

    The Virtual Engineering Market size is expected to be valued at USD 552.3 Million in 2022.

    What is the growth rate of the Virtual Engineering Market?

    The global market is projected to grow at a CAGR of 15.9% during the forecast period, 2023-2032.

    Which region held the largest market share in the Virtual Engineering Market?

    North America had the largest share of the global market.

    Who are the key players in the Virtual Engineering Market?

    The key players in the market are Siemens PLM Software, Dassault Systems, Ansys, Autodesk, Inc., Altair Engineering, Inc., Hexagon AB (MSC Software), Bentley Systems, HCL Technologies, Carlson Software, PTC, IBM Corporation, Accenture, Capgemini, Bosch Rexroth, among others.

    Which Software Tool in the Virtual Engineering Market?

    The computer-Aided Designing (CAD) category dominated the market in 2022.

    1. EXECUTIVE SUMMARY
      1. Market Attractiveness Analysis
        1. Global Virtual Engineering Market, by Software Type
        2. Global
    2. Virtual Engineering Market, by Deployment Type
      1. Global Virtual Engineering
    3. Market, by Organization Size
      1. Global Virtual Engineering Market, by Industry
    4. Vertical
      1. Global Virtual Engineering Market, by Industry Vertical
        1. Global Virtual Engineering Market, by Region
    5. MARKET INTRODUCTION
      1. Definition
      2. Scope of the Study
      3. Market Structure
    6. Key Buying Criteria
      1. Macro Factor Indicator Analysis
    7. RESEARCH METHODOLOGY
      1. Research Process
      2. Primary Research
      3. Secondary Research
      4. Market Size Estimation
      5. Forecast Model
      6. List of Assumptions
    8. MARKET DYNAMICS
      1. Introduction
      2. Drivers
        1. Adoption
    9. of Cloud Based Software
      1. Robust Demand for Computer-Aided Design (CAD)
    10. Software
      1. Drivers Impact Analysis
      2. Restraints
        1. Piracy
    11. Issues
      1. Lack of Skilled Personnel
        1. Restraints Impact Analysis
      2. Opportunities
        1. Rising Demand for 3D Modelling
      3. Impact
    12. of COVID-19
      1. Impact on the various engineering software demand
    13. Impact on industry verticals
      1. Impact on technology development
    14. YOY growth 2020-2030
    15. MARKET FACTOR ANALYSIS
      1. Value Chain Analysis/Supply
    16. Chain Analysis
      1. Porter’s Five Forces Model
      2. Bargaining Power
    17. of Suppliers
      1. Bargaining Power of Buyers
      2. Threat of New Entrants
      3. Threat of Substitutes
      4. Intensity of Rivalry
    18. GLOBAL VIRTUAL
    19. ENGINEERINGMARKET MARKET, BY SOFTWARE TYPE
      1. Introduction
      2. Computer-Aided
    20. Designing (CAD)
      1. Computer-Aided Manufacturing (CAM)
      2. Computer-Aided
    21. Engineering (CAE)
      1. Architecture, Engineering and Construction (AEC)
      2. Electronic Design Automation (EDA)
    22. GLOBAL VIRTUAL ENGINEERINGMARKET
    23. MARKET, BY DEPLOYMENT TYPE
      1. Introduction
      2. On-premises
    24. Cloud
    25. GLOBAL VIRTUAL ENGINEERINGMARKET MARKET, BY ORGANIZATION SIZE
    26. Introduction
      1. SME’s
      2. Large Enterprises
    27. GLOBAL VIRTUAL
    28. ENGINEERINGMARKET MARKET, BY APPLICATION
      1. Introduction
      2. Automation
    29. Design
      1. Plant Design
      2. Product Design
      3. 3D Modelling
      4. Others
    30. GLOBAL VIRTUAL ENGINEERINGMARKET, BY INDUSTRY VERTICAL
      1. Introduction
      2. Aerospace & Defense
      3. Automotive
      4. Banking
      5. IT & Telecommunication
      6. Oil & Gas
      7. Healthcare
      8. Others
    31. GLOBAL VIRTUAL ENGINEERINGMARKET,
    32. BY REGION
      1. Introduction
      2. North America
        1. Market Estimates
    33. & Forecast, by Country, 2019–2032
      1. Market Estimates &
    34. Forecast, by Software type, 2019–2032
      1. Market Estimates &
    35. Forecast, by Deployment type, 2019–2032
      1. Market Estimates &
    36. Forecast, by Organization Size, 2019–2032
      1. Market Estimates &
    37. Forecast, by Application, 2019–2032
      1. Market Estimates & Forecast,
    38. by Industry Vertical, 2019–2032
      1. US
        1. Market Estimates
    39. & Forecast, by Software type, 2019–2032
      1. Market Estimates
    40. & Forecast, by Deployment type, 2019–2032
      1. Market Estimates
    41. & Forecast, by Organization Size, 2019–2032
      1. Market Estimates
    42. & Forecast, by Application, 2019–2032
      1. Market Estimates
    43. & Forecast, by Industry Vertical, 2019–2032
      1. Canada
    44. Market Estimates & Forecast, by Software type, 2019–2032
    45. Market Estimates & Forecast, by Deployment type, 2019–2032
    46. Market Estimates & Forecast, by Organization Size, 2019–2032
    47. Market Estimates & Forecast, by Application, 2019–2032
    48. Market Estimates & Forecast, by Industry Vertical, 2019–2032
    49. Mexico
      1. Market Estimates & Forecast, by Software type, 2019–2032
        1. Market Estimates & Forecast, by Deployment type, 2019–2032
      2. Europe
        1. Market Estimates & Forecast, by Country, 2019–2032
        2. Market Estimates & Forecast, by Software type, 2019–2032
        3. Market Estimates & Forecast, by Deployment type, 2019–2032
        4. Market Estimates & Forecast, by Organization Size, 2019–2032
        5. Market Estimates & Forecast, by Application, 2019–2032
    50. Market Estimates & Forecast, by Industry Vertical, 2019–2032
    51. Germany
      1. Market Estimates & Forecast, by Software type, 2019–2032
        1. Market Estimates & Forecast, by Deployment type, 2019–2032
        2. UK
        3. France
    52. Size, 2019–2032
      1. Market Estimates & Forecast, by Application,
        1. Market Estimates & Forecast, by Industry Vertical,
        2. Italy
    53. by Software type, 2019–2032
      1. Market Estimates & Forecast,
    54. by Deployment type, 2019–2032
      1. Market Estimates & Forecast,
    55. by Organization Size, 2019–2032
      1. Market Estimates & Forecast,
    56. by Application, 2019–2032
      1. Market Estimates & Forecast,
    57. by Industry Vertical, 2019–2032
      1. Spain
        1. Market
    58. Estimates & Forecast, by Software type, 2019–2032
      1. Market
    59. Estimates & Forecast, by Deployment type, 2019–2032
      1. Market
    60. Estimates & Forecast, by Organization Size, 2019–2032
    61. Market Estimates & Forecast, by Application, 2019–2032
    62. Market Estimates & Forecast, by Industry Vertical, 2019–2032
    63. Rest of Europe
      1. Market Estimates & Forecast, by Software type,
        1. Market Estimates & Forecast, by Deployment type,
    64. Size, 2019–2032
      1. Market Estimates & Forecast, by Application,
        1. Market Estimates & Forecast, by Industry Vertical,
      2. Asia-Pacific
        1. Market Estimates & Forecast,
    65. by Country, 2019–2032
      1. Market Estimates & Forecast, by Software
    66. type, 2019–2032
      1. Market Estimates & Forecast, by Deployment
    67. type, 2019–2032
      1. Market Estimates & Forecast, by Organization
    68. Size, 2019–2032
      1. Market Estimates & Forecast, by Application,
        1. Market Estimates & Forecast, by Industry Vertical,
        2. China
    69. by Software type, 2019–2032
      1. Market Estimates & Forecast,
    70. by Deployment type, 2019–2032
      1. Market Estimates & Forecast,
    71. by Organization Size, 2019–2032
      1. Market Estimates & Forecast,
    72. by Application, 2019–2032
      1. Market Estimates & Forecast,
    73. by Industry Vertical, 2019–2032
      1. Japan
        1. Market Estimates
    74. & Forecast, by Software type, 2019–2032
      1. Market Estimates
    75. & Forecast, by Deployment type, 2019–2032
      1. Market Estimates
    76. & Forecast, by Organization Size, 2019–2032
      1. Market Estimates
    77. & Forecast, by Application, 2019–2032
      1. Market Estimates
    78. & Forecast, by Industry Vertical, 2019–2032
      1. India
    79. Market Estimates & Forecast, by Software type, 2019–2032
    80. Market Estimates & Forecast, by Deployment type, 2019–2032
    81. Market Estimates & Forecast, by Organization Size, 2019–2032
    82. Market Estimates & Forecast, by Application, 2019–2032
    83. Market Estimates & Forecast, by Industry Vertical, 2019–2032
    84. Rest of Asia-Pacific
      1. Market Estimates & Forecast, by Software
    85. type, 2019–2032
      1. Market Estimates & Forecast, by Deployment
    86. type, 2019–2032
      1. Market Estimates & Forecast, by Organization
    87. Size, 2019–2032
      1. Market Estimates & Forecast, by Application,
        1. Market Estimates & Forecast, by Industry Vertical,
      2. Middle East and Africa
        1. Market Estimates
    88. & Forecast, by Software type, 2019–2032
      1. Market Estimates
    89. & Forecast, by Deployment type, 2019–2032
      1. Market Estimates
    90. & Forecast, by Organization Size, 2019–2032
      1. Market Estimates
    91. & Forecast, by Application, 2019–2032
      1. Market Estimates &
    92. Forecast, by Industry Vertical, 2019–2032
      1. South America
    93. Market Estimates & Forecast, by Software type, 2019–2032
    94. Market Estimates & Forecast, by Deployment type, 2019–2032
    95. Market Estimates & Forecast, by Organization Size, 2019–2032
    96. Market Estimates & Forecast, by Application, 2019–2032
      1. Market
    97. Estimates & Forecast, by Industry Vertical, 2019–2032
    98. COMPETITIVE LANDSCAPE
      1. Introduction
      2. Key Developments & Growth Strategies
      3. Competitor Benchmarking
      4. Vendor Share Analysis, 2022 (% Share)
    99. COMPANY PROFILES
      1. Siemens PLM Software
      2. Dassault Systems
      3. Ansys
      4. Autodesk, Inc.
      5. Altair Engineering, Inc.
    100. Hexagon AB (MSC Software)
      1. Bentley Systems
      2. HCL Technologies
      3. Carlson Software
      4. PTC, IBM Corporation
      5. Accenture
      6. Bosch Rexroth
      7. Capgemini
      8. Others
    101. Company Overview
      1. Financial Overview
        1. Organization Size/Services
    102. Offered
      1. Key Developments
        1. SWOT Analysis
    103. Key Strategies


    Virtual Engineering Market Segmentation

    • Global Virtual Engineering, By Software Type Outlook (USD Million, 2019-2032)

      • Computer-Aided Designing (CAD)
      • Computer-Aided Manufacturing (CAM)
      • Computer-Aided Engineering (CAE)
      • Architecture, Engineering and Construction (AEC)
      • Electronic Design Automation (EDA)Others
    • Global Virtual Engineering, By Deployment Type Outlook (USD Million, 2019-2032)

      • On-premises
      • Cloud
    • Global Virtual Engineering, By Organization Size Outlook (USD Million, 2019-2032)

      • SME’s
      • Large Enterprises
    • Global Virtual Engineering, By Application Outlook (USD Million, 2019-2032)

      • Automation Design
      • Plant Design
      • Product Design
      • 3D MODELLING
      • Others
    • Global Virtual Engineering, By Industry Vertical Outlook (USD Million, 2019-2032)

      • Commercial Industry Vertical

        • Retail
        • Healthcare
        • Industrial
        • Transportation & Logistics
        • Hospitality
        • Others
      • Defense Industry Vertical

    Global Virtual Engineering Regional Outlook (USD Million, 2019-2032)

    • North America Outlook (USD Million, 2019-2032)

    • North America Virtual Engineering, By Software Type Outlook (USD Million, 2019-2032)

      • Computer-Aided Designing (CAD)
      • Computer-Aided Manufacturing (CAM)
      • Computer-Aided Engineering (CAE)
      • Architecture, Engineering and Construction (AEC)
      • Electronic Design Automation (EDA)Others
    • North America Virtual Engineering, By Deployment Type Outlook (USD Million, 2019-2032)

      • On-premises
      • Cloud
    • North America Virtual Engineering, By Organization Size Outlook (USD Million, 2019-2032)

      • SME’s
      • Large Enterprises
    • North America Virtual Engineering, By Application Outlook (USD Million, 2019-2032)

      • Automation Design
      • Plant Design
      • Product Design
      • 3D Modelling
      • Others
    • North America Virtual Engineering, By Industry Vertical Outlook (USD Million, 2019-2032)

      • Aerospace & Defense
      • Automotive
      • Banking
      • IT & Telecommunication
      • Oil & Gas
      • Healthcare
      • Others


      • US Outlook (USD Million, 2019-2032)

      • US Virtual Engineering, By Software Type Outlook (USD Million, 2019-2032)

        • Computer-Aided Designing (CAD)
        • Computer-Aided Manufacturing (CAM)
        • Computer-Aided Engineering (CAE)
        • Architecture, Engineering and Construction (AEC)
        • Electronic Design Automation (EDA)Others
      • US Virtual Engineering, By Deployment Type Outlook (USD Million, 2019-2032)

        • On-premises
        • Cloud
      • US Virtual Engineering, By Organization Size Outlook (USD Million, 2019-2032)

        • SME’s
        • Large Enterprises
      • US Virtual Engineering, By Application Outlook (USD Million, 2019-2032)

        • Automation Design
        • Plant Design
        • Product Design
        • 3D Modelling
        • Others
      • US Virtual Engineering, By Industry Vertical Outlook (USD Million, 2019-2032)

        • Aerospace & Defense
        • Automotive
        • Banking
        • IT & Telecommunication
        • Oil & Gas
        • Healthcare
        • Others
      • Canada Outlook (USD Million, 2019-2032)

      • Canada Virtual Engineering, By Software Type Outlook (USD Million, 2019-2032)

        • Computer-Aided Designing (CAD)
        • Computer-Aided Manufacturing (CAM)
        • Computer-Aided Engineering (CAE)
        • Architecture, Engineering and Construction (AEC)
        • Electronic Design Automation (EDA)
      • Canada Virtual Engineering, By Deployment Type Outlook (USD Million, 2019-2032)

        • On-premises
        • Cloud
      • Canada Virtual Engineering, By Organization Size Outlook (USD Million, 2019-2032)

        • SME’s
        • Large Enterprises
      • Canada Virtual Engineering, By Application Outlook (USD Million, 2019-2032)

        • Automation Design
        • Plant Design
        • Product Design
        • 3D Modelling
        • Others
      • Canada Virtual Engineering, By Industry Vertical Outlook (USD Million, 2019-2032)

        • Aerospace & Defense
        • Automotive
        • Banking
        • IT & Telecommunication
        • Oil & Gas
        • Healthcare
        • Others
      • Mexico Outlook (USD Million, 2019-2032)

      • Mexico Virtual Engineering, By Software Type Outlook (USD Million, 2019-2032)

        • Computer-Aided Designing (CAD)
        • Computer-Aided Manufacturing (CAM)
        • Computer-Aided Engineering (CAE)
        • Architecture, Engineering and Construction (AEC)
        • Electronic Design Automation (EDA)
      • Mexico Virtual Engineering, By Deployment Type Outlook (USD Million, 2019-2032)

        • On-premises
        • Cloud
      • Mexico Virtual Engineering, By Organization Size Outlook (USD Million, 2019-2032)

        • SME’s
        • Large Enterprises
      • Mexico Virtual Engineering, By Application Outlook (USD Million, 2019-2032)

        • Automation Design
        • Plant Design
        • Product Design
        • 3D Modelling
        • Others
      • Mexico Virtual Engineering, By Industry Vertical Outlook (USD Million, 2019-2032)

        • Aerospace & Defense
        • Automotive
        • Banking
        • IT & Telecommunication
        • Oil & Gas
        • Healthcare
        • Others
    • Europe Outlook (USD Million, 2019-2032)

    • Europe Virtual Engineering, By Software Type Outlook (USD Million, 2019-2032)

      • Computer-Aided Designing (CAD)
      • Computer-Aided Manufacturing (CAM)
      • Computer-Aided Engineering (CAE)
      • Architecture, Engineering and Construction (AEC)
      • Electronic Design Automation (EDA)
    • Europe Virtual Engineering, By Deployment Type Outlook (USD Million, 2019-2032)

      • On-premises
      • Cloud
    • Europe Virtual Engineering, By Organization Size Outlook (USD Million, 2019-2032)

      • SME’s
      • Large Enterprises
    • Europe Virtual Engineering, By Application Outlook (USD Million, 2019-2032)

      • Automation Design
      • Plant Design
      • Product Design
      • 3D Modelling
      • Others
    • Europe Virtual Engineering, By Industry Vertical Outlook (USD Million, 2019-2032)

      • Aerospace & Defense
      • Automotive
      • Banking
      • IT & Telecommunication
      • Oil & Gas
      • Healthcare
      • Others


      • Germany Outlook (USD Million, 2019-2032)

      • Germany Virtual Engineering, By Software Type Outlook (USD Million, 2019-2032)

        • Computer-Aided Designing (CAD)
        • Computer-Aided Manufacturing (CAM)
        • Computer-Aided Engineering (CAE)
        • Architecture, Engineering and Construction (AEC)
        • Electronic Design Automation (EDA)
      • Germany Virtual Engineering, By Deployment Type Outlook (USD Million, 2019-2032)

        • On-premises
        • Cloud
      • Germany Virtual Engineering, By Organization Size Outlook (USD Million, 2019-2032)

        • SME’s
        • Large Enterprises
      • Germany Virtual Engineering, By Application Outlook (USD Million, 2019-2032)

        • Automation Design
        • Plant Design
        • Product Design
        • 3D Modelling
        • Others
      • Germany Virtual Engineering, By Industry Vertical Outlook (USD Million, 2019-2032)

        • Aerospace & Defense
        • Automotive
        • Banking
        • IT & Telecommunication
        • Oil & Gas
        • Healthcare
        • Others
      • France Outlook (USD Million, 2019-2032)

      • France Virtual Engineering, By Software Type Outlook (USD Million, 2019-2032)

        • Computer-Aided Designing (CAD)
        • Computer-Aided Manufacturing (CAM)
        • Computer-Aided Engineering (CAE)
        • Architecture, Engineering and Construction (AEC)
        • Electronic Design Automation (EDA)
      • France Virtual Engineering, By Deployment Type Outlook (USD Million, 2019-2032)

        • On-premises
        • Cloud
      • France Virtual Engineering, By Organization Size Outlook (USD Million, 2019-2032)

        • SME’s
        • Large Enterprises
      • France Virtual Engineering, By Application Outlook (USD Million, 2019-2032)

        • Automation Design
        • Plant Design
        • Product Design
        • 3D Modelling
        • Others
      • France Virtual Engineering, By Industry Vertical Outlook (USD Million, 2019-2032)

        • Aerospace & Defense
        • Automotive
        • Banking
        • IT & Telecommunication
        • Oil & Gas
        • Healthcare
        • Others
      • UK Outlook (USD Million, 2019-2032)

      • UK Virtual Engineering, By Software Type Outlook (USD Million, 2019-2032)

        • Computer-Aided Designing (CAD)
        • Computer-Aided Manufacturing (CAM)
        • Computer-Aided Engineering (CAE)
        • Architecture, Engineering and Construction (AEC)
        • Electronic Design Automation (EDA)
      • UK Virtual Engineering, By Deployment Type Outlook (USD Million, 2019-2032)

        • On-premises
        • Cloud
      • UK Virtual Engineering, By Organization Size Outlook (USD Million, 2019-2032)

        • SME’s
        • Large Enterprises
      • UK Virtual Engineering, By Application Outlook (USD Million, 2019-2032)

        • Automation Design
        • Plant Design
        • Product Design
        • 3D Modelling
        • Others
      • UK Virtual Engineering, By Industry Vertical Outlook (USD Million, 2019-2032)

        • Aerospace & Defense
        • Automotive
        • Banking
        • IT & Telecommunication
        • Oil & Gas
        • Healthcare
        • Others


      • Rest of Europe Outlook (USD Million, 2019-2032)

      • Rest of Europe Virtual Engineering, By Software Type Outlook (USD Million, 2019-2032)

        • Computer-Aided Designing (CAD)
        • Computer-Aided Manufacturing (CAM)
        • Computer-Aided Engineering (CAE)
        • Architecture, Engineering and Construction (AEC)
        • Electronic Design Automation (EDA)
      • Rest of Europe Virtual Engineering, By Deployment Type Outlook (USD Million, 2019-2032)

        • On-premises
        • Cloud
        • 3D
      • Rest of Europe Virtual Engineering, By Organization Size Outlook (USD Million, 2019-2032)

        • SME’s
        • Large Enterprises
      • Rest of Europe Virtual Engineering, By Application Outlook (USD Million, 2019-2032)

        • Automation Design
        • Plant Design
        • Product Design
        • 3D Modelling
        • Others
      • Rest of Europe Virtual Engineering, By Industry Vertical Outlook (USD Million, 2019-2032)

        • Aerospace & Defense
        • Automotive
        • Banking
        • IT & Telecommunication
        • Oil & Gas
        • Healthcare
        • Others


    • Asia-Pacific Outlook (USD Million, 2019-2032)

    • Asia-Pacific Virtual Engineering, By Software Type Outlook (USD Million, 2019-2032)

      • Computer-Aided Designing (CAD)
      • Computer-Aided Manufacturing (CAM)
      • Computer-Aided Engineering (CAE)
      • Architecture, Engineering and Construction (AEC)
      • Electronic Design Automation (EDA)
    • Asia-Pacific Virtual Engineering, By Deployment Type Outlook (USD Million, 2019-2032)

      • On-premises
      • Cloud
    • Asia-Pacific Virtual Engineering, By Organization Size Outlook (USD Million, 2019-2032)

      • SME’s
      • Large Enterprises
    • Asia-Pacific Virtual Engineering, By Application Outlook (USD Million, 2019-2032)

      • Automation Design
      • Plant Design
      • Product Design
      • 3D Modelling
      • Others
    • Asia-Pacific Virtual Engineering, By Industry Vertical Outlook (USD Million, 2019-2032)

      • Aerospace & Defense
      • Automotive
      • Banking
      • IT & Telecommunication
      • Oil & Gas
      • Healthcare
      • Others


      • China Outlook (USD Million, 2019-2032)

      • China Virtual Engineering, By Software Type Outlook (USD Million, 2019-2032)

        • Computer-Aided Designing (CAD)
        • Computer-Aided Manufacturing (CAM)
        • Computer-Aided Engineering (CAE)
        • Architecture, Engineering and Construction (AEC)
        • Electronic Design Automation (EDA)
      • China Virtual Engineering, By Deployment Type Outlook (USD Million, 2019-2032)

        • On-premises
        • Cloud
      • China Virtual Engineering, By Organization Size Outlook (USD Million, 2019-2032)

        • SME’s
        • Large Enterprises
      • China Virtual Engineering, By Application Outlook (USD Million, 2019-2032)

        • Automation Design
        • Plant Design
        • Product Design
        • 3D Modelling
        • Others
      • China Virtual Engineering, By Industry Vertical Outlook (USD Million, 2019-2032)

        • Aerospace & Defense
        • Automotive
        • Banking
        • IT & Telecommunication
        • Oil & Gas
        • Healthcare
        • Others


      • India Outlook (USD Million, 2019-2032)

      • India Virtual Engineering, By Software Type Outlook (USD Million, 2019-2032)

        • Computer-Aided Designing (CAD)
        • Computer-Aided Manufacturing (CAM)
        • Computer-Aided Engineering (CAE)
        • Architecture, Engineering and Construction (AEC)
        • Electronic Design Automation (EDA)
      • India Virtual Engineering, By Deployment Type Outlook (USD Million, 2019-2032)

        • On-premises
        • Cloud
      • India Virtual Engineering, By Organization Size Outlook (USD Million, 2019-2032)

        • SME’s
        • Large Enterprises
      • India Virtual Engineering, By Application Outlook (USD Million, 2019-2032)

        • Automation Design
        • Plant Design
        • Product Design
        • 3D Modelling
        • Others
      • India Virtual Engineering, By Industry Vertical Outlook (USD Million, 2019-2032)

        • Aerospace & Defense
        • Automotive
        • Banking
        • IT & Telecommunication
        • Oil & Gas
        • Healthcare
        • Others


      • Japan Outlook (USD Million, 2019-2032)

      • Japan Virtual Engineering, By Software Type Outlook (USD Million, 2019-2032)

        • Computer-Aided Designing (CAD)
        • Computer-Aided Manufacturing (CAM)
        • Computer-Aided Engineering (CAE)
        • Architecture, Engineering and Construction (AEC)
        • Electronic Design Automation (EDA)
      • Japan Virtual Engineering, By Deployment Type Outlook (USD Million, 2019-2032)

        • On-premises
        • Cloud
      • Japan Virtual Engineering, By Organization Size Outlook (USD Million, 2019-2032)

        • SME’s
        • Large Enterprises
      • Japan Virtual Engineering, By Application Outlook (USD Million, 2019-2032)

        • Automation Design
        • Plant Design
        • Product Design
        • 3D Modelling
        • Others
      • Japan Virtual Engineering, By Industry Vertical Outlook (USD Million, 2019-2032)

        • Aerospace & Defense
        • Automotive
        • Banking
        • IT & Telecommunication
        • Oil & Gas
        • Healthcare
        • Others


      • Rest of Asia-Pacific Outlook (USD Million, 2019-2032)

      • Rest of Asia-Pacific Virtual Engineering, By Software Type Outlook (USD Million, 2019-2032)

        • Computer-Aided Designing (CAD)
        • Computer-Aided Manufacturing (CAM)
        • Computer-Aided Engineering (CAE)
        • Architecture, Engineering and Construction (AEC)
        • Electronic Design Automation (EDA)
      • Rest of Asia-Pacific Virtual Engineering, By Deployment Type Outlook (USD Million, 2019-2032)

        • On-premises
        • Cloud
      • Rest of Asia-Pacific Virtual Engineering, By Organization Size Outlook (USD Million, 2019-2032)

        • SME’s
        • Large Enterprises
      • Rest of Asia-Pacific Virtual Engineering, By Application Outlook (USD Million, 2019-2032)

        • Automation Design
        • Plant Design
        • Product Design
        • 3D Modelling
        • Others
      • Rest of Asia-Pacific Virtual Engineering, By Industry Vertical Outlook (USD Million, 2019-2032)

        • Aerospace & Defense
        • Automotive
        • Banking
        • IT & Telecommunication
        • Oil & Gas
        • Healthcare
        • Others
    • Rest of the World Outlook (USD Million, 2019-2032)

      • Middle East & Africa Outlook (USD Million, 2019-2032)

      • Middle East & Africa Virtual Engineering, By Software Type Outlook (USD Million, 2019-2032)

        • Computer-Aided Designing (CAD)
        • Computer-Aided Manufacturing (CAM)
        • Computer-Aided Engineering (CAE)
        • Architecture, Engineering and Construction (AEC)
        • Electronic Design Automation (EDA)
      • Middle East & Africa Virtual Engineering, By Deployment Type Outlook (USD Million, 2019-2032)

        • On-premises
        • Cloud
      • Middle East & Africa Virtual Engineering, By Organization Size Outlook (USD Million, 2019-2032)

        • SME’s
        • Large Enterprises
      • Middle East & Africa Virtual Engineering, By Application Outlook (USD Million, 2019-2032)

        • Automation Design
        • Plant Design
        • Product Design
        • 3D Modelling
        • Others
      • Middle East & Africa Virtual Engineering, By Industry Vertical Outlook (USD Million, 2019-2032)

        • Aerospace & Defense
        • Automotive
        • Banking
        • IT & Telecommunication
        • Oil & Gas
        • Healthcare
        • Others
      • South America Outlook (USD Million, 2019-2032)

      • South America Virtual Engineering, By Software Type Outlook (USD Million, 2019-2032)

        • Computer-Aided Designing (CAD)
        • Computer-Aided Manufacturing (CAM)
        • Computer-Aided Engineering (CAE)
        • Architecture, Engineering and Construction (AEC)
        • Electronic Design Automation (EDA)
      • South America Virtual Engineering, By Deployment Type Outlook (USD Million, 2019-2032)

        • On-premises
        • Cloud
      • South America Virtual Engineering, By Organization Size Outlook (USD Million, 2019-2032)

        • SME’s
        • Large Enterprises
      • South America Virtual Engineering, By Application Outlook (USD Million, 2019-2032)

        • Automation Design
        • Plant Design
        • Product Design
        • 3D Modelling
        • Others
      • South America Virtual Engineering, By Industry Vertical Outlook (USD Million, 2019-2032)

        • Aerospace & Defense
        • Automotive
        • Banking
        • IT & Telecommunication
        • Oil & Gas
        • Healthcare
        • Others


    Report Infographic
    Free Sample Request

    Kindly complete the form below to receive a free sample of this Report

    Customer Strories

    “I am very pleased with how market segments have been defined in a relevant way for my purposes (such as "Portable Freezers & refrigerators" and "last-mile"). In general the report is well structured. Thanks very much for your efforts.”

    Victoria Milne Founder
    Case Study

    Chemicals and Materials