• Cat-intel
  • MedIntelliX
  • Resources
  • About Us
  • Request Free Sample ×

    Kindly complete the form below to receive a free sample of this Report

    Leading companies partner with us for data-driven Insights

    clients tt-cursor

    Produced Water Treatment Market

    ID: MRFR/E&P/1065-HCR
    120 Pages
    Chitranshi Jaiswal
    September 2025

    Produced Water Treatment Market Research Report Information By Well Type (Land, Offshore), By Treatment (Chemical, Physical, Membrane), And By Region (North America, Europe, Asia-Pacific, And Rest Of The World) –Market Forecast Till 2032

    Share:
    Download PDF ×

    We do not share your information with anyone. However, we may send you emails based on your report interest from time to time. You may contact us at any time to opt-out.

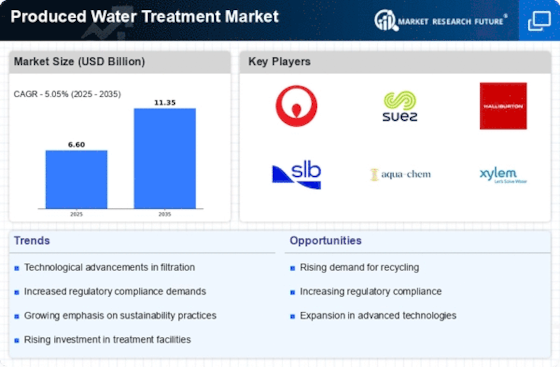
    Produced Water Treatment Market Research Report - Forecast to 2032 Infographic
    Purchase Options
    $ 4,950.0
    $ 5,950.0
    $ 7,250.0
    Table of Contents

    Produced Water Treatment Market Summary

    As per Market Research Future Analysis, the Global Produced Water Treatment Market was valued at USD 6.24 billion in 2023 and is projected to grow to USD 9.79 billion by 2032, with a CAGR of 5.05% from 2024 to 2032. The market is driven by technological advancements and increased exploration activities in onshore and offshore oil and gas sectors. The rise in water scarcity and stringent environmental regulations are also significant factors influencing market growth.

    Key Market Trends & Highlights

    Key trends driving the Produced Water Treatment Market include technological innovation and regulatory pressures.

    • Market Size in 2023: USD 6.24 billion.
    • Projected Market Size by 2032: USD 9.79 billion.
    • CAGR from 2024 to 2032: 5.05%.
    • Over 60% of produced water originates from oilfields.

    Market Size & Forecast

    2023 Market Size USD 6.24 billion
    2024 Market Size USD 6.60 billion
    2032 Market Size USD 9.79 billion
    CAGR (2024-2032) 5.05%

    Major Players

    Key players include Siemens AG, Aker Solutions, Alderley plc, Schlumberger Limited, and CETCO Energy Services.

    Produced Water Treatment Market Trends

      • Rise in water scarcity is driving the market growth

    Governments of several countries have enacted stringent regulations on environmental practices by imposing discharge norms regarding oil concentration levels in discharged streams.Water acts as a pushing agent for oil & gas (helping oil & gas rise to the surface). Produced water needs to be treated and reused to increase productivity for extracting oil & gas from the well.

    Various water treatment methods have been introduced due to an increase in the productivity of oil & gas and stringent government norms to control the discharge of produced water directly.Demand for produced water treatment is high in countries experiencing a scarcity of freshwater. 

    Asia Pacific experiences greater water scarcity problems; therefore, the adoption rate of water treatment methods is considerably high in major countries, such as China and India, to deal with water scarcity.More than 60% of produced water comes from oilfields. Reusing produced water for reinjection in onshore and offshore operations is expected to propel the produced water treatment market CAGR during the forecast period.

    Additionally, increase in environmental policies and the growing concern for the water table in the Region with the scarcity of fresh water like China and India, the produced water treatment market is expected to swell in the upcoming years. With the extensive shale discoveries in the North American Region for which the water treatment services are of keen importance, the market is expected to soar in the forecasted years. The produced water treatment market is estimated to increase the Produced Water Treatment market revenue in the forecast period.

    The increasing regulatory pressures and environmental concerns surrounding water management are driving innovations in produced water treatment technologies, which are essential for sustainable resource management in the oil and gas sector.

    U.S. Environmental Protection Agency

    Produced Water Treatment Market Drivers

    Rising Water Scarcity

    Water scarcity is becoming an increasingly pressing issue globally, which is significantly influencing the Global Produced Water Treatment Market Industry. As freshwater resources dwindle, the demand for treated produced water as an alternative source for agricultural and industrial applications is rising. Regions such as the Middle East and North Africa are particularly affected, where water scarcity is acute. The potential for reusing treated produced water not only alleviates water shortages but also promotes sustainable water management practices. This trend is expected to contribute to the market's growth, with projections indicating a rise to 11.3 USD Billion by 2035, driven by the need for innovative water solutions.

    Market Growth Projections

    The Global Produced Water Treatment Market Industry is poised for substantial growth in the coming years. Projections indicate that the market will reach 6.6 USD Billion in 2024 and is expected to expand to 11.3 USD Billion by 2035. This growth trajectory suggests a compound annual growth rate of 5.05% from 2025 to 2035, driven by various factors including regulatory pressures, technological advancements, and increasing water scarcity. The market dynamics reflect a shift towards sustainable practices and innovative solutions in produced water management, indicating a robust future for the industry.

    Technological Advancements

    Technological advancements in produced water treatment processes are playing a crucial role in shaping the Global Produced Water Treatment Market Industry. Innovations such as membrane filtration, advanced oxidation processes, and zero-liquid discharge technologies are enhancing the efficiency and effectiveness of treatment methods. These technologies not only improve the quality of treated water but also reduce operational costs, making them attractive to operators in the oil and gas sector. As these technologies continue to evolve, they are likely to drive market growth, with a projected compound annual growth rate of 5.05% from 2025 to 2035, reflecting the industry's shift towards more efficient treatment solutions.

    Growing Oil and Gas Production

    The ongoing expansion of oil and gas production activities is a significant driver for the Global Produced Water Treatment Market Industry. As extraction rates increase, so does the volume of produced water generated, necessitating effective treatment solutions. Countries with substantial oil reserves, such as the United States and Saudi Arabia, are witnessing a surge in produced water generation, which in turn fuels the demand for treatment technologies. This trend is expected to sustain market growth, as operators seek to manage produced water responsibly and comply with environmental regulations. The market's trajectory is closely linked to the dynamics of the oil and gas sector, indicating a robust future.

    Increasing Regulatory Pressure

    The Global Produced Water Treatment Market Industry is experiencing heightened regulatory scrutiny aimed at minimizing environmental impacts associated with produced water disposal. Governments worldwide are implementing stricter regulations to ensure that produced water is treated effectively before discharge or reuse. For instance, the U.S. Environmental Protection Agency has established guidelines that mandate the treatment of produced water to meet specific quality standards. This regulatory landscape is likely to drive investments in advanced treatment technologies, thereby propelling market growth. As a result, the market is projected to reach 6.6 USD Billion in 2024, reflecting the urgent need for compliance and sustainable practices.

    Increased Investment in Water Reuse

    Investment in water reuse initiatives is gaining momentum within the Global Produced Water Treatment Market Industry. As industries and municipalities recognize the value of treated produced water, funding for advanced treatment facilities is increasing. This trend is particularly evident in regions facing severe water shortages, where treated produced water is being repurposed for irrigation, industrial processes, and even potable uses. The financial backing for such projects not only enhances the market landscape but also promotes sustainable practices. The growing emphasis on water reuse is likely to contribute to the market's expansion, aligning with global sustainability goals and resource management strategies.

    Market Segment Insights

    Produced Water Treatment Well Type Insights

    Get more detailed insights about Produced Water Treatment Market Research Report - Forecast to 2032

    Regional Insights

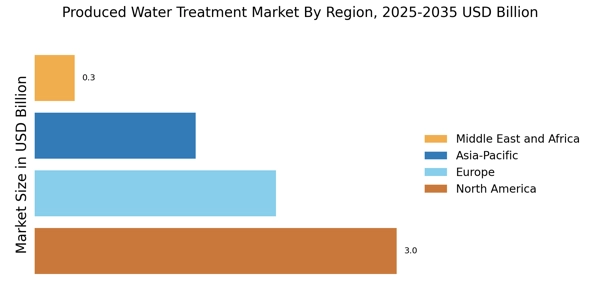
    By Region, the study provides market insights into North America, Europe, Asia-Pacific, and the Rest of the World. The North American produced water treatment market area will dominate this market, due to continuous and large increments in the U.S. exploration and production activities. The new and unconventional hydrocarbon recovery and its growth are important reasons for the growth of treatment services in this Region.

    Further, the major countries studied in the market report are The U.S., Canada, German, France, the UK, Italy, Spain, China, Japan, India, Australia, South Korea, and Brazil.

    Figure 2: Produced Water Treatment Market Share By Region 2022 (%)

    Produced Water Treatment Market Share By Region

    Source: Secondary Research, Primary Research, Market Research Future Database, and Analyst Review

    Europe Produced Water Treatment market accounts for the second-largest market share due to the stringent environmental regulations in the Region. Further, the German Produced Water Treatment market held the largest market share, and the UK Produced Water Treatment market was the fastest growing market in the European Region.

    The Asia-Pacific Produced Water Treatment Market is expected to grow at the fastest CAGR from 2023 to 2032. This is due to the increased development of new technology through innovation and onshore and offshore exploration activities. Moreover, China’s Produced Water Treatment market held the largest market share, and the Indian Produced Water Treatment market was the fastest-growing market in the Asia-Pacific region.

    Key Players and Competitive Insights

    Leading market players are investing heavily in research and development to expand their product lines, which will help the produced water treatment market grow even more. Market participants are also undertaking a variety of strategic activities to expand their footprint, with important market developments including new product launches, contractual agreements, mergers and acquisitions, higher investments, and collaboration with other organizations. To expand and survive in a more competitive and rising market climate, produced water treatment industry must offer cost-effective items.

    Manufacturing locally to minimize operational costs is one of the key business tactics manufacturers use in the globally Produced Water Treatment industry to benefit clients and increase the market sector. In recent years, the Produced Water Treatment industry has offered some of the most significant environmental advantages. 

    Major Produced Water Treatment market players, including Siemens AG, Aker Solutions, Alderley plc, Schlumberger Limited, CETCO Energy Services., and others, are attempting to increase market demand by investing in research and development operations.

    Ecolog International is a multinational company that uses technology and supply chain management to provide services for various industries, including energy, construction, facility management, and the environment. Ecology is headquartered in Dubai, United Arab Emirates.ECOLOG, a leading provider of integrated environmental services, technologies, and solutions, partnered with Siemens Energy to provide a service-oriented efficient disposal solution for the wastewater industry. This partnership will allow industrial wastewater treatment to be done locally.

    Cavitation Technologies, Inc. is a "Green-Tech" company, established in 2006 to become a world leader in the development and licensing of new cutting-edge technologies for the biodiesel, vegetable oil refining, renewable fuel, petroleum, water treatment, wastewater sanitation, petroleum, food and beverage, and chemical industries. 

    Cavitation Technologies' mission is to apply our technology to improve the world through renewable energy. Cavitation Technologies and SD Partners announced a partnership to promote sustainably produced water treatment to new industries. Sustainable Development Partners will help CTi commercialize new applications of its proprietary technology in produced water remediation using low-pressure nanoreactors (LPN).

    Key Companies in the Produced Water Treatment Market market include

    Industry Developments

    February 2021: The Egyptian Ministry of Petroleum and Schlumberger announced the launch of the Egypt Upstream Gateway, an innovative digital technology that will allow access to Egypt's subsurface data.

    March 2022: Cavitation Technologies and SD Partners announced a partnership to promote sustainably produced water treatment to new industries. Sustainable Development Partners will help CTi commercialize new applications of its proprietary technology in produced water remediation using low-pressure nanoreactors (LPN).

    Future Outlook

    Produced Water Treatment Market Future Outlook

    The Global Produced Water Treatment Market is projected to grow at a 5.05% CAGR from 2024 to 2035, driven by regulatory pressures, technological advancements, and increasing water scarcity.

    New opportunities lie in:

    • Invest in advanced membrane filtration technologies to enhance treatment efficiency.
    • Develop mobile treatment units for remote oil and gas operations.
    • Explore partnerships with municipalities for sustainable water reuse initiatives.

    By 2035, the market is expected to be robust, reflecting increased adoption of innovative treatment solutions.

    Market Segmentation

    Produced Water Treatment Outlook

    • Chemical
    • physical
    • Membrane

    Produced Water Treatment Regional Outlook

    North America
    • US
    • Canada

    Produced Water Treatment Well Type Outlook

    • Land
    • Offshore

    Report Scope

    Attribute/Metric Details
    Market Size 2023 USD 6.24 billion
    Market Size 2024 USD 6.60 billion
    Market Size 2032 USD 9.79 billion
    Compound Annual Growth Rate (CAGR) 5.05% (2024-2032)
    Base Year 2023
    Market Forecast Period 2024-2032
    Historical Data 2019- 2021
    Market Forecast Units Value (USD Billion)
    Report Coverage Revenue Forecast, Market Competitive Landscape, Growth Factors, and Trends
    Segments Covered Well Type, Treatment, and Region
    Geographies Covered North America, Europe, AsiaPacific, and the Rest of the World
    Countries Covered The U.S., Canada, German, France, the UK, Italy, Spain, China, Japan, India, Australia, South Korea, and Brazil
    Key Companies Profiled  Siemens AG, Aker Solutions, Alderley plc, Schlumberger Limited, CETCO Energy Services
    Key Market Opportunities ·         Increase in the onshore and offshore exploration activities
    Key Market Dynamics ·         Development of new technology through innovation

    Market Highlights

    Author
    Chitranshi Jaiswal
    Research Analyst Level I

    In her 3 years of experience in the market research field, she has handled critical cross-domain projects. She has an in-depth knowledge of market estimation & analysis, problem-solving, primary as well as secondary research, and team management.She holds an engineering degree and is an MBA professional from a well-known university, capable of evaluating the market and competitive conditions. An exceptional strategist with excellent communication skills and a passion for delivering cutting-edge & practical insights for the market. Proficient in multi-tasking, and can successfully deal with competing demands, while maintaining complete confidentiality. Generated business through active client and project development, networking, and high-quality responses. Her knowledge and skills have helped in making solid business decisions, securing funding from investors, and avoiding business failures.

    Leave a Comment

    FAQs

    How much is the Produced Water Treatment market?

    The Produced Water Treatment market size was valued at USD 6.24 Billion in 2023.

    What is the growth rate of the Produced Water Treatment market?

    The market is projected to grow at a CAGR of 5.05%during the forecast period, 2024-2032.

    Which Region held the largest market share in the Produced Water Treatment market?

    North America had the largest share of the market

    Who are the key players in the Produced Water Treatment market?

    The key players in the market areSiemens AG, Aker Solutions, Alderley plc, Schlumberger Limited, and CETCO Energy Services.

    Which Well Type led the Produced Water Treatment market?

    The Offshore Produced Water Treatment category dominated the market in 2022.

    Which Treatment had the largest market share in the Produced Water Treatment market?

    The physical had the largest share in the market.

    1. 'TABLE OF CONTENTS
    2. SECTION I: EXECUTIVE SUMMARY AND KEY HIGHLIGHTS
    3. EXECUTIVE’S HANDBOOK
      1. The Top Performing Segments
      2. Key Trends
    4. Summarized
      1. Strategic Insights
      2. Who are the Key Players in the
    5. Market?
    6. SECTION II: SCOPING, METHODOLOGY AND MARKET STRUCTURE
    7. MARKET INTRODUCTION
      1. Definition
      2. Report Segmentation & Scope
    8. Regional & Country Level Coverage
      1. Why you need this report?
    9. RESEARCH METHODOLOGY
      1. Research Process
      2. Secondary Research
        1. Data Mining & Condensation
        2. Sources (Associations, Organizations,
    10. Magazines, Paid Databases)
      1. Primary Research
        1. Sample Size (Demand-Supply,
    11. Company Treatment, Designations, Region)
      1. Sources
      2. Factorial
    12. Analysis & Approach Setting
      1. Estimation & Forecast Models
    13. Pricing Baskets
      1. Analyst Hours & Team
    14. SECTION III: QUALITATIVE
    15. ANALYSIS
    16. MARKET DYNAMICS
      1. Introduction
      2. Growth Parameters
    17. Mapped - Drivers
      1. Innovations in treatment methods
        1. Trend
    18. toward reusing treated water
      1. What are the challenges faced by Industry
    19. Participants?
      1. High treatment costs
      2. Opportunities
    20. Increase in the onshore and offshore exploration activities
      1. Regulatory
    21. Update
      1. Impact Analysis of COVID-19
        1. Impact on Supply Chain
    22. of Produced Water Treatment
      1. Impact on Market Demand of Produced Water
    23. Treatment
    24. MARKET FACTOR ANALYSIS
      1. Supply/Value Chain Analysis
        1. Participants
        2. Value Percolation Across the Chain
    25. Integration Levels
      1. Key Issues Addressed
      2. Porter’s Five
    26. Forces Model
      1. Bargaining Power of Suppliers
        1. Bargaining Power
    27. of Buyers
      1. Threat of New Entrants
        1. Threat of Substitutes
        2. Intensity of Rivalry
    28. SECTION IV: QUANTITATIVE ANALYSIS
    29. GLOBAL
    30. PRODUCED WATER TREATMENT MARKET, BY TREATMENT (USD MILLION)
      1. Introduction
      2. Chemical
        1. Global Produced Water Treatment Market Size: Market
    31. Estimates & Forecast, By Chemical, 2018-2032
      1. Physical
    32. Global Produced Water Treatment Market Size: Market Estimates & Forecast, By
    33. Physical, 2018-2032
      1. Membrane
        1. Global Produced Water Treatment
    34. Market Size: Market Estimates & Forecast, By Membrane, 2018-2032
      1. Others
        1. Global Produced Water Treatment Market Size: Market Estimates & Forecast,
    35. By Others, 2018-2032
    36. GLOBAL PRODUCED WATER TREATMENT MARKET, BY WELL TYPE
    37. (USD MILLION)
      1. Introduction
      2. Onshore
        1. Global Produced
    38. Water Treatment Market Size: Market Estimates & Forecast, By Onshore, 2018-2032
      1. Offshore
        1. Global Produced Water Treatment Market Size: Market
    39. Estimates & Forecast, By Offshore, 2018-2032
    40. GLOBAL PRODUCED WATER TREATMENT
    41. MARKET, BY REGION (USD MILLION)
      1. Introduction
      2. North America
        1. North America Produced Water Treatment Market Size: Market Estimates &
    42. Forecast, By Country, 2018-2032
      1. North America Produced Water Treatment
    43. Market Size: Market Estimates & Forecast, By Treatment, 2018-2032
    44. North America Produced Water Treatment Market Size: Market Estimates & Forecast,
    45. By Well Type, 2018-2032
      1. US
        1. US Produced Water Treatment
    46. Market Size: Market Estimates & Forecast, By Treatment, 2018-2032
    47. US Produced Water Treatment Market Size: Market Estimates & Forecast, By Well
    48. Type, 2018-2032
      1. Canada
        1. Canada Produced Water Treatment
    49. Market Size: Market Estimates & Forecast, By Treatment, 2018-2032
    50. Canada Produced Water Treatment Market Size: Market Estimates & Forecast, By
    51. Well Type, 2018-2032
      1. Mexico
        1. Mexico Produced Water Treatment
    52. Market Size: Market Estimates & Forecast, By Treatment, 2018-2032
    53. Mexico Produced Water Treatment Market Size: Market Estimates & Forecast, By
    54. Well Type, 2018-2032
      1. Europe
        1. Europe Produced Water Treatment
    55. Market Size: Market Estimates & Forecast, By Country, 2018-2032
    56. Europe Produced Water Treatment Market Size: Market Estimates & Forecast, By
    57. Treatment, 2018-2032
      1. Europe Produced Water Treatment Market Size: Market
    58. Estimates & Forecast, By Well Type, 2018-2032
      1. Germany
    59. Germany Produced Water Treatment Market Size: Market Estimates & Forecast, By
    60. Treatment, 2018-2032
      1. Germany Produced Water Treatment Market Size:
    61. Market Estimates & Forecast, By Well Type, 2018-2032
      1. France
    62. France Produced Water Treatment Market Size: Market Estimates & Forecast, By
    63. Treatment, 2018-2032
      1. France Produced Water Treatment Market Size:
    64. Market Estimates & Forecast, By Well Type, 2018-2032
      1. UK
    65. UK Produced Water Treatment Market Size: Market Estimates & Forecast, By Treatment,
      1. UK Produced Water Treatment Market Size: Market Estimates
    66. & Forecast, By Well Type, 2018-2032
      1. Spain
        1. Spain Produced
    67. Water Treatment Market Size: Market Estimates & Forecast, By Treatment, 2018-2032
      1. Spain Produced Water Treatment Market Size: Market Estimates & Forecast,
    68. By Well Type, 2018-2032
      1. Italy
        1. Italy Produced Water Treatment
    69. Market Size: Market Estimates & Forecast, By Treatment, 2018-2032
    70. Italy Produced Water Treatment Market Size: Market Estimates & Forecast, By
    71. Well Type, 2018-2032
      1. Rest of Europe
        1. Rest of Europe Produced
    72. Water Treatment Market Size: Market Estimates & Forecast, By Country, 2018-2032
      1. Rest of Europe Produced Water Treatment Market Size: Market Estimates
    73. & Forecast, By Treatment, 2018-2032
      1. Rest of Europe Produced Water
    74. Treatment Market Size: Market Estimates & Forecast, By Well Type, 2018-2032
      1. Asia-Pacific
        1. Asia-Pacific Produced Water Treatment Market Size:
    75. Market Estimates & Forecast, By Country, 2018-2032
      1. Asia-Pacific
    76. Produced Water Treatment Market Size: Market Estimates & Forecast, By Treatment,
      1. Asia-Pacific Produced Water Treatment Market Size: Market
    77. Estimates & Forecast, By Well Type, 2018-2032
      1. China
    78. China Produced Water Treatment Market Size: Market Estimates & Forecast, By
    79. Treatment, 2018-2032
      1. China Produced Water Treatment Market Size: Market
    80. Estimates & Forecast, By Well Type, 2018-2032
      1. India
    81. India Produced Water Treatment Market Size: Market Estimates & Forecast, By
    82. Treatment, 2018-2032
      1. India Produced Water Treatment Market Size: Market
    83. Estimates & Forecast, By Well Type, 2018-2032
      1. Japan
    84. Japan Produced Water Treatment Market Size: Market Estimates & Forecast, By
    85. Treatment, 2018-2032
      1. Japan Produced Water Treatment Market Size: Market
    86. Estimates & Forecast, By Well Type, 2018-2032
      1. South Korea
    87. South Korea Produced Water Treatment Market Size: Market Estimates & Forecast,
    88. By Treatment, 2018-2032
      1. South Korea Produced Water Treatment Market
    89. Size: Market Estimates & Forecast, By Well Type, 2018-2032
      1. Rest
    90. of Asia-Pacific
      1. Rest of Asia-Pacific Produced Water Treatment Market
    91. Size: Market Estimates & Forecast, By Country, 2018-2032
      1. Rest
    92. of Asia-Pacific Produced Water Treatment Market Size: Market Estimates & Forecast,
    93. By Treatment, 2018-2032
      1. Rest of Asia-Pacific Produced Water Treatment
    94. Market Size: Market Estimates & Forecast, By Well Type, 2018-2032
    95. Middle East & Africa
      1. Middle East & Africa Produced Water Treatment
    96. Market Size: Market Estimates & Forecast, By Country, 2018-2032
    97. Middle East & Africa Produced Water Treatment Market Size: Market Estimates
    98. & Forecast, By Treatment, 2018-2032
      1. Middle East & Africa Produced
    99. Water Treatment Market Size: Market Estimates & Forecast, By Well Type, 2018-2032
      1. GCC Countries
        1. GCC Countries Produced Water Treatment Market
    100. Size: Market Estimates & Forecast, By Treatment, 2018-2032
      1. GCC
    101. Countries Produced Water Treatment Market Size: Market Estimates & Forecast,
    102. By Well Type, 2018-2032
      1. South Africa
        1. South Africa Produced
    103. Water Treatment Market Size: Market Estimates & Forecast, By Treatment, 2018-2032
      1. South Africa Produced Water Treatment Market Size: Market Estimates &
    104. Forecast, By Well Type, 2018-2032
      1. Rest of Middle East & Africa
        1. Rest of Middle East & Africa Produced Water Treatment Market Size:
    105. Market Estimates & Forecast, By Country, 2018-2032
      1. Rest of Middle
    106. East & Africa Produced Water Treatment Market Size: Market Estimates & Forecast,
    107. By Treatment, 2018-2032
      1. Rest of Middle East & Africa Produced
    108. Water Treatment Market Size: Market Estimates & Forecast, By Well Type, 2018-2032
      1. South America
        1. South America Produced Water Treatment Market Size:
    109. Market Estimates & Forecast, By Country, 2018-2032
      1. South America
    110. Produced Water Treatment Market Size: Market Estimates & Forecast, By Treatment,
      1. South America Produced Water Treatment Market Size: Market
    111. Estimates & Forecast, By Well Type, 2018-2032
      1. Brazil
    112. Brazil Produced Water Treatment Market Size: Market Estimates & Forecast, By
    113. Treatment, 2018-2032
      1. Brazil Produced Water Treatment Market Size:
    114. Market Estimates & Forecast, By Well Type, 2018-2032
      1. Argentina
        1. Argentina Produced Water Treatment Market Size: Market Estimates &
    115. Forecast, By Treatment, 2018-2032
      1. Argentina Produced Water Treatment
    116. Market Size: Market Estimates & Forecast, By Well Type, 2018-2032
    117. Rest of South America
      1. Rest of South America Produced Water Treatment
    118. Market Size: Market Estimates & Forecast, By Country, 2018-2032
    119. Rest of South America Produced Water Treatment Market Size: Market Estimates &
    120. Forecast, By Treatment, 2018-2032
      1. Rest of South America Produced Water
    121. Treatment Market Size: Market Estimates & Forecast, By Well Type, 2018-2032
    122. SECTION V: COMPETITIVE ANALYSIS
    123. COMPETITIVE LANDSCAPE
      1. Introduction
      2. Competition Dashboard
      3. Company Market Share Analysis, 2023
    124. Who are the market disruptors & innovators?
      1. What strategies are being
    125. adopted by market leaders?
      1. Competitive Benchmarking
      2. The Leading
    126. Player in terms of Number of Developments in the Global Produced Water Treatment
    127. Market
      1. List of Key Players, By Region
      2. Comparative Analysis:
    128. Key Players Financial
      1. Key Developments & Growth Strategies
    129. New Product Launch/Service Deployment
      1. Merger & Acquisition
    130. Joint Ventures
    131. COMPANY PROFILES
      1. Siemens AG
        1. Company
    132. Overview
      1. Financial Overview
        1. Product Offered
    133. Key Developments
      1. SWOT Analysis
        1. Key Strategies
    134. Aker Solutions
      1. Company Overview
        1. Financial Overview
        2. Product Offered
        3. Key Developments
        4. SWOT Analysis
        5. Key Strategies
      2. Schlumberger
        1. Company Overview
        2. Financial Overview
        3. Product Offered
        4. Key Developments
        5. SWOT Analysis
        6. Key Strategies
      3. CETCO Energy Services
        1. Company Overview
        2. Financial Overview
        3. Product
    135. Offered
      1. Key Developments
        1. SWOT Analysis
        2. Key
    136. Strategies
      1. Alderley plc
        1. Company Overview
        2. Financial
    137. Overview
      1. Product Offered
        1. Key Developments
    138. SWOT Analysis
      1. Key Strategies
      2. Veolia
        1. Company
    139. Overview
      1. Financial Overview
        1. Product Offered
    140. Key Developments
      1. SWOT Analysis
        1. Key Strategies
    141. IDE Technologies
      1. Company Overview
        1. Financial Overview
        2. Product Offered
        3. Key Developments
        4. SWOT Analysis
        5. Key Strategies
      2. Halliburton
        1. Company Overview
        2. Financial Overview
        3. Product Offered
        4. Key Developments
        5. SWOT Analysis
        6. Key Strategies
      3. TechnipFMC plc
        1. Company Overview
        2. Financial Overview
        3. Product
    142. Offered
      1. Key Developments
        1. SWOT Analysis
        2. Key
    143. Strategies
      1. Ecolab
        1. Company Overview
        2. Financial
    144. Overview
      1. Product Offered
        1. Key Developments
    145. SWOT Analysis
      1. Key Strategies
    146. RECOMMENDATIONS & EXPERT
    147. INSIGHTS
      1. What is the short-term vs long-term outlook for Produced Water
    148. Treatment Market?
      1. Who are the players to look out for?
      2. What
    149. will the product mix look in coming years?
    150. MRFR OFFERINGS & TEAM
      1. Citations & Media
      2. Our Regional Representatives
    151. Related Reports
      1. Our Domain Coverage
    152. NOTE:
    153. This table
    154. of content is tentative and subject to change as the research progresses.
    155. In section 10, each company will be profiled based on the Market Overview, Financials,
    156. Product Portfolio, Business Strategies, and Recent Developments parameters.
    157. Please note: The financial details of the company cannot be provided if the information
    158. is not available in the public domain and or from reliable sources.
    159. WATER TREATMENT MARKET ESTIMATES & FORECAST, BY TREATMENT, 2018-2032 (USD MILLION)
    160. TYPE, 2018-2032 (USD MILLION)
    161. BY REGION, 2018-2032 (USD MILLION)
    162. MARKET, BY COUNTRY, 2018-2032 (USD MILLION)
    163. WATER TREATMENT MARKET, BY TREATMENT, 2018-2032 (USD MILLION)
    164. AMERICA: PRODUCED WATER TREATMENT MARKET, BY WELL TYPE, 2018-2032 (USD MILLION
    165. MILLION)
    166. (USD MILLION)
    167. 2032 (USD MILLION)
    168. BY WELL TYPE, 2018-2032 (USD MILLION)
    169. MARKET, BY COUNTRY, 2018-2032 (USD MILLION)
    170. TREATMENT MARKET, BY TREATMENT, 2018-2032 (USD MILLION)
    171. WATER TREATMENT MARKET, BY WELL TYPE, 2018-2032 (USD MILLION)
    172. PRODUCED WATER TREATMENT MARKET, BY TREATMENT, 2018-2032 (USD MILLION)
    173. GERMANY: PRODUCED WATER TREATMENT MARKET, BY WELL TYPE, 2018-2032 (USD MILLION)
    174. MILLION)
    175. (USD MILLION)
    176. 2032 (USD MILLION)
    177. TYPE, 2018-2032 (USD MILLION)
    178. BY TREATMENT, 2018-2032 (USD MILLION)
    179. MARKET, BY WELL TYPE, 2018-2032 (USD MILLION)
    180. TREATMENT MARKET, BY TREATMENT, 2018-2032 (USD MILLION)
    181. WATER TREATMENT MARKET, BY WELL TYPE, 2018-2032 (USD MILLION)
    182. OF EUROPE: PRODUCED WATER TREATMENT MARKET, BY COUNTRY, 2018-2032 (USD MILLION)
    183. (USD MILLION)
    184. WELL TYPE, 2018-2032 (USD MILLION)
    185. MARKET, BY COUNTRY, 2018-2032 (USD MILLION)
    186. WATER TREATMENT MARKET, BY TREATMENT, 2018-2032 (USD MILLION)
    187. PACIFIC: PRODUCED WATER TREATMENT MARKET, BY WELL TYPE, 2018-2032 (USD MILLION)
    188. MILLION)
    189. (USD MILLION)
    190. 2032 (USD MILLION)
    191. WELL TYPE, 2018-2032 (USD MILLION)
    192. MARKET, BY TREATMENT, 2018-2032 (USD MILLION)
    193. TREATMENT MARKET, BY WELL TYPE, 2018-2032 (USD MILLION)
    194. PRODUCED WATER TREATMENT MARKET, BY TREATMENT, 2018-2032 (USD MILLION)
    195. SOUTH KOREA: PRODUCED WATER TREATMENT MARKET, BY WELL TYPE, 2018-2032 (USD MILLION)
    196. (USD MILLION)
    197. BY TREATMENT, 2018-2032 (USD MILLION)
    198. WATER TREATMENT MARKET, BY WELL TYPE, 2018-2032 (USD MILLION)
    199. EAST & AFRICA: PRODUCED WATER TREATMENT MARKET, BY COUNTRY, 2018-2032 (USD MILLION)
    200. 2032 (USD MILLION)
    201. TREATMENT MARKET, BY WELL TYPE, 2018-2032 (USD MILLION)
    202. PRODUCED WATER TREATMENT MARKET, BY TREATMENT, 2018-2032 (USD MILLION)
    203. GCC COUNTRIES: PRODUCED WATER TREATMENT MARKET, BY WELL TYPE, 2018-2032 (USD
    204. MILLION)
    205. 2032 (USD MILLION)
    206. BY WELL TYPE, 2018-2032 (USD MILLION)
    207. PRODUCED WATER TREATMENT MARKET, BY COUNTRY, 2018-2032 (USD MILLION)
    208. REST OF MIDDLE EAST & AFRICA: PRODUCED WATER TREATMENT MARKET, BY TREATMENT,
    209. 2032 (USD MILLION)
    210. WATER TREATMENT MARKET, BY WELL TYPE, 2018-2032 (USD MILLION)
    211. AMERICA: PRODUCED WATER TREATMENT MARKET, BY COUNTRY, 2018-2032 (USD MILLION)
    212. (USD MILLION)
    213. WELL TYPE, 2018-2032 (USD MILLION)
    214. MARKET, BY TREATMENT, 2018-2032 (USD MILLION)
    215. TREATMENT MARKET, BY WELL TYPE, 2018-2032 (USD MILLION)
    216. PRODUCED WATER TREATMENT MARKET, BY TREATMENT, 2018-2032 (USD MILLION)
    217. ARGENTINA: PRODUCED WATER TREATMENT MARKET, BY WELL TYPE, 2018-2032 (USD MILLION)
    218. 2032 (USD MILLION)
    219. MARKET, BY TREATMENT, 2018-2032 (USD MILLION)
    220. PRODUCED WATER TREATMENT MARKET, BY WELL TYPE, 2018-2032 (USD MILLION)
    221. ATTRACTIVENESS ANALYSIS: GLOBAL PRODUCED WATER TREATMENT MARKET
    222. PRODUCED WATER TREATMENT MARKET ANALYSIS BY TREATMENT
    223. WATER TREATMENT MARKET ANALYSIS BY WELL TYPE
    224. TREATMENT MARKET ANALYSIS BY REGION
    225. MARKET: MARKET STRUCTURE
    226. & MARKET SHARE BY COUNTRY (2024 VS 2032)
    227. & MARKET SHARE BY COUNTRY (2024 VS 2032)
    228. MARKET SHARE BY COUNTRY (2024 VS 2032)
    229. MARKET SIZE & MARKET SHARE BY COUNTRY (2024 VS 2032)
    230. MARKET SIZE & MARKET SHARE BY COUNTRY (2024 VS 2032)
    231. OF GLOBAL PRODUCED WATER TREATMENT MARKET
    232. PRODUCED WATER TREATMENT MARKET
    233. WATER TREATMENT MARKET
    234. TREATMENT MARKET
    235. (% SHARE)
    236. TO 2032 (USD MILLION)
    237. BY WELL TYPE, 2023 (% SHARE)
    238. BY WELL TYPE, 2024 TO 2032 (USD MILLION)'

    Produced Water Treatment Market Segmentation Tab:

    Produced Water Treatment Well Type Outlook (USD Billion, 2019-2032)

    • Land
    • Offshore

    Produced Water Treatment Outlook (USD Billion, 2019-2032)

    • Chemical
    • Physical
    • Membrane

    Produced Water Treatment Regional Outlook (USD Billion, 2019-2032)

    • North America Outlook (USD Billion, 2019-2032)

      • North America Produced Water Treatment by Well Type
        • Land
        • Offshore
      • North America Produced Water Treatment by Treatment
        • Chemical
        • Physical
        • Membrane
      • USOutlook (USD Billion, 2019-2032)

      • US Produced Water Treatment by Well Type
        • Land
        • Offshore
      • US Produced Water Treatment by Treatment
        • Chemical
        • Physical
        • Membrane
      • CANADA Outlook (USD Billion, 2019-2032)

      • CANADA Produced Water Treatment by Well Type
        • Land
        • Offshore
      • CANADA Produced Water Treatment by Treatment
        • Chemical
        • Physical
        • Membrane
    • Europe Outlook (USD Billion, 2019-2032)

      • Europe Produced Water Treatment by Well Type
        • Land
        • Offshore
      • Europe Produced Water Treatment by Treatment
        • Chemical
        • Physical
        • Membrane
      • GermanyOutlook (USD Billion, 2019-2032)

      • Germany Produced Water Treatment by Well Type
        • Land
        • Offshore
      • Germany Produced Water Treatment by Treatment
        • Chemical
        • Physical
        • Membrane
      • FranceOutlook (USD Billion, 2019-2032)

      • France Produced Water Treatment by Well Type
        • Land
        • Offshore
      • France Produced Water Treatment by Treatment
        • Chemical
        • Physical
        • Membrane
      • UKOutlook (USD Billion, 2019-2032)

      • UK Produced Water Treatment by Well Type
        • Land
        • Offshore
      • UK Produced Water Treatment by Treatment
        • Chemical
        • Physical
        • Membrane
      • ITALY Outlook (USD Billion, 2019-2032)

      • ITALY Produced Water Treatment by Well Type
        • Land
        • Offshore
      • ITALY Produced Water Treatment by Treatment
        • Chemical
        • Physical
        • Membrane
      • SPAINOutlook (USD Billion, 2019-2032)

      • Spain Produced Water Treatment by Well Type
        • Land
        • Offshore
      • Spain Produced Water Treatment by Treatment
        • Chemical
        • Physical
        • Membrane
      • Rest Of EuropeOutlook (USD Billion, 2019-2032)

      • Rest Of Europe Produced Water Treatment by Well Type
        • Land
        • Offshore
      • REST OF EUROPE Produced Water Treatment by Treatment
        • Chemical
        • Physical
        • Membrane
    • Asia-PacificOutlook (USD Billion, 2019-2032)

      • Asia-Pacific Produced Water Treatment by Well Type
        • Land
        • Offshore
      • Asia-Pacific Produced Water Treatment by Treatment
        • Chemical
        • Physical
        • Membrane
      • ChinaOutlook (USD Billion, 2019-2032)

      • China Produced Water Treatment by Well Type
        • Land
        • Offshore
      • China Produced Water Treatment by Treatment
        • Chemical
        • Physical
        • Membrane
      • JapanOutlook (USD Billion, 2019-2032)

      • Japan Produced Water Treatment by Well Type
        • Land
        • Offshore
      • Japan Produced Water Treatment by Treatment
        • Chemical
        • Physical
        • Membrane
      • India Outlook (USD Billion, 2019-2032)

      • India Produced Water Treatment by Well Type
        • Land
        • Offshore
      • India Produced Water Treatment by Treatment
        • Chemical
        • Physical
        • Membrane
      • AustraliaOutlook (USD Billion, 2019-2032)

      • Australia Produced Water Treatment by Well Type
        • Land
        • Offshore
      • Australia Produced Water Treatment by Treatment
        • Chemical
        • Physical
        • Membrane
      • Rest of Asia-PacificOutlook (USD Billion, 2019-2032)

      • Rest of Asia-Pacific Produced Water Treatment by Well Type
        • Land
        • Offshore
      • Rest of Asia-Pacific Produced Water Treatment by Treatment
        • Chemical
        • Physical
        • Membrane
    • Rest of the WorldOutlook (USD Billion, 2019-2032)

      • Rest of the World Produced Water Treatment by Well Type
        • Land
        • Offshore
      • Rest of the World Produced Water Treatment by Treatment
        • Chemical
        • Physical
        • Membrane
      • Middle EastOutlook (USD Billion, 2019-2032)

      • Middle East Produced Water Treatment by Well Type
        • Land
        • Offshore
      • Middle East Produced Water Treatment by Treatment
        • Chemical
        • Physical
        • Membrane
      • AfricaOutlook (USD Billion, 2019-2032)

      • Africa Produced Water Treatment by Well Type
        • Land
        • Offshore
      • Africa Produced Water Treatment by Treatment
        • Chemical
        • Physical
        • Membrane
      • Latin AmericaOutlook (USD Billion, 2019-2032)

      • Latin America Produced Water Treatment by Well Type
        • Land
        • Offshore
      • Latin America Produced Water Treatment by Treatment
        • Chemical
        • Physical
        • Membrane
    Produced Water Treatment Market Research Report - Forecast to 2032 Infographic
    Free Sample Request

    Kindly complete the form below to receive a free sample of this Report

    Customer Strories

    “I am very pleased with how market segments have been defined in a relevant way for my purposes (such as "Portable Freezers & refrigerators" and "last-mile"). In general the report is well structured. Thanks very much for your efforts.”

    Victoria Milne Founder
    Case Study

    Chemicals and Materials