• Cat-intel
  • MedIntelliX
  • Resources
  • About Us
  • Request Free Sample ×

    Kindly complete the form below to receive a free sample of this Report

    Leading companies partner with us for data-driven Insights

    clients tt-cursor

    Water Treatment Systems Market

    ID: MRFR/CnM/1039-HCR
    111 Pages
    Chitranshi Jaiswal
    September 2025

    Water Treatment Systems Point of Entry Market Research Report: By Technology (Membrane Filtration, Granular Activated Carbon (GAC), Ion Exchange, Ultraviolet (UV) Disinfection, Distillation), By Application (Residential, Commercial, Industrial, Municipal), By Contaminant Removal (Chlorine, Fluoride, Heavy Metals, Bacteria, Viruses), By Capacity (= 100,000 liters per day (LPD), 100,000 - 500,000 LPD, 500,000 - 1,000,000 LPD, > 1,000,000 LPD), By Installation Type (Under-sink, Whole-house, Commercial, Industrial) and By Regional (North Amer...

    Share:
    Download PDF ×

    We do not share your information with anyone. However, we may send you emails based on your report interest from time to time. You may contact us at any time to opt-out.

    Global Water Treatment Systems (Point of Entry)  Market Research Report - Forecast to 2034 Infographic
    Purchase Options
    $ 4,950.0
    $ 5,950
    $ 7,250.0
    Table of Contents

    Water Treatment Systems Market Summary

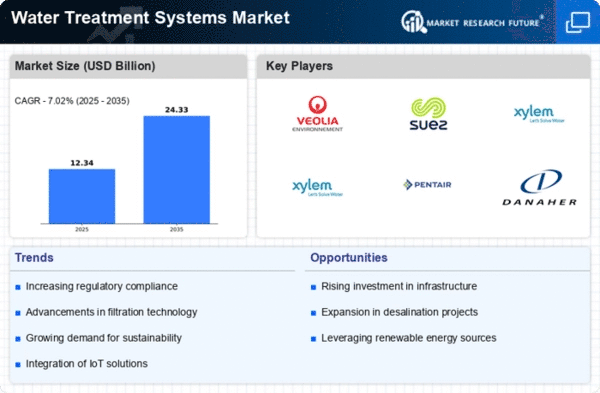
    As per Market Research Future Analysis, the Global Water Treatment Systems Point Of Entry Market is projected to grow from USD 12.34 Billion in 2025 to USD 22.73 Billion by 2034, with a CAGR of approximately 7.0% during the forecast period. The market was valued at USD 10.07 Billion in 2023 and is expected to reach USD 18.5 Billion by 2032. Key drivers include increasing consumer awareness of water quality, stringent government regulations, and technological advancements in water treatment solutions.

    Key Market Trends & Highlights

    The Water Treatment Systems Point Of Entry Market is witnessing significant trends driven by health and environmental concerns.

    • Market Size in 2023: USD 10.07 Billion; projected to grow to USD 18.5 Billion by 2032.
    • CAGR from 2024 to 2032: 7.0%; indicating robust growth potential.
    • Over 2 billion people lack access to safe drinking water, driving demand for treatment systems.
    • North America market valuation in 2023: USD 3.5 Billion; expected to reach USD 6.5 Billion by 2032.

    Market Size & Forecast

    2023 Market Size USD 10.07 Billion
    2032 Market Size USD 18.5 Billion
    CAGR 7.0%

    Major Players

    Key players include Culligan International, Pentair, 3M, LG Electronics, and A. O. Smith Corporation.

    Water Treatment Systems Market Trends

    Water Treatment Systems Point of Entry Market trends are increasingly driven by rising consumer awareness about water quality and health concerns. Growing urban populations and industrialization contribute to water contamination, fueling the demand for effective water purification solutions. Advanced technologies like reverse osmosis, ultraviolet disinfection, and activated carbon filtration are gaining traction due to their superior water quality improvement capabilities.Key market drivers include stringent government regulations, increasing water scarcity, and a growing focus on sustainability.

    Opportunities exist in developing regions with limited access to clean water, as well as in industries seeking to reduce operational costs and environmental impact through water treatment. Recent trends include the integration of smart home technology for remote monitoring and control, and the adoption of eco-friendly materials and processes in water treatment systems. 

    Source: Primary Research, Secondary Research, Market Research Future Database and Analyst Review

    The increasing focus on water quality and safety is driving the adoption of advanced point-of-entry water treatment systems, which are essential for ensuring clean and safe drinking water across diverse populations.

    U.S. Environmental Protection Agency (EPA)

    Water Treatment Systems Market Drivers

    Increasing Water Quality Standards

    The Global Water Treatment Systems Point Of Entry Market Industry is experiencing a surge in demand driven by the rising water quality standards set by governments worldwide. Regulatory bodies are increasingly enforcing stringent guidelines to ensure safe drinking water, which necessitates the adoption of advanced water treatment systems. For instance, the U.S. Environmental Protection Agency has established regulations that require municipalities to improve water quality, thereby boosting the market for point-of-entry systems. This trend is expected to contribute significantly to the market's growth, with projections indicating a market value of 11.5 USD Billion in 2024.

    Market Segment Insights

    Water Treatment Systems Point of Entry Market Segment Insights

    Water Treatment Systems Point of Entry Market Segment Insights

    Water Treatment Systems Point of Entry Market Technology Insights

    Water Treatment Systems Point of Entry Market Technology Insights

    The Water Treatment Systems Point of Entry Market revenue is a significant aspect of the overall water treatment industry, projected to be valued at 10.07 USD Billion in 2023 and growing to 18.5 USD Billion by 2032. This segment is supported by a robust expected compound annual growth rate (CAGR) of 7.0 between 2024 and 2032.

    A critical component of this market is the technology employed for water treatment systems, which includes various methods such as Membrane Filtration, Granular Activated Carbon (GAC), Ion Exchange, Ultraviolet (UV) Disinfection, and Distillation.Membrane Filtration stands out as a major segment within this market, valued at 3.5 USD Billion in 2023 and anticipated to grow to 6.2 USD Billion by 2032, indicating its dominance in the market due to its efficiency in removing impurities and contaminants from water.

    Granular Activated Carbon (GAC) technology also plays a significant role, starting with a valuation of 2.2 USD Billion in 2023, projected to rise to 4.0 USD Billion by 2032. Its adsorption capabilities are essential for addressing water quality concerns, making it a widely used method among consumers.Ion Exchange technology, valued at 1.7 USD Billion in 2023 and expected to reach 3.0 USD Billion by 2032, is crucial for softening water and removing unwanted ions, contributing to improved water quality for various applications.

    Ultraviolet (UV) Disinfection, which holds a valuation of 1.27 USD Billion in 2023 and is set to grow to 2.3 USD Billion by 2032, is increasingly recognized for its environmentally friendly approach to disinfecting water without the use of chemicals, expanding its usage in residential and commercial systems.

    Water Treatment Systems Point of Entry Market Application Insights

    Water Treatment Systems Point of Entry Market Application Insights

    The Water Treatment Systems Point of Entry Market is expected to experience significant growth, reaching a valuation of 10.07 USD Billion in 2023 and projected to grow to 18.5 USD Billion by 2032. This growth is driven by rising awareness of water quality and the importance of water treatment solutions across various applications. Within the market, key categories such as Residential, Commercial, Industrial, and Municipal sectors play a crucial role.

    The Residential segment is especially significant as it addresses the increasing demand for clean drinking water in households, prompting various households to invest in point-of-entry systems.The Commercial segment reflects a growing emphasis on water quality in businesses, enhancing customer satisfaction and compliance with health regulations. The Industrial applications benefit from enhanced water processing operations and efficiency, attracting investments in advanced treatment technologies. Additionally, Municipal systems are essential for safeguarding public health and improving water supply infrastructure, making them a dominant player in the market.

    Overall, the Water Treatment Systems Point of Entry Market segmentation highlights the importance of these applications in addressing water quality challenges in diverse settings while contributing to market growth and evolution.

    Water Treatment Systems Point of Entry Market Contaminant Removal Insights

    Water Treatment Systems Point of Entry Market Contaminant Removal Insights

    The Water Treatment Systems Point of Entry Market, particularly in the realm of Contaminant Removal, demonstrates significant growth and development. In 2023, the market value reached 10.07 billion USD, exhibiting a robust interest in the purification of drinking water. Within this segment, the removal of contaminants such as chlorine and fluoride is essential as these are common disinfection agents and pollutants that can affect health when consumed at elevated levels.

    Heavy metals pose a considerable risk due to their toxicity and long-term environmental impact, highlighting the importance of effective removal technologies.Moreover, the presence of bacteria and viruses in water systems underscores the need for advanced treatment solutions to ensure safe water for consumption. As awareness regarding water quality issues increases, the demand for effective treatment systems focusing on these contaminants continues to grow. This trend points toward a more significant need for innovative technologies in the Water Treatment Systems Point of Entry Market, highlighting opportunities for investment and development in this critical industry segment.

    Water Treatment Systems Point of Entry Market Capacity Insights

    Water Treatment Systems Point of Entry Market Capacity Insights

    The Water Treatment Systems Point of Entry Market is experiencing noteworthy growth, with a market valuation of 10.07 USD Billion in 2023 expected to rise significantly. The capacity segment plays a crucial role in this landscape, with various capacities catering to different consumer needs and industrial requirements. Markets focused on capacities of less than or equal to 100,000 liters per day hold a considerable share, addressing the growing demand for residential and small-scale commercial applications.

    Subsequently, the capacity range of 100,000 to 500,000 LPD is gaining momentum, driven by mid-sized facilities needing efficient water treatment solutions.Furthermore, the 500,000 to 1,000,000 LPD capacity is becoming increasingly important in industries where larger volumes of treated water are essential, such as agriculture and food processing. The segment exceeding 1,000,000 LPD showcases remarkable growth potential due to its applicability in large-scale industrial operations and municipal water systems, emphasizing the importance of reliable and efficient water treatment solutions to ensure regulatory compliance and sustainable practices.

    This diverse capacity segmentation presents significant opportunities and challenges, enabling targeted innovations and fostering competition in the Water Treatment Systems Point of Entry Market.

    Water Treatment Systems Point of Entry Market Installation Type Insights

    Water Treatment Systems Point of Entry Market Installation Type Insights

    The Water Treatment Systems Point of Entry Market is projected to achieve a valuation of 10.07 USD Billion in 2023, with significant growth expected as it progresses towards 18.5 USD Billion by 2032. This category encompasses various installation types, where the market shows considerable interest in options like Under-sink and Whole-house systems, which cater to residential needs, offering convenience and improved water quality.

    The Commercial and Industrial segments are also noteworthy, providing scalable solutions for businesses and larger operations that require robust water treatment systems for operational efficiency.The rising demand for clean and safe water, coupled with increasing regulatory standards, fuels the growth of these installation types in the market. Additionally, consumer awareness about waterborne diseases and the environmental impact of untreated water systems further drives acceptance and adoption of effective treatment solutions.

    The evolving technology and innovations within these categories allow for better performance and easier integration, thus enhancing the attractiveness of this segment in the Water Treatment Systems Point of Entry Market landscape.

    Get more detailed insights about Global Water Treatment Systems (Point of Entry) Market Research Report - Forecast to 2034

    Regional Insights

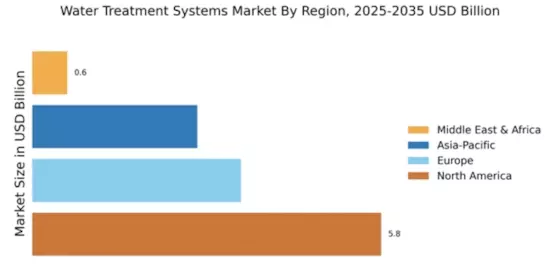
    The Water Treatment Systems Point of Entry Market is experiencing robust growth across various regions, with the total market valued at 10.07 USD Billion in 2023 and projected to reach 18.5 USD Billion by 2032. North America dominates the market, holding a significant valuation of 3.5 USD Billion in 2023, and is expected to reach 6.5 USD Billion by 2032, driven by increasing regulations and demand for clean water.

    Europe follows with a value of 2.5 USD Billion in 2023, projected to grow to 4.5 USD Billion, supported by a strong focus on sustainable water practices.In South America, the market stands at 1.2 USD Billion in 2023 and is anticipated to grow to 2.0 USD Billion, reflecting emerging growth opportunities. Asia Asia-Pacific is another key region, valued at 2.0 USD Billion in 2023 and expected to rise to 4.0 USD Billion, reflecting rapid industrialization and urbanization.

    Meanwhile, the Middle East and Africa hold a relatively smaller share at 0.8 USD Billion, growing to 1.5 USD Billion, driven primarily by scarcity of water resources and infrastructural developments. The diversity in market segmentation highlights the importance and growth potential within these regions, reflecting differing local challenges and opportunities in achieving efficient water treatment solutions.

    Source: Primary Research, Secondary Research, Market Research Future Database and Analyst Review

    Key Players and Competitive Insights

    Major players in the Water Treatment Systems Point Of Entry Mpoint-of-entry market industry are constantly working towards developing innovative and advanced products to cater to the evolving needs of customers. Leading Water Treatment Systems Point Of Entry Market players are focusing on research and development to provide efficient and cost-effective solutions. This competitive landscape is driving the Water Treatment Systems Point Of Entry Market development, resulting in a wide range of options for consumers.A notable competitor in the Water Treatment Systems Point Of Entry Mpoint-of-entry market is Culligan International.

    The company offers a comprehensive range of water treatment solutions, including point-of-entry systems, that are designed to meet the specific requirements of various applications. Culligan's commitment to innovation has earned it a strong reputation in the industry, and the company continues to invest in research and development to stay ahead of the competition.Another key player in the Water Treatment Systems Point Of Entry Mpoint-of-entry market is Pentair. The company has a presence and offers a wide range of water treatment products and services.

    Pentair's point-of-entry systems are known for their reliability and efficiency, making them a preferred choice for many consumers. The company's strong distribution network and customer support services contribute to its competitive advantage in the market.

    Key Companies in the Water Treatment Systems Market market include

    Industry Developments

    The Water Treatment Systems Point of Entry Market size was valued at USD 10.07 billion in 2023 and is projected to expand at a CAGR of 7.0% from 2024 to 2032. Growing concerns regarding waterborne diseases and increasing government regulations are driving market growth. Technological advancements, such as the development of smart water treatment systems, are further expected to propel market expansion. Key players in the market include 3M, Culligan, and Pentair. Recent developments include the launch of a new line of point-of-entry water treatment systems by 3M, designed to remove contaminants and improve water quality.

    Future Outlook

    Water Treatment Systems Market Future Outlook

    The Global Water Treatment Systems Point Of Entry Market is projected to grow at a 7.02% CAGR from 2024 to 2035, driven by increasing water quality regulations and technological advancements.

    New opportunities lie in:

    • Invest in smart water treatment technologies to enhance efficiency and monitoring capabilities.
    • Develop eco-friendly filtration solutions to cater to environmentally conscious consumers.
    • Expand into emerging markets with tailored water treatment solutions addressing local needs.

    By 2035, the market is expected to demonstrate robust growth, reflecting heightened demand for advanced water treatment solutions.

    Market Segmentation

    Water Treatment Systems Point of Entry Market Capacity Outlook

    • = 100,000 liters per day (LPD)
    • 100,000 - 500,000 LPD
    • 500,000 - 1,000,000 LPD
    • > 1,000,000 LPD

    Water Treatment Systems Point of Entry Market Regional Outlook

    • North America
    • Europe
    • South America
    • Asia Asia-Pacific
    • Middle East and Africa

    Water Treatment Systems Point of Entry Market Technology Outlook

    • Membrane Filtration
    • Granular Activated Carbon (GAC)
    • Ion Exchange
    • Ultraviolet (UV) Disinfection
    • Distillation

    Water Treatment Systems Point of Entry Market Application Outlook

    • Residential
    • Commercial
    • Industrial
    • Municipal

    Water Treatment Systems Point of Entry Market Installation Type Outlook

    • Under-sink
    • Whole-house
    • Commercial
    • Industrial

    Water Treatment Systems Point of Entry Market Contaminant Removal Outlook

    • Chlorine
    • Fluoride
    • Heavy Metals
    • Bacteria
    • Viruses

    Report Scope

    Attribute/Metric Details
    Market Size 2024 11.53 (USD Billion)
    Market Size 2025 12.34 (USD Billion)
    Market Size 2034 22.73 (USD Billion)
    Compound Annual Growth Rate (CAGR) 7.0% (2025 - 2034)
    Report Coverage Revenue Forecast, Competitive Landscape, Growth Factors, and Trends
    Base Year 2024
    Market Forecast Period 2025 - 2034
    Historical Data 2020 - 2024
    Market Forecast Units USD Billion
    Key Companies Profiled Kinetico , General Electric , LG Electronics , Pentair , EcoWater Systems , A. O. Smith Corporation , Whirlpool , Vivendi , Water Right Group , Culligan International , ITT ,3M , Veolia , Suez
    Segments Covered Technology , Application , Contaminant Removal , Capacity , Installation Type , Regional
    Key Market Opportunities Growing demand for clean waterIncreasing urbanization and industrializationGovernment regulations and initiativesTechnological advancementsRising awareness of waterborne diseases
    Key Market Dynamics 1 Increasing awareness of water quality concerns2 Growing demand for sustainable water solutions3 Government regulations and standards4 Technological advancements5 Market expansion into new regions
    Countries Covered North America, Europe, APAC, South America, MEA

    Market Highlights

    Author
    Chitranshi Jaiswal
    Research Analyst Level I

    In her 3 years of experience in the market research field, she has handled critical cross-domain projects. She has an in-depth knowledge of market estimation & analysis, problem-solving, primary as well as secondary research, and team management.She holds an engineering degree and is an MBA professional from a well-known university, capable of evaluating the market and competitive conditions. An exceptional strategist with excellent communication skills and a passion for delivering cutting-edge & practical insights for the market. Proficient in multi-tasking, and can successfully deal with competing demands, while maintaining complete confidentiality. Generated business through active client and project development, networking, and high-quality responses. Her knowledge and skills have helped in making solid business decisions, securing funding from investors, and avoiding business failures.

    Leave a Comment

    FAQs

    What is the expected market size of the Water Treatment Systems Point of Entry Market by 2032?

    The Water Treatment Systems Point of Entry Market is expected to be valued at 22.73 USD Billion by 2034.

    What is the projected CAGR for the Water Treatment Systems Point of Entry Market from 2024 to 2032?

    The projected CAGR for the Water Treatment Systems Point of Entry Market from 2025 to 2034 is 7.0%.

    Which region is expected to hold the largest market share in the Water Treatment Systems Point of Entry Market by 2032?

    North America is expected to hold the largest market share in the Water Treatment Systems Point of Entry Market by being valued at 6.5 USD Billion in 2032.

    What will be the market size of the Membrane Filtration segment by 2032?

    The Membrane Filtration segment of the Water Treatment Systems Point of Entry Market is expected to be valued at 6.2 USD Billion by 2034.

    Who are the major players in the Water Treatment Systems Point of Entry Market?

    Major players in the Water Treatment Systems Point of Entry Market include Kinetico, General Electric, LG Electronics, Pentair, and EcoWater Systems.

    What is the expected market size of the Granular Activated Carbon (GAC) segment by 2032?

    The Granular Activated Carbon (GAC) segment is expected to be valued at 4.0 USD Billion by 2032.

    How will the Ion Exchange segment's market size change from 2023 to 2032?

    The Ion Exchange segment is projected to grow from 1.7 USD Billion in 2023 to 3.0 USD Billion by 2032.

    What is the market size for the Asia Asia-Pacific region in 2032?

    The market size for the Asia Asia-Pacific region is expected to reach 4.0 USD Billion by 2032.

    What is the anticipated market size for Ultraviolet (UV) Disinfection technology by 2032?

    The Ultraviolet (UV) Disinfection technology segment is expected to be valued at 2.3 USD Billion by 2032.

    What is the expected growth in the South America region from 2023 to 2032?

    The South America region market is expected to grow from 1.2 USD Billion in 2023 to 2.0 USD Billion by 2032.

    1. EXECUTIVE SUMMARY
    2. Market Overview
      1. Key Findings
      2. Market Segmentation
      3. Competitive Landscape
      4. Challenges and Opportunities
      5. Future Outlook
    3. MARKET INTRODUCTION
      1. Definition
      2. Scope of the study
        1. Research Objective
        2. Assumption
        3. Limitations
    4. RESEARCH METHODOLOGY
      1. Overview
      2. Data Mining
      3. Secondary
    5. Research
      1. Primary Research
        1. Primary Interviews and Information
    6. Gathering Process
      1. Breakdown of Primary Respondents
      2. Forecasting
    7. Model
      1. Market Size Estimation
        1. Bottom-Up Approach
    8. Top-Down Approach
      1. Data Triangulation
      2. Validation
    9. MARKET DYNAMICS
      1. Overview
      2. Drivers
      3. Restraints
      4. Opportunities
    10. MARKET FACTOR ANALYSIS
      1. Value chain Analysis
      2. Porter's Five Forces Analysis
        1. Bargaining Power of Suppliers
        2. Bargaining Power of Buyers
        3. Threat of New Entrants
    11. Threat of Substitutes
      1. Intensity of Rivalry
      2. COVID-19 Impact
    12. Analysis
      1. Market Impact Analysis
        1. Regional Impact
    13. Opportunity and Threat Analysis
    14. Water Treatment Systems
    15. Point of Entry Market, BY Technology (USD Billion)
      1. Membrane Filtration
      2. Granular Activated Carbon (GAC)
      3. Ion Exchange
      4. Ultraviolet
    16. (UV) Disinfection
      1. Distillation
    17. Water Treatment Systems Point of
    18. Entry Market, BY Application (USD Billion)
      1. Residential
      2. Commercial
      3. Industrial
      4. Municipal
    19. Water Treatment Systems Point of Entry
    20. Market, BY Contaminant Removal (USD Billion)
      1. Chlorine
      2. Fluoride
      3. Heavy Metals
      4. Bacteria
      5. Viruses
    21. Water Treatment
    22. Systems Point of Entry Market, BY Capacity (USD Billion)
      1. = 100,000 liters
    23. per day (LPD)
      1. 100,000 - 500,000 LPD
      2. 500,000 - 1,000,000 LPD
      3. > 1,000,000 LPD
    24. Water Treatment Systems Point of Entry Market,
    25. BY Installation Type (USD Billion)
      1. Under-sink
      2. Whole-house
      3. Commercial
      4. Industrial
    26. Water Treatment Systems Point
    27. of Entry Market, BY Regional (USD Billion)
      1. North America
    28. US
      1. Canada
      2. Europe
        1. Germany
        2. UK
        3. France
        4. Russia
        5. Italy
        6. Spain
    29. Rest of Europe
      1. APAC
        1. China
        2. India
    30. Japan
      1. South Korea
        1. Malaysia
        2. Thailand
    31. Indonesia
      1. Rest of APAC
      2. South America
        1. Brazil
        2. Mexico
        3. Argentina
        4. Rest of South America
    32. MEA
      1. GCC Countries
        1. South Africa
        2. Rest of MEA
    33. Competitive Landscape
      1. Overview
      2. Competitive
    34. Analysis
      1. Market share Analysis
      2. Major Growth Strategy in the
    35. Water Treatment Systems Point of Entry Market
      1. Competitive Benchmarking
      2. Leading Players in Terms of Number of Developments in the Water Treatment
    36. Systems Point of Entry Market
      1. Key developments and growth strategies
        1. New Product Launch/Service Deployment
        2. Merger Acquisitions
        3. Joint Ventures
      2. Major Players Financial Matrix
    37. Sales and Operating Income
      1. Major Players RD Expenditure. 2023
    38. Company Profiles
      1. Kinetico
        1. Financial Overview
    39. Products Offered
      1. Key Developments
        1. SWOT Analysis
    40. Key Strategies
      1. General Electric
        1. Financial Overview
    41. Products Offered
      1. Key Developments
        1. SWOT Analysis
    42. Key Strategies
      1. LG Electronics
        1. Financial Overview
    43. Products Offered
      1. Key Developments
        1. SWOT Analysis
    44. Key Strategies
      1. Pentair
        1. Financial Overview
        2. Products
    45. Offered
      1. Key Developments
        1. SWOT Analysis
        2. Key
    46. Strategies
      1. EcoWater Systems
        1. Financial Overview
    47. Products Offered
      1. Key Developments
        1. SWOT Analysis
    48. Key Strategies
      1. A. O. Smith Corporation
        1. Financial Overview
        2. Products Offered
        3. Key Developments
        4. SWOT Analysis
        5. Key Strategies
      2. Whirlpool
        1. Financial Overview
        2. Products Offered
        3. Key Developments
        4. SWOT Analysis
        5. Key Strategies
      3. Vivendi
        1. Financial Overview
    49. Products Offered
      1. Key Developments
        1. SWOT Analysis
    50. Key Strategies
      1. Water Right Group
        1. Financial Overview
    51. Products Offered
      1. Key Developments
        1. SWOT Analysis
    52. Key Strategies
      1. Culligan International
        1. Financial Overview
        2. Products Offered
        3. Key Developments
        4. SWOT Analysis
        5. Key Strategies
      2. ITT
        1. Financial Overview
    53. Products Offered
      1. Key Developments
        1. SWOT Analysis
    54. Key Strategies
      1. 3M
        1. Financial Overview
        2. Products
    55. Offered
      1. Key Developments
        1. SWOT Analysis
    56. Key Strategies
      1. Veolia
        1. Financial Overview
    57. Products Offered
      1. Key Developments
        1. SWOT Analysis
    58. Key Strategies
      1. Suez
        1. Financial Overview
        2. Products
    59. Offered
      1. Key Developments
        1. SWOT Analysis
    60. Key Strategies
    61. Appendix
      1. References
      2. Related Reports
    62. Water Treatment Systems Point of Entry Market SIZE ESTIMATES & FORECAST, BY
    63. TECHNOLOGY, 2025-2034 (USD Billions)
    64. Systems Point of Entry Market SIZE ESTIMATES & FORECAST, BY APPLICATION, 2025-2034
    65. (USD Billions)
    66. Market SIZE ESTIMATES & FORECAST, BY CONTAMINANT REMOVAL, 2025-2034 (USD Billions)
    67. & FORECAST, BY CAPACITY, 2025-2034 (USD Billions)
    68. Water Treatment Systems Point of Entry Market SIZE ESTIMATES & FORECAST, BY
    69. INSTALLATION TYPE, 2025-2034 (USD Billions)
    70. Systems Point of Entry Market SIZE ESTIMATES & FORECAST, BY REGIONAL, 2025-2034
    71. (USD Billions)
    72. ESTIMATES & FORECAST, BY TECHNOLOGY, 2025-2034 (USD Billions)
    73. US Water Treatment Systems Point of Entry Market SIZE ESTIMATES & FORECAST,
    74. BY APPLICATION, 2025-2034 (USD Billions)
    75. Point of Entry Market SIZE ESTIMATES & FORECAST, BY CONTAMINANT REMOVAL, 2025-2034
    76. (USD Billions)
    77. ESTIMATES & FORECAST, BY CAPACITY, 2025-2034 (USD Billions)
    78. Water Treatment Systems Point of Entry Market SIZE ESTIMATES & FORECAST, BY
    79. INSTALLATION TYPE, 2025-2034 (USD Billions)
    80. Point of Entry Market SIZE ESTIMATES & FORECAST, BY REGIONAL, 2025-2034 (USD
    81. Billions)
    82. ESTIMATES & FORECAST, BY TECHNOLOGY, 2025-2034 (USD Billions)
    83. Canada Water Treatment Systems Point of Entry Market SIZE ESTIMATES & FORECAST,
    84. BY APPLICATION, 2025-2034 (USD Billions)
    85. Point of Entry Market SIZE ESTIMATES & FORECAST, BY CONTAMINANT REMOVAL, 2025-2034
    86. (USD Billions)
    87. SIZE ESTIMATES & FORECAST, BY CAPACITY, 2025-2034 (USD Billions)
    88. Canada Water Treatment Systems Point of Entry Market SIZE ESTIMATES & FORECAST,
    89. BY INSTALLATION TYPE, 2025-2034 (USD Billions)
    90. Systems Point of Entry Market SIZE ESTIMATES & FORECAST, BY REGIONAL, 2025-2034
    91. (USD Billions)
    92. SIZE ESTIMATES & FORECAST, BY TECHNOLOGY, 2025-2034 (USD Billions)
    93. Europe Water Treatment Systems Point of Entry Market SIZE ESTIMATES & FORECAST,
    94. BY APPLICATION, 2025-2034 (USD Billions)
    95. Point of Entry Market SIZE ESTIMATES & FORECAST, BY CONTAMINANT REMOVAL, 2025-2034
    96. (USD Billions)
    97. SIZE ESTIMATES & FORECAST, BY CAPACITY, 2025-2034 (USD Billions)
    98. Europe Water Treatment Systems Point of Entry Market SIZE ESTIMATES & FORECAST,
    99. BY INSTALLATION TYPE, 2025-2034 (USD Billions)
    100. Systems Point of Entry Market SIZE ESTIMATES & FORECAST, BY REGIONAL, 2025-2034
    101. (USD Billions)
    102. SIZE ESTIMATES & FORECAST, BY TECHNOLOGY, 2025-2034 (USD Billions)
    103. Germany Water Treatment Systems Point of Entry Market SIZE ESTIMATES & FORECAST,
    104. BY APPLICATION, 2025-2034 (USD Billions)
    105. Systems Point of Entry Market SIZE ESTIMATES & FORECAST, BY CONTAMINANT REMOVAL,
    106. 2034 (USD Billions)
    107. Entry Market SIZE ESTIMATES & FORECAST, BY CAPACITY, 2025-2034 (USD Billions)
    108. & FORECAST, BY INSTALLATION TYPE, 2025-2034 (USD Billions)
    109. Water Treatment Systems Point of Entry Market SIZE ESTIMATES & FORECAST, BY
    110. REGIONAL, 2025-2034 (USD Billions)
    111. of Entry Market SIZE ESTIMATES & FORECAST, BY TECHNOLOGY, 2025-2034 (USD Billions)
    112. FORECAST, BY APPLICATION, 2025-2034 (USD Billions)
    113. Systems Point of Entry Market SIZE ESTIMATES & FORECAST, BY CONTAMINANT REMOVAL,
    114. 2034 (USD Billions)
    115. Market SIZE ESTIMATES & FORECAST, BY CAPACITY, 2025-2034 (USD Billions)
    116. UK Water Treatment Systems Point of Entry Market SIZE ESTIMATES & FORECAST,
    117. BY INSTALLATION TYPE, 2025-2034 (USD Billions)
    118. Systems Point of Entry Market SIZE ESTIMATES & FORECAST, BY REGIONAL, 2025-2034
    119. (USD Billions)
    120. SIZE ESTIMATES & FORECAST, BY TECHNOLOGY, 2025-2034 (USD Billions)
    121. France Water Treatment Systems Point of Entry Market SIZE ESTIMATES & FORECAST,
    122. BY APPLICATION, 2025-2034 (USD Billions)
    123. Point of Entry Market SIZE ESTIMATES & FORECAST, BY CONTAMINANT REMOVAL, 2025-2034
    124. (USD Billions)
    125. SIZE ESTIMATES & FORECAST, BY CAPACITY, 2025-2034 (USD Billions)
    126. France Water Treatment Systems Point of Entry Market SIZE ESTIMATES & FORECAST,
    127. BY INSTALLATION TYPE, 2025-2034 (USD Billions)
    128. Systems Point of Entry Market SIZE ESTIMATES & FORECAST, BY REGIONAL, 2025-2034
    129. (USD Billions)
    130. SIZE ESTIMATES & FORECAST, BY TECHNOLOGY, 2025-2034 (USD Billions)
    131. Russia Water Treatment Systems Point of Entry Market SIZE ESTIMATES & FORECAST,
    132. BY APPLICATION, 2025-2034 (USD Billions)
    133. Point of Entry Market SIZE ESTIMATES & FORECAST, BY CONTAMINANT REMOVAL, 2025-2034
    134. (USD Billions)
    135. SIZE ESTIMATES & FORECAST, BY CAPACITY, 2025-2034 (USD Billions)
    136. Russia Water Treatment Systems Point of Entry Market SIZE ESTIMATES & FORECAST,
    137. BY INSTALLATION TYPE, 2025-2034 (USD Billions)
    138. Systems Point of Entry Market SIZE ESTIMATES & FORECAST, BY REGIONAL, 2025-2034
    139. (USD Billions)
    140. SIZE ESTIMATES & FORECAST, BY TECHNOLOGY, 2025-2034 (USD Billions)
    141. Italy Water Treatment Systems Point of Entry Market SIZE ESTIMATES & FORECAST,
    142. BY APPLICATION, 2025-2034 (USD Billions)
    143. Point of Entry Market SIZE ESTIMATES & FORECAST, BY CONTAMINANT REMOVAL, 2025-2034
    144. (USD Billions)
    145. SIZE ESTIMATES & FORECAST, BY CAPACITY, 2025-2034 (USD Billions)
    146. Italy Water Treatment Systems Point of Entry Market SIZE ESTIMATES & FORECAST,
    147. BY INSTALLATION TYPE, 2025-2034 (USD Billions)
    148. Systems Point of Entry Market SIZE ESTIMATES & FORECAST, BY REGIONAL, 2025-2034
    149. (USD Billions)
    150. SIZE ESTIMATES & FORECAST, BY TECHNOLOGY, 2025-2034 (USD Billions)
    151. Spain Water Treatment Systems Point of Entry Market SIZE ESTIMATES & FORECAST,
    152. BY APPLICATION, 2025-2034 (USD Billions)
    153. Point of Entry Market SIZE ESTIMATES & FORECAST, BY CONTAMINANT REMOVAL, 2025-2034
    154. (USD Billions)
    155. SIZE ESTIMATES & FORECAST, BY CAPACITY, 2025-2034 (USD Billions)
    156. Spain Water Treatment Systems Point of Entry Market SIZE ESTIMATES & FORECAST,
    157. BY INSTALLATION TYPE, 2025-2034 (USD Billions)
    158. Systems Point of Entry Market SIZE ESTIMATES & FORECAST, BY REGIONAL, 2025-2034
    159. (USD Billions)
    160. Market SIZE ESTIMATES & FORECAST, BY TECHNOLOGY, 2025-2034 (USD Billions)
    161. & FORECAST, BY APPLICATION, 2025-2034 (USD Billions)
    162. Europe Water Treatment Systems Point of Entry Market SIZE ESTIMATES & FORECAST,
    163. BY CONTAMINANT REMOVAL, 2025-2034 (USD Billions)
    164. Treatment Systems Point of Entry Market SIZE ESTIMATES & FORECAST, BY CAPACITY,
    165. 2034 (USD Billions)
    166. of Entry Market SIZE ESTIMATES & FORECAST, BY INSTALLATION TYPE, 2025-2034 (USD
    167. Billions)
    168. SIZE ESTIMATES & FORECAST, BY REGIONAL, 2025-2034 (USD Billions)
    169. APAC Water Treatment Systems Point of Entry Market SIZE ESTIMATES & FORECAST,
    170. BY TECHNOLOGY, 2025-2034 (USD Billions)
    171. Point of Entry Market SIZE ESTIMATES & FORECAST, BY APPLICATION, 2025-2034 (USD
    172. Billions)
    173. ESTIMATES & FORECAST, BY CONTAMINANT REMOVAL, 2025-2034 (USD Billions)
    174. APAC Water Treatment Systems Point of Entry Market SIZE ESTIMATES & FORECAST,
    175. BY CAPACITY, 2025-2034 (USD Billions)
    176. Point of Entry Market SIZE ESTIMATES & FORECAST, BY INSTALLATION TYPE, 2025-2034
    177. (USD Billions)
    178. SIZE ESTIMATES & FORECAST, BY REGIONAL, 2025-2034 (USD Billions)
    179. China Water Treatment Systems Point of Entry Market SIZE ESTIMATES & FORECAST,
    180. BY TECHNOLOGY, 2025-2034 (USD Billions)
    181. Point of Entry Market SIZE ESTIMATES & FORECAST, BY APPLICATION, 2025-2034 (USD
    182. Billions)
    183. ESTIMATES & FORECAST, BY CONTAMINANT REMOVAL, 2025-2034 (USD Billions)
    184. China Water Treatment Systems Point of Entry Market SIZE ESTIMATES & FORECAST,
    185. BY CAPACITY, 2025-2034 (USD Billions)
    186. Point of Entry Market SIZE ESTIMATES & FORECAST, BY INSTALLATION TYPE, 2025-2034
    187. (USD Billions)
    188. SIZE ESTIMATES & FORECAST, BY REGIONAL, 2025-2034 (USD Billions)
    189. India Water Treatment Systems Point of Entry Market SIZE ESTIMATES & FORECAST,
    190. BY TECHNOLOGY, 2025-2034 (USD Billions)
    191. Point of Entry Market SIZE ESTIMATES & FORECAST, BY APPLICATION, 2025-2034 (USD
    192. Billions)
    193. ESTIMATES & FORECAST, BY CONTAMINANT REMOVAL, 2025-2034 (USD Billions)
    194. India Water Treatment Systems Point of Entry Market SIZE ESTIMATES & FORECAST,
    195. BY CAPACITY, 2025-2034 (USD Billions)
    196. Point of Entry Market SIZE ESTIMATES & FORECAST, BY INSTALLATION TYPE, 2025-2034
    197. (USD Billions)
    198. SIZE ESTIMATES & FORECAST, BY REGIONAL, 2025-2034 (USD Billions)
    199. Japan Water Treatment Systems Point of Entry Market SIZE ESTIMATES & FORECAST,
    200. BY TECHNOLOGY, 2025-2034 (USD Billions)
    201. Point of Entry Market SIZE ESTIMATES & FORECAST, BY APPLICATION, 2025-2034 (USD
    202. Billions)
    203. ESTIMATES & FORECAST, BY CONTAMINANT REMOVAL, 2025-2034 (USD Billions)
    204. Japan Water Treatment Systems Point of Entry Market SIZE ESTIMATES & FORECAST,
    205. BY CAPACITY, 2025-2034 (USD Billions)
    206. Point of Entry Market SIZE ESTIMATES & FORECAST, BY INSTALLATION TYPE, 2025-2034
    207. (USD Billions)
    208. SIZE ESTIMATES & FORECAST, BY REGIONAL, 2025-2034 (USD Billions)
    209. South Korea Water Treatment Systems Point of Entry Market SIZE ESTIMATES &
    210. FORECAST, BY TECHNOLOGY, 2025-2034 (USD Billions)
    211. Treatment Systems Point of Entry Market SIZE ESTIMATES & FORECAST, BY APPLICATION,
    212. 2034 (USD Billions)
    213. of Entry Market SIZE ESTIMATES & FORECAST, BY CONTAMINANT REMOVAL, 2025-2034
    214. (USD Billions)
    215. Market SIZE ESTIMATES & FORECAST, BY CAPACITY, 2025-2034 (USD Billions)
    216. South Korea Water Treatment Systems Point of Entry Market SIZE ESTIMATES &
    217. FORECAST, BY INSTALLATION TYPE, 2025-2034 (USD Billions)
    218. Water Treatment Systems Point of Entry Market SIZE ESTIMATES & FORECAST, BY
    219. REGIONAL, 2025-2034 (USD Billions)
    220. Point of Entry Market SIZE ESTIMATES & FORECAST, BY TECHNOLOGY, 2025-2034 (USD
    221. Billions)
    222. SIZE ESTIMATES & FORECAST, BY APPLICATION, 2025-2034 (USD Billions)
    223. Malaysia Water Treatment Systems Point of Entry Market SIZE ESTIMATES &
    224. FORECAST, BY CONTAMINANT REMOVAL, 2025-2034 (USD Billions)
    225. Water Treatment Systems Point of Entry Market SIZE ESTIMATES & FORECAST, BY
    226. CAPACITY, 2025-2034 (USD Billions)
    227. Point of Entry Market SIZE ESTIMATES & FORECAST, BY INSTALLATION TYPE, 2025-2034
    228. (USD Billions)
    229. SIZE ESTIMATES & FORECAST, BY REGIONAL, 2025-2034 (USD Billions)
    230. Thailand Water Treatment Systems Point of Entry Market SIZE ESTIMATES &
    231. FORECAST, BY TECHNOLOGY, 2025-2034 (USD Billions)
    232. Treatment Systems Point of Entry Market SIZE ESTIMATES & FORECAST, BY APPLICATION,
    233. 2034 (USD Billions)
    234. of Entry Market SIZE ESTIMATES & FORECAST, BY CONTAMINANT REMOVAL, 2025-2034
    235. (USD Billions)
    236. SIZE ESTIMATES & FORECAST, BY CAPACITY, 2025-2034 (USD Billions)
    237. Thailand Water Treatment Systems Point of Entry Market SIZE ESTIMATES &
    238. FORECAST, BY INSTALLATION TYPE, 2025-2034 (USD Billions)
    239. Water Treatment Systems Point of Entry Market SIZE ESTIMATES & FORECAST, BY
    240. REGIONAL, 2025-2034 (USD Billions)
    241. Point of Entry Market SIZE ESTIMATES & FORECAST, BY TECHNOLOGY, 2025-2034 (USD
    242. Billions)
    243. SIZE ESTIMATES & FORECAST, BY APPLICATION, 2025-2034 (USD Billions)
    244. Indonesia Water Treatment Systems Point of Entry Market SIZE ESTIMATES &
    245. FORECAST, BY CONTAMINANT REMOVAL, 2025-2034 (USD Billions)
    246. Water Treatment Systems Point of Entry Market SIZE ESTIMATES & FORECAST, BY
    247. CAPACITY, 2025-2034 (USD Billions)
    248. Point of Entry Market SIZE ESTIMATES & FORECAST, BY INSTALLATION TYPE, 2025-2034
    249. (USD Billions)
    250. Market SIZE ESTIMATES & FORECAST, BY REGIONAL, 2025-2034 (USD Billions)
    251. Rest of APAC Water Treatment Systems Point of Entry Market SIZE ESTIMATES &
    252. FORECAST, BY TECHNOLOGY, 2025-2034 (USD Billions)
    253. Treatment Systems Point of Entry Market SIZE ESTIMATES & FORECAST, BY APPLICATION,
    254. 2034 (USD Billions)
    255. of Entry Market SIZE ESTIMATES & FORECAST, BY CONTAMINANT REMOVAL, 2025-2034
    256. (USD Billions)
    257. Market SIZE ESTIMATES & FORECAST, BY CAPACITY, 2025-2034 (USD Billions)
    258. Rest of APAC Water Treatment Systems Point of Entry Market SIZE ESTIMATES &
    259. FORECAST, BY INSTALLATION TYPE, 2025-2034 (USD Billions)
    260. APAC Water Treatment Systems Point of Entry Market SIZE ESTIMATES & FORECAST,
    261. BY REGIONAL, 2025-2034 (USD Billions)
    262. Systems Point of Entry Market SIZE ESTIMATES & FORECAST, BY TECHNOLOGY, 2025-2034
    263. (USD Billions)
    264. Market SIZE ESTIMATES & FORECAST, BY APPLICATION, 2025-2034 (USD Billions)
    265. & FORECAST, BY CONTAMINANT REMOVAL, 2025-2034 (USD Billions)
    266. South America Water Treatment Systems Point of Entry Market SIZE ESTIMATES &
    267. FORECAST, BY CAPACITY, 2025-2034 (USD Billions)
    268. Treatment Systems Point of Entry Market SIZE ESTIMATES & FORECAST, BY INSTALLATION
    269. TYPE, 2025-2034 (USD Billions)
    270. Point of Entry Market SIZE ESTIMATES & FORECAST, BY REGIONAL, 2025-2034 (USD
    271. Billions)
    272. ESTIMATES & FORECAST, BY TECHNOLOGY, 2025-2034 (USD Billions)
    273. Brazil Water Treatment Systems Point of Entry Market SIZE ESTIMATES & FORECAST,
    274. BY APPLICATION, 2025-2034 (USD Billions)
    275. Systems Point of Entry Market SIZE ESTIMATES & FORECAST, BY CONTAMINANT REMOVAL,
    276. 2034 (USD Billions)
    277. Entry Market SIZE ESTIMATES & FORECAST, BY CAPACITY, 2025-2034 (USD Billions)
    278. & FORECAST, BY INSTALLATION TYPE, 2025-2034 (USD Billions)
    279. Water Treatment Systems Point of Entry Market SIZE ESTIMATES & FORECAST, BY
    280. REGIONAL, 2025-2034 (USD Billions)
    281. Point of Entry Market SIZE ESTIMATES & FORECAST, BY TECHNOLOGY, 2025-2034 (USD
    282. Billions)
    283. ESTIMATES & FORECAST, BY APPLICATION, 2025-2034 (USD Billions)
    284. Mexico Water Treatment Systems Point of Entry Market SIZE ESTIMATES & FORECAST,
    285. BY CONTAMINANT REMOVAL, 2025-2034 (USD Billions)
    286. Systems Point of Entry Market SIZE ESTIMATES & FORECAST, BY CAPACITY, 2025-2034
    287. (USD Billions)
    288. SIZE ESTIMATES & FORECAST, BY INSTALLATION TYPE, 2025-2034 (USD Billions)
    289. & FORECAST, BY REGIONAL, 2025-2034 (USD Billions)
    290. Water Treatment Systems Point of Entry Market SIZE ESTIMATES & FORECAST, BY
    291. TECHNOLOGY, 2025-2034 (USD Billions)
    292. Point of Entry Market SIZE ESTIMATES & FORECAST, BY APPLICATION, 2025-2034 (USD
    293. Billions)
    294. SIZE ESTIMATES & FORECAST, BY CONTAMINANT REMOVAL, 2025-2034 (USD Billions)
    295. & FORECAST, BY CAPACITY, 2025-2034 (USD Billions)
    296. Water Treatment Systems Point of Entry Market SIZE ESTIMATES & FORECAST, BY
    297. INSTALLATION TYPE, 2025-2034 (USD Billions)
    298. Systems Point of Entry Market SIZE ESTIMATES & FORECAST, BY REGIONAL, 2025-2034
    299. (USD Billions)
    300. of Entry Market SIZE ESTIMATES & FORECAST, BY TECHNOLOGY, 2025-2034 (USD Billions)
    301. SIZE ESTIMATES & FORECAST, BY APPLICATION, 2025-2034 (USD Billions)
    302. Rest of South America Water Treatment Systems Point of Entry Market SIZE ESTIMATES
    303. & FORECAST, BY CONTAMINANT REMOVAL, 2025-2034 (USD Billions)
    304. Rest of South America Water Treatment Systems Point of Entry Market SIZE ESTIMATES
    305. & FORECAST, BY CAPACITY, 2025-2034 (USD Billions)
    306. America Water Treatment Systems Point of Entry Market SIZE ESTIMATES & FORECAST,
    307. BY INSTALLATION TYPE, 2025-2034 (USD Billions)
    308. Water Treatment Systems Point of Entry Market SIZE ESTIMATES & FORECAST, BY
    309. REGIONAL, 2025-2034 (USD Billions)
    310. of Entry Market SIZE ESTIMATES & FORECAST, BY TECHNOLOGY, 2025-2034 (USD Billions)
    311. FORECAST, BY APPLICATION, 2025-2034 (USD Billions)
    312. Systems Point of Entry Market SIZE ESTIMATES & FORECAST, BY CONTAMINANT REMOVAL,
    313. 2034 (USD Billions)
    314. Market SIZE ESTIMATES & FORECAST, BY CAPACITY, 2025-2034 (USD Billions)
    315. MEA Water Treatment Systems Point of Entry Market SIZE ESTIMATES & FORECAST,
    316. BY INSTALLATION TYPE, 2025-2034 (USD Billions)
    317. Systems Point of Entry Market SIZE ESTIMATES & FORECAST, BY REGIONAL, 2025-2034
    318. (USD Billions)
    319. Market SIZE ESTIMATES & FORECAST, BY TECHNOLOGY, 2025-2034 (USD Billions)
    320. & FORECAST, BY APPLICATION, 2025-2034 (USD Billions)
    321. Water Treatment Systems Point of Entry Market SIZE ESTIMATES & FORECAST, BY
    322. CONTAMINANT REMOVAL, 2025-2034 (USD Billions)
    323. Treatment Systems Point of Entry Market SIZE ESTIMATES & FORECAST, BY CAPACITY,
    324. 2034 (USD Billions)
    325. of Entry Market SIZE ESTIMATES & FORECAST, BY INSTALLATION TYPE, 2025-2034 (USD
    326. Billions)
    327. SIZE ESTIMATES & FORECAST, BY REGIONAL, 2025-2034 (USD Billions)
    328. South Africa Water Treatment Systems Point of Entry Market SIZE ESTIMATES &
    329. FORECAST, BY TECHNOLOGY, 2025-2034 (USD Billions)
    330. Treatment Systems Point of Entry Market SIZE ESTIMATES & FORECAST, BY APPLICATION,
    331. 2034 (USD Billions)
    332. of Entry Market SIZE ESTIMATES & FORECAST, BY CONTAMINANT REMOVAL, 2025-2034
    333. (USD Billions)
    334. Market SIZE ESTIMATES & FORECAST, BY CAPACITY, 2025-2034 (USD Billions)
    335. South Africa Water Treatment Systems Point of Entry Market SIZE ESTIMATES &
    336. FORECAST, BY INSTALLATION TYPE, 2025-2034 (USD Billions)
    337. Water Treatment Systems Point of Entry Market SIZE ESTIMATES & FORECAST, BY
    338. REGIONAL, 2025-2034 (USD Billions)
    339. Point of Entry Market SIZE ESTIMATES & FORECAST, BY TECHNOLOGY, 2025-2034 (USD
    340. Billions)
    341. SIZE ESTIMATES & FORECAST, BY APPLICATION, 2025-2034 (USD Billions)
    342. Rest of MEA Water Treatment Systems Point of Entry Market SIZE ESTIMATES &
    343. FORECAST, BY CONTAMINANT REMOVAL, 2025-2034 (USD Billions)
    344. of MEA Water Treatment Systems Point of Entry Market SIZE ESTIMATES & FORECAST,
    345. BY CAPACITY, 2025-2034 (USD Billions)
    346. Systems Point of Entry Market SIZE ESTIMATES & FORECAST, BY INSTALLATION TYPE,
    347. 2034 (USD Billions)
    348. of Entry Market SIZE ESTIMATES & FORECAST, BY REGIONAL, 2025-2034 (USD Billions)
    349. AMERICA WATER TREATMENT SYSTEMS POINT OF ENTRY MARKET ANALYSIS
    350. WATER TREATMENT SYSTEMS POINT OF ENTRY MARKET ANALYSIS BY TECHNOLOGY
    351. US WATER TREATMENT SYSTEMS POINT OF ENTRY MARKET ANALYSIS BY APPLICATION
    352. US WATER TREATMENT SYSTEMS POINT OF ENTRY MARKET ANALYSIS BY CONTAMINANT REMOVAL
    353. TYPE
    354. REGIONAL
    355. BY TECHNOLOGY
    356. ANALYSIS BY APPLICATION
    357. ENTRY MARKET ANALYSIS BY CONTAMINANT REMOVAL
    358. SYSTEMS POINT OF ENTRY MARKET ANALYSIS BY CAPACITY
    359. TREATMENT SYSTEMS POINT OF ENTRY MARKET ANALYSIS BY INSTALLATION TYPE
    360. CANADA WATER TREATMENT SYSTEMS POINT OF ENTRY MARKET ANALYSIS BY REGIONAL
    361. GERMANY WATER TREATMENT SYSTEMS POINT OF ENTRY MARKET ANALYSIS BY TECHNOLOGY
    362. REMOVAL
    363. BY CAPACITY
    364. ANALYSIS BY INSTALLATION TYPE
    365. OF ENTRY MARKET ANALYSIS BY REGIONAL
    366. POINT OF ENTRY MARKET ANALYSIS BY TECHNOLOGY
    367. SYSTEMS POINT OF ENTRY MARKET ANALYSIS BY APPLICATION
    368. SYSTEMS POINT OF ENTRY MARKET ANALYSIS BY CONTAMINANT REMOVAL
    369. WATER TREATMENT SYSTEMS POINT OF ENTRY MARKET ANALYSIS BY CAPACITY
    370. UK WATER TREATMENT SYSTEMS POINT OF ENTRY MARKET ANALYSIS BY INSTALLATION TYPE
    371. REMOVAL
    372. BY CAPACITY
    373. ANALYSIS BY INSTALLATION TYPE
    374. OF ENTRY MARKET ANALYSIS BY REGIONAL
    375. POINT OF ENTRY MARKET ANALYSIS BY TECHNOLOGY
    376. SYSTEMS POINT OF ENTRY MARKET ANALYSIS BY APPLICATION
    377. TREATMENT SYSTEMS POINT OF ENTRY MARKET ANALYSIS BY CONTAMINANT REMOVAL
    378. RUSSIA WATER TREATMENT SYSTEMS POINT OF ENTRY MARKET ANALYSIS BY CAPACITY
    379. TYPE
    380. BY REGIONAL
    381. ANALYSIS BY TECHNOLOGY
    382. MARKET ANALYSIS BY APPLICATION
    383. OF ENTRY MARKET ANALYSIS BY CONTAMINANT REMOVAL
    384. SYSTEMS POINT OF ENTRY MARKET ANALYSIS BY CAPACITY
    385. SYSTEMS POINT OF ENTRY MARKET ANALYSIS BY INSTALLATION TYPE
    386. WATER TREATMENT SYSTEMS POINT OF ENTRY MARKET ANALYSIS BY REGIONAL
    387. SPAIN WATER TREATMENT SYSTEMS POINT OF ENTRY MARKET ANALYSIS BY TECHNOLOGY
    388. SPAIN WATER TREATMENT SYSTEMS POINT OF ENTRY MARKET ANALYSIS BY APPLICATION
    389. REMOVAL
    390. BY CAPACITY
    391. ANALYSIS BY INSTALLATION TYPE
    392. OF ENTRY MARKET ANALYSIS BY REGIONAL
    393. SYSTEMS POINT OF ENTRY MARKET ANALYSIS BY TECHNOLOGY
    394. WATER TREATMENT SYSTEMS POINT OF ENTRY MARKET ANALYSIS BY APPLICATION
    395. REST OF EUROPE WATER TREATMENT SYSTEMS POINT OF ENTRY MARKET ANALYSIS BY CONTAMINANT
    396. REMOVAL
    397. ANALYSIS BY CAPACITY
    398. OF ENTRY MARKET ANALYSIS BY INSTALLATION TYPE
    399. TREATMENT SYSTEMS POINT OF ENTRY MARKET ANALYSIS BY REGIONAL
    400. WATER TREATMENT SYSTEMS POINT OF ENTRY MARKET ANALYSIS
    401. TREATMENT SYSTEMS POINT OF ENTRY MARKET ANALYSIS BY TECHNOLOGY
    402. WATER TREATMENT SYSTEMS POINT OF ENTRY MARKET ANALYSIS BY APPLICATION
    403. CHINA WATER TREATMENT SYSTEMS POINT OF ENTRY MARKET ANALYSIS BY CONTAMINANT
    404. REMOVAL
    405. BY CAPACITY
    406. ANALYSIS BY INSTALLATION TYPE
    407. OF ENTRY MARKET ANALYSIS BY REGIONAL
    408. POINT OF ENTRY MARKET ANALYSIS BY TECHNOLOGY
    409. SYSTEMS POINT OF ENTRY MARKET ANALYSIS BY APPLICATION
    410. TREATMENT SYSTEMS POINT OF ENTRY MARKET ANALYSIS BY CONTAMINANT REMOVAL
    411. INDIA WATER TREATMENT SYSTEMS POINT OF ENTRY MARKET ANALYSIS BY CAPACITY
    412. TYPE
    413. BY REGIONAL
    414. ANALYSIS BY TECHNOLOGY
    415. MARKET ANALYSIS BY APPLICATION
    416. OF ENTRY MARKET ANALYSIS BY CONTAMINANT REMOVAL
    417. SYSTEMS POINT OF ENTRY MARKET ANALYSIS BY CAPACITY
    418. SYSTEMS POINT OF ENTRY MARKET ANALYSIS BY INSTALLATION TYPE
    419. WATER TREATMENT SYSTEMS POINT OF ENTRY MARKET ANALYSIS BY REGIONAL
    420. SOUTH KOREA WATER TREATMENT SYSTEMS POINT OF ENTRY MARKET ANALYSIS BY TECHNOLOGY
    421. BY APPLICATION
    422. MARKET ANALYSIS BY CONTAMINANT REMOVAL
    423. SYSTEMS POINT OF ENTRY MARKET ANALYSIS BY CAPACITY
    424. TREATMENT SYSTEMS POINT OF ENTRY MARKET ANALYSIS BY INSTALLATION TYPE
    425. SOUTH KOREA WATER TREATMENT SYSTEMS POINT OF ENTRY MARKET ANALYSIS BY REGIONAL
    426. TECHNOLOGY
    427. ANALYSIS BY APPLICATION
    428. ENTRY MARKET ANALYSIS BY CONTAMINANT REMOVAL
    429. SYSTEMS POINT OF ENTRY MARKET ANALYSIS BY CAPACITY
    430. TREATMENT SYSTEMS POINT OF ENTRY MARKET ANALYSIS BY INSTALLATION TYPE
    431. MALAYSIA WATER TREATMENT SYSTEMS POINT OF ENTRY MARKET ANALYSIS BY REGIONAL
    432. TECHNOLOGY
    433. ANALYSIS BY APPLICATION
    434. ENTRY MARKET ANALYSIS BY CONTAMINANT REMOVAL
    435. SYSTEMS POINT OF ENTRY MARKET ANALYSIS BY CAPACITY
    436. TREATMENT SYSTEMS POINT OF ENTRY MARKET ANALYSIS BY INSTALLATION TYPE
    437. THAILAND WATER TREATMENT SYSTEMS POINT OF ENTRY MARKET ANALYSIS BY REGIONAL
    438. TECHNOLOGY
    439. ANALYSIS BY APPLICATION
    440. OF ENTRY MARKET ANALYSIS BY CONTAMINANT REMOVAL
    441. TREATMENT SYSTEMS POINT OF ENTRY MARKET ANALYSIS BY CAPACITY
    442. WATER TREATMENT SYSTEMS POINT OF ENTRY MARKET ANALYSIS BY INSTALLATION TYPE
    443. INDONESIA WATER TREATMENT SYSTEMS POINT OF ENTRY MARKET ANALYSIS BY REGIONAL
    444. BY TECHNOLOGY
    445. MARKET ANALYSIS BY APPLICATION
    446. POINT OF ENTRY MARKET ANALYSIS BY CONTAMINANT REMOVAL
    447. WATER TREATMENT SYSTEMS POINT OF ENTRY MARKET ANALYSIS BY CAPACITY
    448. REST OF APAC WATER TREATMENT SYSTEMS POINT OF ENTRY MARKET ANALYSIS BY INSTALLATION
    449. TYPE
    450. ANALYSIS BY REGIONAL
    451. OF ENTRY MARKET ANALYSIS
    452. ENTRY MARKET ANALYSIS BY TECHNOLOGY
    453. POINT OF ENTRY MARKET ANALYSIS BY APPLICATION
    454. SYSTEMS POINT OF ENTRY MARKET ANALYSIS BY CONTAMINANT REMOVAL
    455. WATER TREATMENT SYSTEMS POINT OF ENTRY MARKET ANALYSIS BY CAPACITY
    456. BRAZIL WATER TREATMENT SYSTEMS POINT OF ENTRY MARKET ANALYSIS BY INSTALLATION TYPE
    457. REMOVAL
    458. BY CAPACITY
    459. ANALYSIS BY INSTALLATION TYPE
    460. OF ENTRY MARKET ANALYSIS BY REGIONAL
    461. SYSTEMS POINT OF ENTRY MARKET ANALYSIS BY TECHNOLOGY
    462. WATER TREATMENT SYSTEMS POINT OF ENTRY MARKET ANALYSIS BY APPLICATION
    463. ARGENTINA WATER TREATMENT SYSTEMS POINT OF ENTRY MARKET ANALYSIS BY CONTAMINANT
    464. REMOVAL
    465. ANALYSIS BY CAPACITY
    466. ENTRY MARKET ANALYSIS BY INSTALLATION TYPE
    467. SYSTEMS POINT OF ENTRY MARKET ANALYSIS BY REGIONAL
    468. AMERICA WATER TREATMENT SYSTEMS POINT OF ENTRY MARKET ANALYSIS BY TECHNOLOGY
    469. ANALYSIS BY APPLICATION
    470. POINT OF ENTRY MARKET ANALYSIS BY CONTAMINANT REMOVAL
    471. AMERICA WATER TREATMENT SYSTEMS POINT OF ENTRY MARKET ANALYSIS BY CAPACITY
    472. REST OF SOUTH AMERICA WATER TREATMENT SYSTEMS POINT OF ENTRY MARKET ANALYSIS
    473. BY INSTALLATION TYPE
    474. POINT OF ENTRY MARKET ANALYSIS BY REGIONAL
    475. SYSTEMS POINT OF ENTRY MARKET ANALYSIS
    476. SYSTEMS POINT OF ENTRY MARKET ANALYSIS BY TECHNOLOGY
    477. WATER TREATMENT SYSTEMS POINT OF ENTRY MARKET ANALYSIS BY APPLICATION
    478. GCC COUNTRIES WATER TREATMENT SYSTEMS POINT OF ENTRY MARKET ANALYSIS BY CONTAMINANT
    479. REMOVAL
    480. ANALYSIS BY CAPACITY
    481. OF ENTRY MARKET ANALYSIS BY INSTALLATION TYPE
    482. TREATMENT SYSTEMS POINT OF ENTRY MARKET ANALYSIS BY REGIONAL
    483. AFRICA WATER TREATMENT SYSTEMS POINT OF ENTRY MARKET ANALYSIS BY TECHNOLOGY
    484. SOUTH AFRICA WATER TREATMENT SYSTEMS POINT OF ENTRY MARKET ANALYSIS BY APPLICATION
    485. BY CONTAMINANT REMOVAL
    486. OF ENTRY MARKET ANALYSIS BY CAPACITY
    487. SYSTEMS POINT OF ENTRY MARKET ANALYSIS BY INSTALLATION TYPE
    488. AFRICA WATER TREATMENT SYSTEMS POINT OF ENTRY MARKET ANALYSIS BY REGIONAL
    489. REST OF MEA WATER TREATMENT SYSTEMS POINT OF ENTRY MARKET ANALYSIS BY TECHNOLOGY
    490. BY APPLICATION
    491. MARKET ANALYSIS BY CONTAMINANT REMOVAL
    492. SYSTEMS POINT OF ENTRY MARKET ANALYSIS BY CAPACITY
    493. WATER TREATMENT SYSTEMS POINT OF ENTRY MARKET ANALYSIS BY INSTALLATION TYPE
    494. REST OF MEA WATER TREATMENT SYSTEMS POINT OF ENTRY MARKET ANALYSIS BY REGIONAL
    495. SYSTEMS POINT OF ENTRY MARKET
    496. SYSTEMS POINT OF ENTRY MARKET
    497. TREATMENT SYSTEMS POINT OF ENTRY MARKET
    498. TREATMENT SYSTEMS POINT OF ENTRY MARKET
    499. POINT OF ENTRY MARKET, BY TECHNOLOGY, 2024 (% SHARE)
    500. SYSTEMS POINT OF ENTRY MARKET, BY TECHNOLOGY, 2019 TO 2032 (USD Billions)
    501. WATER TREATMENT SYSTEMS POINT OF ENTRY MARKET, BY APPLICATION, 2024 (% SHARE)
    502. TO 2032 (USD Billions)
    503. BY CONTAMINANT REMOVAL, 2024 (% SHARE)
    504. POINT OF ENTRY MARKET, BY CONTAMINANT REMOVAL, 2019 TO 2032 (USD Billions)
    505. WATER TREATMENT SYSTEMS POINT OF ENTRY MARKET, BY CAPACITY, 2024 (% SHARE)
    506. (USD Billions)
    507. BY INSTALLATION TYPE, 2024 (% SHARE)
    508. OF ENTRY MARKET, BY INSTALLATION TYPE, 2019 TO 2032 (USD Billions)
    509. WATER TREATMENT SYSTEMS POINT OF ENTRY MARKET, BY REGIONAL, 2024 (% SHARE)
    510. WATER TREATMENT SYSTEMS POINT OF ENTRY MARKET, BY REGIONAL, 2019 TO 2032 (USD
    511. Billions)

    Water Treatment Systems Point of Entry Market Segmentation

    Water Treatment Systems Point of Entry Market By Technology (USD Billion, 2019-2032)

    • Membrane Filtration
    • Granular Activated Carbon (GAC)
    • Ion Exchange
    • Ultraviolet (UV) Disinfection
    • Distillation


    Water Treatment Systems Point of Entry Market By Application (USD Billion, 2019-2032)

    • Residential
    • Commercial
    • Industrial
    • Municipal


    Water Treatment Systems Point of Entry Market By Contaminant Removal (USD Billion, 2019-2032)

    • Chlorine
    • Fluoride
    • Heavy Metals
    • Bacteria
    • Viruses


    Water Treatment Systems Point of Entry Market By Capacity (USD Billion, 2019-2032)

    • = 100,000 liters per day (LPD)
    • 100,000 - 500,000 LPD
    • 500,000 - 1,000,000 LPD
    • > 1,000,000 LPD


    Water Treatment Systems Point of Entry Market By Installation Type (USD Billion, 2019-2032)

    • Under-sink
    • Whole-house
    • Commercial
    • Industrial


    Water Treatment Systems Point of Entry Market By Regional (USD Billion, 2019-2032)

    • North America
    • Europe
    • South America
    • Asia Pacific
    • Middle East and Africa

    Water Treatment Systems Point of Entry Market Regional Outlook (USD Billion, 2019-2032)


    • North America Outlook (USD Billion, 2019-2032)

      • North America Water Treatment Systems Point of Entry Market by Technology Type

        • Membrane Filtration
        • Granular Activated Carbon (GAC)
        • Ion Exchange
        • Ultraviolet (UV) Disinfection
        • Distillation
      • North America Water Treatment Systems Point of Entry Market by Application Type

        • Residential
        • Commercial
        • Industrial
        • Municipal
      • North America Water Treatment Systems Point of Entry Market by Contaminant Removal Type

        • Chlorine
        • Fluoride
        • Heavy Metals
        • Bacteria
        • Viruses
      • North America Water Treatment Systems Point of Entry Market by Capacity Type

        • = 100,000 liters per day (LPD)
        • 100,000 - 500,000 LPD
        • 500,000 - 1,000,000 LPD
        • > 1,000,000 LPD
      • North America Water Treatment Systems Point of Entry Market by Installation Type

        • Under-sink
        • Whole-house
        • Commercial
        • Industrial
      • North America Water Treatment Systems Point of Entry Market by Regional Type

        • US
        • Canada
      • US Outlook (USD Billion, 2019-2032)
      • US Water Treatment Systems Point of Entry Market by Technology Type

        • Membrane Filtration
        • Granular Activated Carbon (GAC)
        • Ion Exchange
        • Ultraviolet (UV) Disinfection
        • Distillation
      • US Water Treatment Systems Point of Entry Market by Application Type

        • Residential
        • Commercial
        • Industrial
        • Municipal
      • US Water Treatment Systems Point of Entry Market by Contaminant Removal Type

        • Chlorine
        • Fluoride
        • Heavy Metals
        • Bacteria
        • Viruses
      • US Water Treatment Systems Point of Entry Market by Capacity Type

        • = 100,000 liters per day (LPD)
        • 100,000 - 500,000 LPD
        • 500,000 - 1,000,000 LPD
        • > 1,000,000 LPD
      • US Water Treatment Systems Point of Entry Market by Installation Type

        • Under-sink
        • Whole-house
        • Commercial
        • Industrial
      • CANADA Outlook (USD Billion, 2019-2032)
      • CANADA Water Treatment Systems Point of Entry Market by Technology Type

        • Membrane Filtration
        • Granular Activated Carbon (GAC)
        • Ion Exchange
        • Ultraviolet (UV) Disinfection
        • Distillation
      • CANADA Water Treatment Systems Point of Entry Market by Application Type

        • Residential
        • Commercial
        • Industrial
        • Municipal
      • CANADA Water Treatment Systems Point of Entry Market by Contaminant Removal Type

        • Chlorine
        • Fluoride
        • Heavy Metals
        • Bacteria
        • Viruses
      • CANADA Water Treatment Systems Point of Entry Market by Capacity Type

        • = 100,000 liters per day (LPD)
        • 100,000 - 500,000 LPD
        • 500,000 - 1,000,000 LPD
        • > 1,000,000 LPD
      • CANADA Water Treatment Systems Point of Entry Market by Installation Type

        • Under-sink
        • Whole-house
        • Commercial
        • Industrial
    • Europe Outlook (USD Billion, 2019-2032)

      • Europe Water Treatment Systems Point of Entry Market by Technology Type

        • Membrane Filtration
        • Granular Activated Carbon (GAC)
        • Ion Exchange
        • Ultraviolet (UV) Disinfection
        • Distillation
      • Europe Water Treatment Systems Point of Entry Market by Application Type

        • Residential
        • Commercial
        • Industrial
        • Municipal
      • Europe Water Treatment Systems Point of Entry Market by Contaminant Removal Type

        • Chlorine
        • Fluoride
        • Heavy Metals
        • Bacteria
        • Viruses
      • Europe Water Treatment Systems Point of Entry Market by Capacity Type

        • = 100,000 liters per day (LPD)
        • 100,000 - 500,000 LPD
        • 500,000 - 1,000,000 LPD
        • > 1,000,000 LPD
      • Europe Water Treatment Systems Point of Entry Market by Installation Type

        • Under-sink
        • Whole-house
        • Commercial
        • Industrial
      • Europe Water Treatment Systems Point of Entry Market by Regional Type

        • Germany
        • UK
        • France
        • Russia
        • Italy
        • Spain
        • Rest of Europe
      • GERMANY Outlook (USD Billion, 2019-2032)
      • GERMANY Water Treatment Systems Point of Entry Market by Technology Type

        • Membrane Filtration
        • Granular Activated Carbon (GAC)
        • Ion Exchange
        • Ultraviolet (UV) Disinfection
        • Distillation
      • GERMANY Water Treatment Systems Point of Entry Market by Application Type

        • Residential
        • Commercial
        • Industrial
        • Municipal
      • GERMANY Water Treatment Systems Point of Entry Market by Contaminant Removal Type

        • Chlorine
        • Fluoride
        • Heavy Metals
        • Bacteria
        • Viruses
      • GERMANY Water Treatment Systems Point of Entry Market by Capacity Type

        • = 100,000 liters per day (LPD)
        • 100,000 - 500,000 LPD
        • 500,000 - 1,000,000 LPD
        • > 1,000,000 LPD
      • GERMANY Water Treatment Systems Point of Entry Market by Installation Type

        • Under-sink
        • Whole-house
        • Commercial
        • Industrial
      • UK Outlook (USD Billion, 2019-2032)
      • UK Water Treatment Systems Point of Entry Market by Technology Type

        • Membrane Filtration
        • Granular Activated Carbon (GAC)
        • Ion Exchange
        • Ultraviolet (UV) Disinfection
        • Distillation
      • UK Water Treatment Systems Point of Entry Market by Application Type

        • Residential
        • Commercial
        • Industrial
        • Municipal
      • UK Water Treatment Systems Point of Entry Market by Contaminant Removal Type

        • Chlorine
        • Fluoride
        • Heavy Metals
        • Bacteria
        • Viruses
      • UK Water Treatment Systems Point of Entry Market by Capacity Type

        • = 100,000 liters per day (LPD)
        • 100,000 - 500,000 LPD
        • 500,000 - 1,000,000 LPD
        • > 1,000,000 LPD
      • UK Water Treatment Systems Point of Entry Market by Installation Type

        • Under-sink
        • Whole-house
        • Commercial
        • Industrial
      • FRANCE Outlook (USD Billion, 2019-2032)
      • FRANCE Water Treatment Systems Point of Entry Market by Technology Type

        • Membrane Filtration
        • Granular Activated Carbon (GAC)
        • Ion Exchange
        • Ultraviolet (UV) Disinfection
        • Distillation
      • FRANCE Water Treatment Systems Point of Entry Market by Application Type

        • Residential
        • Commercial
        • Industrial
        • Municipal
      • FRANCE Water Treatment Systems Point of Entry Market by Contaminant Removal Type

        • Chlorine
        • Fluoride
        • Heavy Metals
        • Bacteria
        • Viruses
      • FRANCE Water Treatment Systems Point of Entry Market by Capacity Type

        • = 100,000 liters per day (LPD)
        • 100,000 - 500,000 LPD
        • 500,000 - 1,000,000 LPD
        • > 1,000,000 LPD
      • FRANCE Water Treatment Systems Point of Entry Market by Installation Type

        • Under-sink
        • Whole-house
        • Commercial
        • Industrial
      • RUSSIA Outlook (USD Billion, 2019-2032)
      • RUSSIA Water Treatment Systems Point of Entry Market by Technology Type

        • Membrane Filtration
        • Granular Activated Carbon (GAC)
        • Ion Exchange
        • Ultraviolet (UV) Disinfection
        • Distillation
      • RUSSIA Water Treatment Systems Point of Entry Market by Application Type

        • Residential
        • Commercial
        • Industrial
        • Municipal
      • RUSSIA Water Treatment Systems Point of Entry Market by Contaminant Removal Type

        • Chlorine
        • Fluoride
        • Heavy Metals
        • Bacteria
        • Viruses
      • RUSSIA Water Treatment Systems Point of Entry Market by Capacity Type

        • = 100,000 liters per day (LPD)
        • 100,000 - 500,000 LPD
        • 500,000 - 1,000,000 LPD
        • > 1,000,000 LPD
      • RUSSIA Water Treatment Systems Point of Entry Market by Installation Type

        • Under-sink
        • Whole-house
        • Commercial
        • Industrial
      • ITALY Outlook (USD Billion, 2019-2032)
      • ITALY Water Treatment Systems Point of Entry Market by Technology Type

        • Membrane Filtration
        • Granular Activated Carbon (GAC)
        • Ion Exchange
        • Ultraviolet (UV) Disinfection
        • Distillation
      • ITALY Water Treatment Systems Point of Entry Market by Application Type

        • Residential
        • Commercial
        • Industrial
        • Municipal
      • ITALY Water Treatment Systems Point of Entry Market by Contaminant Removal Type

        • Chlorine
        • Fluoride
        • Heavy Metals
        • Bacteria
        • Viruses
      • ITALY Water Treatment Systems Point of Entry Market by Capacity Type

        • = 100,000 liters per day (LPD)
        • 100,000 - 500,000 LPD
        • 500,000 - 1,000,000 LPD
        • > 1,000,000 LPD
      • ITALY Water Treatment Systems Point of Entry Market by Installation Type

        • Under-sink
        • Whole-house
        • Commercial
        • Industrial
      • SPAIN Outlook (USD Billion, 2019-2032)
      • SPAIN Water Treatment Systems Point of Entry Market by Technology Type

        • Membrane Filtration
        • Granular Activated Carbon (GAC)
        • Ion Exchange
        • Ultraviolet (UV) Disinfection
        • Distillation
      • SPAIN Water Treatment Systems Point of Entry Market by Application Type

        • Residential
        • Commercial
        • Industrial
        • Municipal
      • SPAIN Water Treatment Systems Point of Entry Market by Contaminant Removal Type

        • Chlorine
        • Fluoride
        • Heavy Metals
        • Bacteria
        • Viruses
      • SPAIN Water Treatment Systems Point of Entry Market by Capacity Type

        • = 100,000 liters per day (LPD)
        • 100,000 - 500,000 LPD
        • 500,000 - 1,000,000 LPD
        • > 1,000,000 LPD
      • SPAIN Water Treatment Systems Point of Entry Market by Installation Type

        • Under-sink
        • Whole-house
        • Commercial
        • Industrial
      • REST OF EUROPE Outlook (USD Billion, 2019-2032)
      • REST OF EUROPE Water Treatment Systems Point of Entry Market by Technology Type

        • Membrane Filtration
        • Granular Activated Carbon (GAC)
        • Ion Exchange
        • Ultraviolet (UV) Disinfection
        • Distillation
      • REST OF EUROPE Water Treatment Systems Point of Entry Market by Application Type

        • Residential
        • Commercial
        • Industrial
        • Municipal
      • REST OF EUROPE Water Treatment Systems Point of Entry Market by Contaminant Removal Type

        • Chlorine
        • Fluoride
        • Heavy Metals
        • Bacteria
        • Viruses
      • REST OF EUROPE Water Treatment Systems Point of Entry Market by Capacity Type

        • = 100,000 liters per day (LPD)
        • 100,000 - 500,000 LPD
        • 500,000 - 1,000,000 LPD
        • > 1,000,000 LPD
      • REST OF EUROPE Water Treatment Systems Point of Entry Market by Installation Type

        • Under-sink
        • Whole-house
        • Commercial
        • Industrial
    • APAC Outlook (USD Billion, 2019-2032)

      • APAC Water Treatment Systems Point of Entry Market by Technology Type

        • Membrane Filtration
        • Granular Activated Carbon (GAC)
        • Ion Exchange
        • Ultraviolet (UV) Disinfection
        • Distillation
      • APAC Water Treatment Systems Point of Entry Market by Application Type

        • Residential
        • Commercial
        • Industrial
        • Municipal
      • APAC Water Treatment Systems Point of Entry Market by Contaminant Removal Type

        • Chlorine
        • Fluoride
        • Heavy Metals
        • Bacteria
        • Viruses
      • APAC Water Treatment Systems Point of Entry Market by Capacity Type

        • = 100,000 liters per day (LPD)
        • 100,000 - 500,000 LPD
        • 500,000 - 1,000,000 LPD
        • > 1,000,000 LPD
      • APAC Water Treatment Systems Point of Entry Market by Installation Type

        • Under-sink
        • Whole-house
        • Commercial
        • Industrial
      • APAC Water Treatment Systems Point of Entry Market by Regional Type

        • China
        • India
        • Japan
        • South Korea
        • Malaysia
        • Thailand
        • Indonesia
        • Rest of APAC
      • CHINA Outlook (USD Billion, 2019-2032)
      • CHINA Water Treatment Systems Point of Entry Market by Technology Type

        • Membrane Filtration
        • Granular Activated Carbon (GAC)
        • Ion Exchange
        • Ultraviolet (UV) Disinfection
        • Distillation
      • CHINA Water Treatment Systems Point of Entry Market by Application Type

        • Residential
        • Commercial
        • Industrial
        • Municipal
      • CHINA Water Treatment Systems Point of Entry Market by Contaminant Removal Type

        • Chlorine
        • Fluoride
        • Heavy Metals
        • Bacteria
        • Viruses
      • CHINA Water Treatment Systems Point of Entry Market by Capacity Type

        • = 100,000 liters per day (LPD)
        • 100,000 - 500,000 LPD
        • 500,000 - 1,000,000 LPD
        • > 1,000,000 LPD
      • CHINA Water Treatment Systems Point of Entry Market by Installation Type

        • Under-sink
        • Whole-house
        • Commercial
        • Industrial
      • INDIA Outlook (USD Billion, 2019-2032)
      • INDIA Water Treatment Systems Point of Entry Market by Technology Type

        • Membrane Filtration
        • Granular Activated Carbon (GAC)
        • Ion Exchange
        • Ultraviolet (UV) Disinfection
        • Distillation
      • INDIA Water Treatment Systems Point of Entry Market by Application Type

        • Residential
        • Commercial
        • Industrial
        • Municipal
      • INDIA Water Treatment Systems Point of Entry Market by Contaminant Removal Type

        • Chlorine
        • Fluoride
        • Heavy Metals
        • Bacteria
        • Viruses
      • INDIA Water Treatment Systems Point of Entry Market by Capacity Type

        • = 100,000 liters per day (LPD)
        • 100,000 - 500,000 LPD
        • 500,000 - 1,000,000 LPD
        • > 1,000,000 LPD
      • INDIA Water Treatment Systems Point of Entry Market by Installation Type

        • Under-sink
        • Whole-house
        • Commercial
        • Industrial
      • JAPAN Outlook (USD Billion, 2019-2032)
      • JAPAN Water Treatment Systems Point of Entry Market by Technology Type

        • Membrane Filtration
        • Granular Activated Carbon (GAC)
        • Ion Exchange
        • Ultraviolet (UV) Disinfection
        • Distillation
      • JAPAN Water Treatment Systems Point of Entry Market by Application Type

        • Residential
        • Commercial
        • Industrial
        • Municipal
      • JAPAN Water Treatment Systems Point of Entry Market by Contaminant Removal Type

        • Chlorine
        • Fluoride
        • Heavy Metals
        • Bacteria
        • Viruses
      • JAPAN Water Treatment Systems Point of Entry Market by Capacity Type

        • = 100,000 liters per day (LPD)
        • 100,000 - 500,000 LPD
        • 500,000 - 1,000,000 LPD
        • > 1,000,000 LPD
      • JAPAN Water Treatment Systems Point of Entry Market by Installation Type

        • Under-sink
        • Whole-house
        • Commercial
        • Industrial
      • SOUTH KOREA Outlook (USD Billion, 2019-2032)
      • SOUTH KOREA Water Treatment Systems Point of Entry Market by Technology Type

        • Membrane Filtration
        • Granular Activated Carbon (GAC)
        • Ion Exchange
        • Ultraviolet (UV) Disinfection
        • Distillation
      • SOUTH KOREA Water Treatment Systems Point of Entry Market by Application Type

        • Residential
        • Commercial
        • Industrial
        • Municipal
      • SOUTH KOREA Water Treatment Systems Point of Entry Market by Contaminant Removal Type

        • Chlorine
        • Fluoride
        • Heavy Metals
        • Bacteria
        • Viruses
      • SOUTH KOREA Water Treatment Systems Point of Entry Market by Capacity Type

        • = 100,000 liters per day (LPD)
        • 100,000 - 500,000 LPD
        • 500,000 - 1,000,000 LPD
        • > 1,000,000 LPD
      • SOUTH KOREA Water Treatment Systems Point of Entry Market by Installation Type

        • Under-sink
        • Whole-house
        • Commercial
        • Industrial
      • MALAYSIA Outlook (USD Billion, 2019-2032)
      • MALAYSIA Water Treatment Systems Point of Entry Market by Technology Type

        • Membrane Filtration
        • Granular Activated Carbon (GAC)
        • Ion Exchange
        • Ultraviolet (UV) Disinfection
        • Distillation
      • MALAYSIA Water Treatment Systems Point of Entry Market by Application Type

        • Residential
        • Commercial
        • Industrial
        • Municipal
      • MALAYSIA Water Treatment Systems Point of Entry Market by Contaminant Removal Type

        • Chlorine
        • Fluoride
        • Heavy Metals
        • Bacteria
        • Viruses
      • MALAYSIA Water Treatment Systems Point of Entry Market by Capacity Type

        • = 100,000 liters per day (LPD)
        • 100,000 - 500,000 LPD
        • 500,000 - 1,000,000 LPD
        • > 1,000,000 LPD
      • MALAYSIA Water Treatment Systems Point of Entry Market by Installation Type

        • Under-sink
        • Whole-house
        • Commercial
        • Industrial
      • THAILAND Outlook (USD Billion, 2019-2032)
      • THAILAND Water Treatment Systems Point of Entry Market by Technology Type

        • Membrane Filtration
        • Granular Activated Carbon (GAC)
        • Ion Exchange
        • Ultraviolet (UV) Disinfection
        • Distillation
      • THAILAND Water Treatment Systems Point of Entry Market by Application Type

        • Residential
        • Commercial
        • Industrial
        • Municipal
      • THAILAND Water Treatment Systems Point of Entry Market by Contaminant Removal Type

        • Chlorine
        • Fluoride
        • Heavy Metals
        • Bacteria
        • Viruses
      • THAILAND Water Treatment Systems Point of Entry Market by Capacity Type

        • = 100,000 liters per day (LPD)
        • 100,000 - 500,000 LPD
        • 500,000 - 1,000,000 LPD
        • > 1,000,000 LPD
      • THAILAND Water Treatment Systems Point of Entry Market by Installation Type

        • Under-sink
        • Whole-house
        • Commercial
        • Industrial
      • INDONESIA Outlook (USD Billion, 2019-2032)
      • INDONESIA Water Treatment Systems Point of Entry Market by Technology Type

        • Membrane Filtration
        • Granular Activated Carbon (GAC)
        • Ion Exchange
        • Ultraviolet (UV) Disinfection
        • Distillation
      • INDONESIA Water Treatment Systems Point of Entry Market by Application Type

        • Residential
        • Commercial
        • Industrial
        • Municipal
      • INDONESIA Water Treatment Systems Point of Entry Market by Contaminant Removal Type

        • Chlorine
        • Fluoride
        • Heavy Metals
        • Bacteria
        • Viruses
      • INDONESIA Water Treatment Systems Point of Entry Market by Capacity Type

        • = 100,000 liters per day (LPD)
        • 100,000 - 500,000 LPD
        • 500,000 - 1,000,000 LPD
        • > 1,000,000 LPD
      • INDONESIA Water Treatment Systems Point of Entry Market by Installation Type

        • Under-sink
        • Whole-house
        • Commercial
        • Industrial
      • REST OF APAC Outlook (USD Billion, 2019-2032)
      • REST OF APAC Water Treatment Systems Point of Entry Market by Technology Type

        • Membrane Filtration
        • Granular Activated Carbon (GAC)
        • Ion Exchange
        • Ultraviolet (UV) Disinfection
        • Distillation
      • REST OF APAC Water Treatment Systems Point of Entry Market by Application Type

        • Residential
        • Commercial
        • Industrial
        • Municipal
      • REST OF APAC Water Treatment Systems Point of Entry Market by Contaminant Removal Type

        • Chlorine
        • Fluoride
        • Heavy Metals
        • Bacteria
        • Viruses
      • REST OF APAC Water Treatment Systems Point of Entry Market by Capacity Type

        • = 100,000 liters per day (LPD)
        • 100,000 - 500,000 LPD
        • 500,000 - 1,000,000 LPD
        • > 1,000,000 LPD
      • REST OF APAC Water Treatment Systems Point of Entry Market by Installation Type

        • Under-sink
        • Whole-house
        • Commercial
        • Industrial
    • South America Outlook (USD Billion, 2019-2032)

      • South America Water Treatment Systems Point of Entry Market by Technology Type

        • Membrane Filtration
        • Granular Activated Carbon (GAC)
        • Ion Exchange
        • Ultraviolet (UV) Disinfection
        • Distillation
      • South America Water Treatment Systems Point of Entry Market by Application Type

        • Residential
        • Commercial
        • Industrial
        • Municipal
      • South America Water Treatment Systems Point of Entry Market by Contaminant Removal Type

        • Chlorine
        • Fluoride
        • Heavy Metals
        • Bacteria
        • Viruses
      • South America Water Treatment Systems Point of Entry Market by Capacity Type

        • = 100,000 liters per day (LPD)
        • 100,000 - 500,000 LPD
        • 500,000 - 1,000,000 LPD
        • > 1,000,000 LPD
      • South America Water Treatment Systems Point of Entry Market by Installation Type

        • Under-sink
        • Whole-house
        • Commercial
        • Industrial
      • South America Water Treatment Systems Point of Entry Market by Regional Type

        • Brazil
        • Mexico
        • Argentina
        • Rest of South America
      • BRAZIL Outlook (USD Billion, 2019-2032)
      • BRAZIL Water Treatment Systems Point of Entry Market by Technology Type

        • Membrane Filtration
        • Granular Activated Carbon (GAC)
        • Ion Exchange
        • Ultraviolet (UV) Disinfection
        • Distillation
      • BRAZIL Water Treatment Systems Point of Entry Market by Application Type

        • Residential
        • Commercial
        • Industrial
        • Municipal
      • BRAZIL Water Treatment Systems Point of Entry Market by Contaminant Removal Type

        • Chlorine
        • Fluoride
        • Heavy Metals
        • Bacteria
        • Viruses
      • BRAZIL Water Treatment Systems Point of Entry Market by Capacity Type

        • = 100,000 liters per day (LPD)
        • 100,000 - 500,000 LPD
        • 500,000 - 1,000,000 LPD
        • > 1,000,000 LPD
      • BRAZIL Water Treatment Systems Point of Entry Market by Installation Type

        • Under-sink
        • Whole-house
        • Commercial
        • Industrial
      • MEXICO Outlook (USD Billion, 2019-2032)
      • MEXICO Water Treatment Systems Point of Entry Market by Technology Type

        • Membrane Filtration
        • Granular Activated Carbon (GAC)
        • Ion Exchange
        • Ultraviolet (UV) Disinfection
        • Distillation
      • MEXICO Water Treatment Systems Point of Entry Market by Application Type

        • Residential
        • Commercial
        • Industrial
        • Municipal
      • MEXICO Water Treatment Systems Point of Entry Market by Contaminant Removal Type

        • Chlorine
        • Fluoride
        • Heavy Metals
        • Bacteria
        • Viruses
      • MEXICO Water Treatment Systems Point of Entry Market by Capacity Type

        • = 100,000 liters per day (LPD)
        • 100,000 - 500,000 LPD
        • 500,000 - 1,000,000 LPD
        • > 1,000,000 LPD
      • MEXICO Water Treatment Systems Point of Entry Market by Installation Type

        • Under-sink
        • Whole-house
        • Commercial
        • Industrial
      • ARGENTINA Outlook (USD Billion, 2019-2032)
      • ARGENTINA Water Treatment Systems Point of Entry Market by Technology Type

        • Membrane Filtration
        • Granular Activated Carbon (GAC)
        • Ion Exchange
        • Ultraviolet (UV) Disinfection
        • Distillation
      • ARGENTINA Water Treatment Systems Point of Entry Market by Application Type

        • Residential
        • Commercial
        • Industrial
        • Municipal
      • ARGENTINA Water Treatment Systems Point of Entry Market by Contaminant Removal Type

        • Chlorine
        • Fluoride
        • Heavy Metals
        • Bacteria
        • Viruses
      • ARGENTINA Water Treatment Systems Point of Entry Market by Capacity Type

        • = 100,000 liters per day (LPD)
        • 100,000 - 500,000 LPD
        • 500,000 - 1,000,000 LPD
        • > 1,000,000 LPD
      • ARGENTINA Water Treatment Systems Point of Entry Market by Installation Type

        • Under-sink
        • Whole-house
        • Commercial
        • Industrial
      • REST OF SOUTH AMERICA Outlook (USD Billion, 2019-2032)
      • REST OF SOUTH AMERICA Water Treatment Systems Point of Entry Market by Technology Type

        • Membrane Filtration
        • Granular Activated Carbon (GAC)
        • Ion Exchange
        • Ultraviolet (UV) Disinfection
        • Distillation
      • REST OF SOUTH AMERICA Water Treatment Systems Point of Entry Market by Application Type

        • Residential
        • Commercial
        • Industrial
        • Municipal
      • REST OF SOUTH AMERICA Water Treatment Systems Point of Entry Market by Contaminant Removal Type

        • Chlorine
        • Fluoride
        • Heavy Metals
        • Bacteria
        • Viruses
      • REST OF SOUTH AMERICA Water Treatment Systems Point of Entry Market by Capacity Type

        • = 100,000 liters per day (LPD)
        • 100,000 - 500,000 LPD
        • 500,000 - 1,000,000 LPD
        • > 1,000,000 LPD
      • REST OF SOUTH AMERICA Water Treatment Systems Point of Entry Market by Installation Type

        • Under-sink
        • Whole-house
        • Commercial
        • Industrial
    • MEA Outlook (USD Billion, 2019-2032)

      • MEA Water Treatment Systems Point of Entry Market by Technology Type

        • Membrane Filtration
        • Granular Activated Carbon (GAC)
        • Ion Exchange
        • Ultraviolet (UV) Disinfection
        • Distillation
      • MEA Water Treatment Systems Point of Entry Market by Application Type

        • Residential
        • Commercial
        • Industrial
        • Municipal
      • MEA Water Treatment Systems Point of Entry Market by Contaminant Removal Type

        • Chlorine
        • Fluoride
        • Heavy Metals
        • Bacteria
        • Viruses
      • MEA Water Treatment Systems Point of Entry Market by Capacity Type

        • = 100,000 liters per day (LPD)
        • 100,000 - 500,000 LPD
        • 500,000 - 1,000,000 LPD
        • > 1,000,000 LPD
      • MEA Water Treatment Systems Point of Entry Market by Installation Type

        • Under-sink
        • Whole-house
        • Commercial
        • Industrial
      • MEA Water Treatment Systems Point of Entry Market by Regional Type

        • GCC Countries
        • South Africa
        • Rest of MEA
      • GCC COUNTRIES Outlook (USD Billion, 2019-2032)
      • GCC COUNTRIES Water Treatment Systems Point of Entry Market by Technology Type

        • Membrane Filtration
        • Granular Activated Carbon (GAC)
        • Ion Exchange
        • Ultraviolet (UV) Disinfection
        • Distillation
      • GCC COUNTRIES Water Treatment Systems Point of Entry Market by Application Type

        • Residential
        • Commercial
        • Industrial
        • Municipal
      • GCC COUNTRIES Water Treatment Systems Point of Entry Market by Contaminant Removal Type

        • Chlorine
        • Fluoride
        • Heavy Metals
        • Bacteria
        • Viruses
      • GCC COUNTRIES Water Treatment Systems Point of Entry Market by Capacity Type

        • = 100,000 liters per day (LPD)
        • 100,000 - 500,000 LPD
        • 500,000 - 1,000,000 LPD
        • > 1,000,000 LPD
      • GCC COUNTRIES Water Treatment Systems Point of Entry Market by Installation Type

        • Under-sink
        • Whole-house
        • Commercial
        • Industrial
      • SOUTH AFRICA Outlook (USD Billion, 2019-2032)
      • SOUTH AFRICA Water Treatment Systems Point of Entry Market by Technology Type

        • Membrane Filtration
        • Granular Activated Carbon (GAC)
        • Ion Exchange
        • Ultraviolet (UV) Disinfection
        • Distillation
      • SOUTH AFRICA Water Treatment Systems Point of Entry Market by Application Type

        • Residential
        • Commercial
        • Industrial
        • Municipal
      • SOUTH AFRICA Water Treatment Systems Point of Entry Market by Contaminant Removal Type

        • Chlorine
        • Fluoride
        • Heavy Metals
        • Bacteria
        • Viruses
      • SOUTH AFRICA Water Treatment Systems Point of Entry Market by Capacity Type

        • = 100,000 liters per day (LPD)
        • 100,000 - 500,000 LPD
        • 500,000 - 1,000,000 LPD
        • > 1,000,000 LPD
      • SOUTH AFRICA Water Treatment Systems Point of Entry Market by Installation Type

        • Under-sink
        • Whole-house
        • Commercial
        • Industrial
      • REST OF MEA Outlook (USD Billion, 2019-2032)
      • REST OF MEA Water Treatment Systems Point of Entry Market by Technology Type

        • Membrane Filtration
        • Granular Activated Carbon (GAC)
        • Ion Exchange
        • Ultraviolet (UV) Disinfection
        • Distillation
      • REST OF MEA Water Treatment Systems Point of Entry Market by Application Type

        • Residential
        • Commercial
        • Industrial
        • Municipal
      • REST OF MEA Water Treatment Systems Point of Entry Market by Contaminant Removal Type

        • Chlorine
        • Fluoride
        • Heavy Metals
        • Bacteria
        • Viruses
      • REST OF MEA Water Treatment Systems Point of Entry Market by Capacity Type

        • = 100,000 liters per day (LPD)
        • 100,000 - 500,000 LPD
        • 500,000 - 1,000,000 LPD
        • > 1,000,000 LPD
      • REST OF MEA Water Treatment Systems Point of Entry Market by Installation Type

        • Under-sink
        • Whole-house
        • Commercial
        • Industrial


    Global Water Treatment Systems (Point of Entry)  Market Research Report - Forecast to 2034 Infographic
    Free Sample Request

    Kindly complete the form below to receive a free sample of this Report

    Customer Strories

    “I am very pleased with how market segments have been defined in a relevant way for my purposes (such as "Portable Freezers & refrigerators" and "last-mile"). In general the report is well structured. Thanks very much for your efforts.”

    Victoria Milne Founder
    Case Study

    Chemicals and Materials