Expansion in Oil and Gas Sector
The Polyacrylamide Market is poised for growth due to its increasing utilization in the oil and gas sector. Polyacrylamide Market is employed in enhanced oil recovery processes, where it serves to improve the efficiency of oil extraction. As global energy demands escalate, the oil and gas industry is likely to invest more in technologies that enhance production efficiency. Reports indicate that the demand for polyacrylamide in this sector could witness a compound annual growth rate of over 5% in the coming years. This expansion reflects the critical role that polyacrylamide plays in optimizing resource extraction, thereby bolstering the overall Polyacrylamide Market.
Technological Innovations in Production
Technological advancements in the production of polyacrylamide are likely to propel the Polyacrylamide Market forward. Innovations in polymerization techniques and the development of more efficient manufacturing processes can lead to reduced production costs and enhanced product quality. These advancements may also facilitate the introduction of new polyacrylamide formulations tailored for specific applications, thereby expanding the market's reach. As manufacturers adopt these technologies, the overall efficiency and sustainability of polyacrylamide production are expected to improve, potentially increasing market competitiveness. This trend indicates a promising future for the Polyacrylamide Market, as it adapts to evolving market demands.
Agricultural Applications and Soil Management
The Polyacrylamide Market is significantly influenced by its applications in agriculture, particularly in soil management and erosion control. Polyacrylamide Market is utilized to improve soil structure, enhance water retention, and reduce erosion, which is increasingly vital as agricultural practices evolve. The market for polyacrylamide in agriculture is projected to grow, with estimates suggesting a potential increase in demand by approximately 6% annually. This growth is driven by the need for sustainable agricultural practices that ensure food security while minimizing environmental impact. Consequently, the agricultural sector is becoming a key driver for the Polyacrylamide Market.
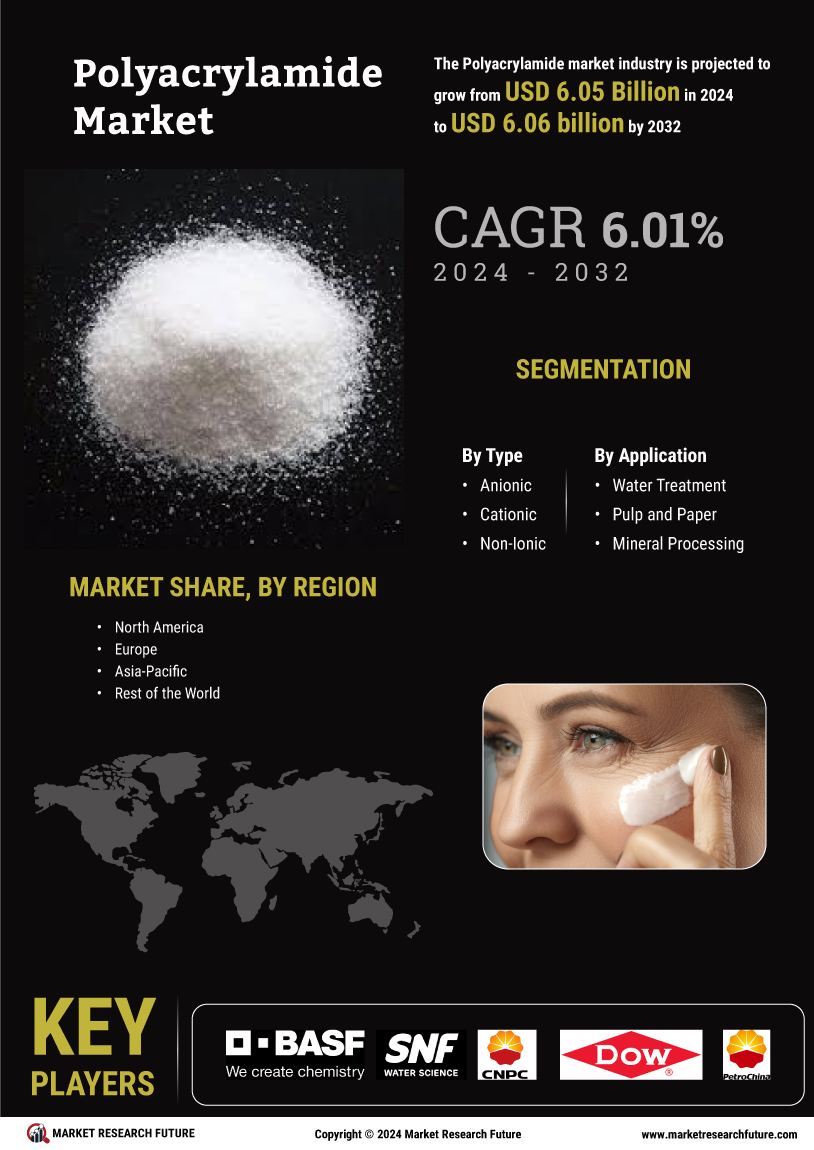
Rising Demand in Water Treatment Applications
The Polyacrylamide Market is experiencing a notable surge in demand, particularly in water treatment applications. This increase is largely attributed to the growing need for effective wastewater management solutions across various sectors, including municipal, industrial, and agricultural. As regulations surrounding water quality become more stringent, the adoption of polyacrylamide as a flocculant and coagulant is likely to rise. Recent estimates suggest that the water treatment segment could account for a significant portion of the overall market share, potentially exceeding 40% by 2026. This trend indicates a robust growth trajectory for the Polyacrylamide Market, driven by the necessity for cleaner water and sustainable practices.
Regulatory Support for Environmental Compliance
The Polyacrylamide Market is likely to benefit from increasing regulatory support aimed at environmental compliance. Governments worldwide are implementing stricter regulations regarding waste management and water quality, which in turn drives the demand for effective treatment solutions. Polyacrylamide Market, recognized for its efficacy in various applications, is positioned to meet these regulatory requirements. As industries strive to comply with environmental standards, the adoption of polyacrylamide is expected to rise, potentially leading to a market growth rate of around 4% annually. This regulatory landscape presents a favorable environment for the Polyacrylamide Market, encouraging investment and innovation.