• Cat-intel
  • MedIntelliX
  • Resources
  • About Us
  • Hero Background
    English
    Chinese
    French
    Japanese
    Korean
    German
    Spanish

    Polyacrylamide Market Analysis

    ID: MRFR/CnM/6438-CR
    140 Pages
    Priya Nagrale
    March 2023

    Polyacrylamide Market Research Report Information by Product Type (Anionic, Cationic, Non-Ionic),by type (Thermal, Acoustic, Electric, Others) by Application (Water Treatment, Pulp and Paper, Mineral Processing, Enhanced Oil Recovery, Others) And by Region (North America, Europe, Asia-Pacific, Latin America, and Middle east & Africa) - Forecast Till 2035

    Share:
    Download PDF ×

    We do not share your information with anyone. However, we may send you emails based on your report interest from time to time. You may contact us at any time to opt-out.

    Polyacrylamide Market Infographic
    Purchase Options

    Market Analysis

    In-depth Analysis of Polyacrylamide Market Industry Landscape

    The market dynamics of polyacrylamide reflect a complex interplay of factors that impact the supply, demand, and trends within the industry. Polyacrylamide, a versatile polymer with applications ranging from water treatment to enhanced oil recovery, plays a crucial role in various sectors. One of the primary drivers of the polyacrylamide market is the escalating demand for efficient water treatment solutions globally. With increasing concerns about water scarcity and environmental pollution, polyacrylamide finds extensive use in wastewater treatment processes, facilitating the removal of contaminants and ensuring the availability of clean water.

    The oil and gas industry also significantly influences the dynamics of the polyacrylamide market. In enhanced oil recovery applications, polyacrylamide polymers are employed to improve the viscosity of injected water, enhancing oil extraction efficiency. As global energy demand continues to rise, the demand for polyacrylamide in the oil and gas sector is expected to grow, contributing to the overall market dynamics.

    Environmental regulations play a pivotal role in shaping the polyacrylamide market dynamics, particularly in the water treatment sector. Stricter regulations on industrial wastewater discharge and a focus on sustainable practices drive the adoption of polyacrylamide as an effective solution for water clarification and purification. The polymer's ability to form large, stable flocs aids in the removal of suspended particles, organic matter, and other pollutants, aligning with regulatory requirements.

    Technological advancements in the production and application of polyacrylamide contribute to market dynamics. Ongoing research and development efforts focus on improving the polymer's performance characteristics, such as its flocculation efficiency and environmental compatibility. Innovations in polymer formulations and synthesis methods enhance the competitiveness of polyacrylamide products in the market, catering to the evolving needs of diverse industries.

    Raw material dynamics significantly impact the polyacrylamide market, with acrylamide being the primary raw material. Fluctuations in acrylamide prices due to factors like feedstock costs and market demand influence the overall production costs, subsequently affecting product pricing strategies. Additionally, geopolitical events and supply chain disruptions contribute to the complexity of raw material dynamics in the polyacrylamide market.

    Competitive dynamics within the polyacrylamide market involve a mix of major multinational corporations and regional players. Companies employ strategic initiatives such as mergers, acquisitions, and collaborations to strengthen their market presence and expand their product portfolios. The pursuit of cost-effective production methods and the development of customized solutions for specific applications form integral components of competitive strategies in the polyacrylamide market.

    Geographically, market dynamics vary across regions. Developed economies with stringent environmental regulations, such as North America and Europe, witness a higher adoption of polyacrylamide in water treatment applications. In contrast, emerging economies in Asia-Pacific and the Middle East experience robust growth due to increasing industrial activities, urbanization, and a rising awareness of the importance of water conservation.

    Consumer awareness and the demand for sustainable practices are influencing market dynamics, with end-users seeking products that align with environmental concerns. The water treatment sector's transition towards more eco-friendly solutions, including polyacrylamide, reflects the changing preferences of industries and communities striving for responsible water management.

    Author
    Priya Nagrale
    Senior Research Analyst

    With an experience of over five years in market research industry (Chemicals & Materials domain), I gather and analyze market data from diverse sources to produce results, which are then presented back to a client. Also, provide recommendations based on the findings. As a Senior Research Analyst, I perform quality checks (QC) for market estimations, QC for reports, and handle queries and work extensively on client customizations. Also, handle the responsibilities of client proposals, report planning, report finalization, and execution

    Leave a Comment

    FAQs

    How much is the Polyacrylamide market?

    The Polyacrylamide Market is USD 5.71 billion in 2023

    What is the growth rate of the Polyacrylamide market?

    The Polyacrylamide Market is expected to grow at a CAGR of 6.01%

    Which region held the largest market share in the Polyacrylamide market?

    Asia-Pacific held the largest market share in the Polyacrylamide market

    Which Product Type led the Polyacrylamide market?

    Anionic led the Polyacrylamide market

    Which Application had the largest market share in the Polyacrylamide market?

    Wastewater treatment had the largest market share in the Polyacrylamide market

    Market Summary

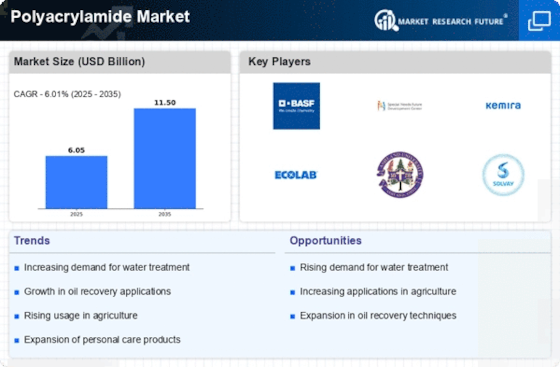
    As per MRFR analysis, the Polyacrylamide Market Size was estimated at 6.05 USD Billion in 2024. The Polyacrylamide industry is projected to grow from 6.414 USD Billion in 2025 to 11.5 USD Billion by 2035, exhibiting a compound annual growth rate (CAGR) of 6.01 during the forecast period 2025 - 2035.

    Key Market Trends & Highlights

    The Polyacrylamide Market is poised for growth driven by sustainability and technological advancements.

    • North America remains the largest market for polyacrylamide, primarily due to its extensive applications in water treatment.
    • Asia-Pacific is emerging as the fastest-growing region, fueled by increasing industrialization and agricultural innovations.
    • Anionic polyacrylamide continues to dominate the market, while cationic polyacrylamide is witnessing rapid growth in demand.
    • The rising demand in water treatment applications and expansion in the oil and gas sector are key drivers propelling market growth.

    Market Size & Forecast

    2024 Market Size 6.05 (USD Billion)
    2035 Market Size 11.5 (USD Billion)
    CAGR (2025 - 2035) 6.01%
    Largest Regional Market Share in 2024 Asia Pacific

    Major Players

    <p>BASF (DE), SNF Group (FR), Kemira (FI), Ecolab (US), Ashland (US), Solvay (BE), FMC Corporation (US), China National Petroleum Corporation (CN), Nippon Shokubai (JP)</p>

    Market Trends

    The Polyacrylamide Market is currently experiencing notable transformations driven by various factors. The increasing demand for water treatment solutions is a primary catalyst, as industries seek effective methods to manage wastewater and enhance water quality. This trend is further supported by stringent environmental regulations that compel companies to adopt sustainable practices. Additionally, the agricultural sector is witnessing a rising interest in polyacrylamide-based products, which are utilized to improve soil structure and moisture retention. This dual application in both industrial and agricultural domains suggests a robust growth trajectory for the market. Moreover, advancements in technology are likely to play a pivotal role in shaping the future of the Polyacrylamide Market. Innovations in production processes and formulations may lead to the development of more efficient and eco-friendly products. As stakeholders become increasingly aware of the environmental impact of chemical products, there is a growing emphasis on sustainable alternatives. This shift could potentially redefine market dynamics, encouraging manufacturers to invest in research and development to meet evolving consumer preferences. Overall, the Polyacrylamide Market appears poised for growth, driven by a combination of regulatory pressures, technological advancements, and changing consumer demands.

    Sustainable Practices in Water Treatment

    The Polyacrylamide Market is witnessing a shift towards sustainable practices, particularly in water treatment applications. As industries face increasing scrutiny regarding their environmental impact, the demand for eco-friendly polyacrylamide products is likely to rise. This trend reflects a broader commitment to sustainability, as companies seek to minimize their ecological footprint while ensuring compliance with regulations.

    Agricultural Innovations

    In the agricultural sector, the use of polyacrylamide is gaining traction as farmers look for innovative solutions to enhance crop yield and soil health. The ability of polyacrylamide to improve water retention and reduce erosion positions it as a valuable tool in modern farming practices. This trend indicates a growing recognition of the importance of sustainable agriculture.

    Technological Advancements

    Technological advancements are expected to significantly influence the Polyacrylamide Market. Innovations in production techniques and formulations may lead to the creation of more efficient and environmentally friendly products. As manufacturers adapt to changing market demands, the focus on research and development is likely to intensify, fostering a competitive landscape.

    <p>The global polyacrylamide market is poised for growth, driven by increasing demand in water treatment and enhanced oil recovery applications, suggesting a robust trajectory for the industry.</p>

    U.S. Geological Survey

    Polyacrylamide Market Market Drivers

    Expansion in Oil and Gas Sector

    The Polyacrylamide Market is poised for growth due to its increasing utilization in the oil and gas sector. Polyacrylamide is employed in enhanced oil recovery processes, where it serves to improve the efficiency of oil extraction. As global energy demands escalate, the oil and gas industry is likely to invest more in technologies that enhance production efficiency. Reports indicate that the demand for polyacrylamide in this sector could witness a compound annual growth rate of over 5 percent in the coming years. This expansion reflects the critical role that polyacrylamide plays in optimizing resource extraction, thereby bolstering the overall Polyacrylamide Market.

    Technological Innovations in Production

    Technological advancements in the production of polyacrylamide are likely to propel the Polyacrylamide Market forward. Innovations in polymerization techniques and the development of more efficient manufacturing processes can lead to reduced production costs and enhanced product quality. These advancements may also facilitate the introduction of new polyacrylamide formulations tailored for specific applications, thereby expanding the market's reach. As manufacturers adopt these technologies, the overall efficiency and sustainability of polyacrylamide production are expected to improve, potentially increasing market competitiveness. This trend indicates a promising future for the Polyacrylamide Market, as it adapts to evolving market demands.

    Agricultural Applications and Soil Management

    The Polyacrylamide Market is significantly influenced by its applications in agriculture, particularly in soil management and erosion control. Polyacrylamide is utilized to improve soil structure, enhance water retention, and reduce erosion, which is increasingly vital as agricultural practices evolve. The market for polyacrylamide in agriculture is projected to grow, with estimates suggesting a potential increase in demand by approximately 6 percent annually. This growth is driven by the need for sustainable agricultural practices that ensure food security while minimizing environmental impact. Consequently, the agricultural sector is becoming a key driver for the Polyacrylamide Market.

    Rising Demand in Water Treatment Applications

    The Polyacrylamide Market is experiencing a notable surge in demand, particularly in water treatment applications. This increase is largely attributed to the growing need for effective wastewater management solutions across various sectors, including municipal, industrial, and agricultural. As regulations surrounding water quality become more stringent, the adoption of polyacrylamide as a flocculant and coagulant is likely to rise. Recent estimates suggest that the water treatment segment could account for a significant portion of the overall market share, potentially exceeding 40 percent by 2026. This trend indicates a robust growth trajectory for the Polyacrylamide Market, driven by the necessity for cleaner water and sustainable practices.

    Regulatory Support for Environmental Compliance

    The Polyacrylamide Market is likely to benefit from increasing regulatory support aimed at environmental compliance. Governments worldwide are implementing stricter regulations regarding waste management and water quality, which in turn drives the demand for effective treatment solutions. Polyacrylamide, recognized for its efficacy in various applications, is positioned to meet these regulatory requirements. As industries strive to comply with environmental standards, the adoption of polyacrylamide is expected to rise, potentially leading to a market growth rate of around 4 percent annually. This regulatory landscape presents a favorable environment for the Polyacrylamide Market, encouraging investment and innovation.

    Market Segment Insights

    By Type: Anionic (Largest) vs. Cationic (Fastest-Growing)

    <p>In the Polyacrylamide Market, Anionic polyacrylamides dominate the segment, capturing a significant portion of the market share due to their widespread application in water treatment, soil stabilization, and enhanced oil recovery. Cationic polyacrylamides are also gaining traction, primarily used in the paper and textiles industries, albeit with a smaller share compared to their anionic counterparts. Non-ionic polyacrylamides present themselves as a niche but essential segment, often utilized in specific applications such as flocculation and clarification processes. The growth trends within the Polyacrylamide Market indicate a robust increase in demand for cationic polyacrylamides, which is being driven by advancements in wastewater treatment technologies and increased awareness of sustainable practices. As industries prioritize environmentally friendly solutions, the cationic variant is poised for significant expansion. Meanwhile, the anionic segment remains stable, maintaining its market dominance due to established applications and reliability in results, while non-ionic types see steady demand from specialized sectors.</p>

    <p>Cationic (Dominant) vs. Non-Ionic (Emerging)</p>

    <p>Cationic polyacrylamides are recognized as the dominant force in the Polyacrylamide Market, owing to their effectiveness in enhancing the performance of various industrial processes, particularly in water treatment and paper production. These polyacrylamides offer superior flocculation properties, which are essential for efficient sedimentation and filtration processes. Their cationic nature allows them to bond effectively with negatively charged particles, enhancing their effectiveness across a range of applications. Conversely, Non-Ionic polyacrylamides present an emerging opportunity within the market, gradually becoming favored in specific applications that require lower reactivity and greater stability. Their characteristics make them suitable for use in sensitive contexts, such as in food processing and pharmaceuticals, where neutrality is paramount. Together, these types of polyacrylamides represent the spectrum of capabilities within the market, from established dominance to emerging niches.</p>

    By Application: Water Treatment (Largest) vs. Enhanced Oil Recovery (Fastest-Growing)

    <p>In the Polyacrylamide Market, the application segments exhibit notable differentiation in market share. Water Treatment commands the largest share, reflecting its widespread use in municipal and industrial water treatment processes. Following closely is the Pulp and Paper sector, which utilizes polyacrylamides for improving efficiency in pulp bleaching and paper production. Mineral Processing, while smaller, plays a significant role in the extraction and recovery of minerals. Enhanced Oil Recovery, although a niche application, is rapidly gaining traction due to the rising demand for oil and gas recovery techniques.</p>

    <p>Water Treatment (Dominant) vs. Enhanced Oil Recovery (Emerging)</p>

    <p>Water Treatment stands out as a dominant application for polyacrylamide, as it is integral in the clarification and purification of water systems. Its effectiveness in coagulation and flocculation processes secures its position across various industries, contributing consistently to the market's stability. Enhanced Oil Recovery, while emerging, is increasingly pivotal due to the heightened need for efficient oil extraction methods. This application benefits from advancements in technologies that enhance oil yield and extend the life of oil fields, creating a growing market segment poised for further expansion.</p>

    Get more detailed insights about Polyacrylamide Market Research Report - Global Forecast till 2030

    Regional Insights

    By Region, the study segments the market into North America, Europe, Asia-Pacific, Latin America, and Middle east & Africa. Asia-Pacific Polyacrylamide market accounted for USD 1.78 billion in 2021 and is expected to exhibit an 5.59% CAGR during the study period. This is attributed to the robust base of pharmaceutical and chemical manufacturing industries in the region has resulted in huge volumes of wastewater, which is expected to propel the demand for polyacrylamide as a water treatment chemical.

    Further, the major countries studied are: The U.S, Canada, Germany, France, UK, Italy, Spain, China, Japan, India, Australia, South Korea, and Brazil.

    Figure 3: POLYACRYLAMIDE MARKET SHARE BY REGION 2021 (%)POLYACRYLAMIDE MARKET SHARE BY REGION 2021Source: Secondary Research, Primary Research, Market Research Future Database and Analyst Review

    Europe Polyacrylamide market accounts for the second-largest market share due to the growing investments in water recycling and purification technology. Further, the Germany Polyacrylamide market held the largest market share, and the UK Polyacrylamide market was the fastest growing market in the European region

    The Asia-Pacific Polyacrylamide Market is expected to grow at a CAGR of 5.59% from 2022 to 2030. This is because of the increasing demand of wastewater treatment for most of the industrial applications in developing nations like China and India. Moreover, China Polyacrylamide market held the largest market share, and the India Polyacrylamide market was the fastest growing market in the Asia-Pacific region

    For instance, India Polyacrylamide market is the favored destination for Polyacrylamide manufacturers due to the wastewater treatment. On the other hand, Japan is famous for the technology industry. Hence, Asia-Pacific is anticipated to register the highest growth rate over the forecast period from 2022–2030.

    Key Players and Competitive Insights

    Major market players are spending a lot of money on R&D to increase their product lines, which will help the Polyacrylamide market grow even more. Market participants are also taking a range of strategic initiatives to grow their worldwide footprint, including new product launches, contractual agreements, mergers and acquisitions, increased investments, and collaboration with other organizations. Competitors in the Polyacrylamide industry must offer cost-effective items to expand and survive in an increasingly competitive and rising market environment.

    One of the primary business strategies adopted by manufacturers in the global Polyacrylamide industry to benefit clients and expand the Polyacrylamide market sector is to manufacture locally to reduce operating costs. In recent years, Polyacrylamide has provided some of the most significant benefits.

    SNF (France) is a privately held, specialty chemical company based in the Rhone-Alpes region of France, with a long-standing presence on every continent. With 21 production sites in Europe, Asia, Australia, and America, with a production capacity of 1,325,000 tonnes, SNF has the largest polyacrylamide production capacity in the world. SNF products are sold into 130 countries, across every sector of the economy, with 70 subsidiaries located in more than 40 countries, in 3 major economic regions.

    In July 2022, Governor John Bel Edwards and SNF Holding Company President John Pittman confirmed the company is investing an additional $375 million to expand its water-treatment and water-conditioning polymer production plant near Plaquemine, Louisiana. With the investment, the company will retain 390 existing jobs while adding 150 positions with an average annual salary of $87,300, plus benefits. Louisiana Economic Development estimates that upon full employment of 540 jobs, the project will support 1,400 direct and indirect jobs in Iberville Parish and the broader Capital Region.

    Also, BASF SE (Germany) is one of the leading chemical producers in the world. Its portfolio is organized into six segments, namely, chemicals, materials, industrial solutions, surface technologies, nutrition & care, and agricultural solutions. The company has an extensive regional presence. It has subsidiaries and joint ventures in more than 80 countries and operates 390 production sites in Europe, Asia-Pacific, North America, and Africa. BASF has customers across more than 190 countries and supplies products to a range of industries. In April 2019, BASF expands production of polyacrylamide powder in Nanjing, China.

    The new fully owned asset in China expands BASF’s global PAM manufacturing footprint for the mining and oilfield industries which relies primarily on long term supply agreements with production units in Europe, North America and Australia.

    Key Companies in the Polyacrylamide Market market include

    Industry Developments

    April 2019 BASF expands production of polyacrylamide powder in Nanjing, China. The new fully owned asset in China expands BASF’s global PAM manufacturing footprint for the mining and oilfield industries which relies primarily on long term supply agreements with production units in Europe, North America and Australia.

    July 2018 BASF, one of the world leaders in the manufacturing of construction chemicals increased the production capacity of Neopor (expandable polystyrene containing graphite) by 40,000 metric tons per year through its two production sites in Ludwigshafen, Germany, and Ulsan, Korea. At the Ulsan site in Korea, BASF will switch the plant’s entire 85,000 metric tons capacity from white EPS (expandable polystyrene) Styropor to Neopor (grey EPS), which will help the company meet the growing demand for grey material in the Asian market.

    April 2023 Ashland Inc. announced the expansion of its polyacrylamide production capacity in China. The expansion is expected to be completed in the second half of 2023.

    June 2023 Kemira announced the acquisition of the polyacrylamide business of Nalco Water. The acquisition is expected to strengthen Kemira's position in the global polyacrylamide market.

    Future Outlook

    Polyacrylamide Market Future Outlook

    <p>The Polyacrylamide Market is projected to grow at a 6.01% CAGR from 2024 to 2035, driven by increasing demand in water treatment, agriculture, and oil recovery.</p>

    New opportunities lie in:

    • <p>Development of biodegradable polyacrylamide products for eco-friendly applications.</p>
    • <p>Expansion into emerging markets with tailored formulations for local industries.</p>
    • <p>Investment in advanced manufacturing technologies to enhance production efficiency.</p>

    <p>By 2035, the Polyacrylamide Market is expected to achieve robust growth, driven by innovation and strategic expansion.</p>

    Market Segmentation

    Polyacrylamide Market Type Outlook

    • Anionic
    • Cationic
    • Non-Ionic

    Polyacrylamide Market Application Outlook

    • Water Treatment
    • Pulp and Paper
    • Mineral Processing
    • Enhanced Oil Recovery
    • Others

    Report Scope

    MARKET SIZE 20246.05(USD Billion)
    MARKET SIZE 20256.414(USD Billion)
    MARKET SIZE 203511.5(USD Billion)
    COMPOUND ANNUAL GROWTH RATE (CAGR)6.01% (2024 - 2035)
    REPORT COVERAGERevenue Forecast, Competitive Landscape, Growth Factors, and Trends
    BASE YEAR2024
    Market Forecast Period2025 - 2035
    Historical Data2019 - 2024
    Market Forecast UnitsUSD Billion
    Key Companies ProfiledMarket analysis in progress
    Segments CoveredMarket segmentation analysis in progress
    Key Market OpportunitiesGrowing demand for sustainable water treatment solutions drives innovation in the Polyacrylamide Market.
    Key Market DynamicsRising demand for water treatment solutions drives innovation and competition in the polyacrylamide market.
    Countries CoveredNorth America, Europe, APAC, South America, MEA

    FAQs

    How much is the Polyacrylamide market?

    The Polyacrylamide Market is USD 5.71 billion in 2023

    What is the growth rate of the Polyacrylamide market?

    The Polyacrylamide Market is expected to grow at a CAGR of 6.01%

    Which region held the largest market share in the Polyacrylamide market?

    Asia-Pacific held the largest market share in the Polyacrylamide market

    Which Product Type led the Polyacrylamide market?

    Anionic led the Polyacrylamide market

    Which Application had the largest market share in the Polyacrylamide market?

    Wastewater treatment had the largest market share in the Polyacrylamide market

    1. EXECUTIVE SUMMARY.. 18
      1. \r\n
      2. MARKET ATTRACTIVENESS ANALYSIS. 20
        1. GLOBAL Polyacrylamide MARKET, BY product Type. 21
        2. GLOBAL Polyacrylamide MARKET, By application. 22
        3. GLOBAL Polyacrylamide MARKET, BY REGION. 23
      3. \r\n
      4. \r\n
      5. \r\n
      6. \r\n
    2. MARKET INTRODUCTION.. 24
      1. \r\n
      2. DEFINITION. 24
      3. \r\n
      4. SCOPE OF THE STUDY. 24
      5. \r\n
      6. Research Objective. 24
      7. \r\n
      8. MARKET STRUCTURE. 25
      9. \r\n
      10. KEY BUYING CRITERIA. 25
      11. \r\n
    3. RESEARCH METHODOLOGY.. 26
      1. \r\n
      2. RESEARCH PROCESS. 26
      3. \r\n
      4. PRIMARY RESEARCH. 27
      5. \r\n
      6. SECONDARY RESEARCH. 28
      7. \r\n
      8. MARKET SIZE ESTIMATION. 29
      9. \r\n
      10. FORECAST MODEL. 30
      11. \r\n
      12. List of Assumptions & Limitations. 31
      13. \r\n
    4. MARKET DYNAMICS.. 32
      1. \r\n
      2. INTRODUCTION. 32
      3. \r\n
      4. DRIVERS. 33
        1. increasing awareness regarding wastewater management and growing need to reduce soil erosion. 33
        2. DRIVERS IMPACT ANALYSIS. 34
      5. \r\n
      6. \r\n
      7. \r\n
      8. RESTRAINT. 34
        1. stringent regulations for use of arcylamide monomer. 34
        2. RESTRAINT IMPACT ANALYSIS. 35
      9. \r\n
      10. \r\n
      11. \r\n
      12. OPPORTUNITIES. 35
        1. increase in the demand for enhanced oil recovery. 35
      13. \r\n
      14. \r\n
      15. challenges. 36
        1. Anti-dumping duties. 36
      16. \r\n
      17. \r\n
    5. MARKET FACTOR ANALYSIS.. 37
      1. \r\n
      2. Supply CHAIN ANALYSIS. 37
        1. raw Material Scenario. 37
        2. Manufacture. 38
        3. Distribution & sales channel. 38
        4. End Users. 38
      3. \r\n
      4. \r\n
      5. \r\n
      6. \r\n
      7. \r\n
      8. \r\n
      9. \r\n
      10. PORTER’S FIVE FORCES MODEL. 39
        1. THREAT OF NEW ENTRANTS. 39
        2. BARGAINING POWER OF SUPPLIERS. 40
        3. BARGAINING POWER OF BUYERS. 40
        4. THREAT OF SUBSTITUTES. 40
        5. INTENSITY OF RIVALRY. 40
      11. \r\n
      12. \r\n
      13. \r\n
      14. \r\n
      15. \r\n
      16. \r\n
      17. impact of the COVID-19 outbreak on GLOBAL polyacrylamide market. 41
        1. Impact of covid-19 on Supply chain of polyacrylamide market. 41
        2. major goverment policies to counter the pandemic. 41
        3. qualitative analysis on change in demand from end-users. 42
      18. \r\n
      19. \r\n
      20. \r\n
      21. \r\n
      22. Pricing Overview of polyacrylamide (2019–2021) 42
      23. \r\n
    6. GLOBAL polyacrylamide MARKET, BY product type.. 43
      1. \r\n
      2. OVERVIEW.. 43
        1. GLOBAL POLYACRYLAMIDE MARKET ESTIMATES & FORECAST, BY product type, 2019–2030. 44
      3. \r\n
      4. \r\n
      5. Anionic. 45
        1. Anionic: MARKET ESTIMATES & FORECAST, BY REGION, 2019–2030. 45
      6. \r\n
      7. \r\n
      8. cationic. 47
        1. cationic: MARKET ESTIMATES & FORECAST, BY REGION, 2019–2030. 47
      9. \r\n
      10. \r\n
      11. non-ionic. 49
        1. non-ionic: MARKET ESTIMATES & FORECAST, BY REGION, 2019–2030. 49
      12. \r\n
      13. \r\n
    7. GLOBAL polyacrylamide MARKET, BY application.. 52
      1. \r\n
      2. OVERVIEW.. 52
        1. GLOBAL POLYACRYLAMIDE MARKET ESTIMATES & FORECAST, BY application, 2019–2030. 53
      3. \r\n
      4. \r\n
      5. Water Treatment. 55
        1. Water Treatment: MARKET ESTIMATES & FORECAST, BY REGION, 2019–2030. 55
      6. \r\n
      7. \r\n
      8. Pulp and Paper. 57
        1. Pulp and Paper: MARKET ESTIMATES & FORECAST, BY REGION, 2019–2030. 57
      9. \r\n
      10. \r\n
      11. Mineral Processing. 59
        1. Mineral Processing: MARKET ESTIMATES & FORECAST, BY REGION, 2019–2030. 59
      12. \r\n
      13. \r\n
      14. Enhanced Oil Recovery. 61
        1. Enhanced Oil Recovery: MARKET ESTIMATES & FORECAST, BY REGION, 2019–2030. 61
      15. \r\n
      16. \r\n
      17. Others. 63
        1. Others: MARKET ESTIMATES & FORECAST, BY REGION, 2019–2030. 63
      18. \r\n
      19. \r\n
    8. GLOBAL POLYACRYLAMIDE MARKET, BY REGION.. 66
      1. \r\n
      2. OVERVIEW.. 66
        1. global POLYACRYLAMIDE MARKET ESTIMATES & forecast, BY REGION, 2019–2030. 67
      3. \r\n
      4. \r\n
      5. NORTH AMERICA. 70
        1. US. 75
        2. Canada. 78
      6. \r\n
      7. \r\n
      8. \r\n
      9. europe. 82
        1. Germany. 87
        2. UK. 90
        3. france. 93
        4. russia. 96
        5. spain. 99
        6. italy. 102
        7. Rest of Europe. 105
      10. \r\n
      11. \r\n
      12. \r\n
      13. \r\n
      14. \r\n
      15. \r\n
      16. \r\n
      17. \r\n
      18. Asia-Pacific. 109
        1. china. 114
        2. Japan. 117
        3. India. 120
        4. South Korea. 123
        5. Australia & New Zealand. 126
        6. Rest of Asia-Pacific. 129
      19. \r\n
      20. \r\n
      21. \r\n
      22. \r\n
      23. \r\n
      24. \r\n
      25. \r\n
      26. Latin America. 133
        1. Brazil. 138
        2. Mexico. 141
        3. Argentina. 144
        4. Rest of Latin America. 147
      27. \r\n
      28. \r\n
      29. \r\n
      30. \r\n
      31. \r\n
      32. Middle East & Africa. 151
        1. Turkey. 156
        2. South Africa. 159
        3. GCC Countries. 162
        4. Rest of the Middle East & Africa. 165
      33. \r\n
      34. \r\n
      35. \r\n
      36. \r\n
      37. \r\n
    9. Competitive Landscape.. 169
      1. \r\n
      2. Introduction. 169
      3. \r\n
      4. COMPETITIVE BENCHMARKING. 169
      5. \r\n
      6. Global MArket Strategies. 170
      7. \r\n
      8. KEY DEVELOPMENTS & GROWTH STRATEGIES. 170
        1. expansions. 170
      9. \r\n
      10. \r\n
    10. Company Profiles.. 171
      1. \r\n
      2. BASF SE. 171
        1. COMPANY OVERVIEW.. 171
        2. FINANCIAL OVERVIEW.. 172
        3. PRODUCTS OFFERED. 172
        4. KEY DEVELOPMENTS. 173
        5. SWOT ANALYSIS. 173
        6. KEY STRATEGIES. 174
      3. \r\n
      4. \r\n
      5. \r\n
      6. \r\n
      7. \r\n
      8. \r\n
      9. \r\n
      10. SNF GROUP. 175
        1. COMPANY OVERVIEW.. 175
        2. FINANCIAL OVERVIEW.. 175
        3. PRODUCTS OFFERed. 175
        4. KEY DEVELOPMENTS. 176
        5. SWOT ANALYSIS. 176
        6. KEY STRATEGIES. 177
      11. \r\n
      12. \r\n
      13. \r\n
      14. \r\n
      15. \r\n
      16. \r\n
      17. \r\n
      18. China National Petroleum Corporation (CNPC) 178
        1. COMPANY OVERVIEW.. 178
        2. FINANCIAL OVERVIEW.. 178
        3. PRODUCTS OFFERed. 179
        4. KEY DEVELOPMENTS. 179
        5. SWOT ANALYSIS. 179
        6. KEY STRATEGIES. 180
      19. \r\n
      20. \r\n
      21. \r\n
      22. \r\n
      23. \r\n
      24. \r\n
      25. \r\n
      26. The Dow Chemical Company. 181
        1. COMPANY OVERVIEW.. 181
        2. FINANCIAL OVERVIEW.. 182
        3. PRODUCTS OFFERed. 183
        4. KEY DEVELOPMENTS. 183
        5. SWOT ANALYSIS. 183
        6. Key Strategies. 184
      27. \r\n
      28. \r\n
      29. \r\n
      30. \r\n
      31. \r\n
      32. \r\n
      33. \r\n
      34. PetroChina Company Limited. 185
        1. COMPANY OVERVIEW.. 185
        2. FINANCIAL OVERVIEW.. 186
        3. PRODUCTS OFFERed. 186
        4. KEY DEVELOPMENTS. 186
        5. SWOT ANALYSIS. 187
        6. Key Strategies. 187
      35. \r\n
      36. \r\n
      37. \r\n
      38. \r\n
      39. \r\n
      40. \r\n
      41. \r\n
      42. Black Rose Industries Ltd. 188
        1. COMPANY OVERVIEW.. 188
        2. FINANCIAL OVERVIEW.. 188
        3. PRODUCTS OFFERED. 189
        4. KEY DEVELOPMENTS. 189
        5. KEY STRATEGIES. 189
      43. \r\n
      44. \r\n
      45. \r\n
      46. \r\n
      47. \r\n
      48. \r\n
      49. Xitao Polymer Co., Ltd. 190
        1. COMPANY OVERVIEW.. 190
        2. FINANCIAL OVERVIEW.. 190
        3. PRODUCTS OFFERED. 190
        4. KEY DEVELOPMENTS. 190
        5. KEY STRATEGIES. 190
      50. \r\n
      51. \r\n
      52. \r\n
      53. \r\n
      54. \r\n
      55. \r\n
      56. kemira oyj. 191
        1. COMPANY OVERVIEW.. 191
        2. FINANCIAL OVERVIEW.. 191
        3. PRODUCTS OFFERED. 192
        4. KEY DEVELOPMENTS. 192
        5. KEY STRATEGIES. 192
      57. \r\n
      58. \r\n
      59. \r\n
      60. \r\n
      61. \r\n
      62. \r\n
      63. ZL Petrochemicals Co., Ltd. 193
        1. COMPANY OVERVIEW.. 193
        2. FINANCIAL OVERVIEW.. 193
        3. PRODUCTS OFFERED. 193
        4. KEY DEVELOPMENTS. 193
        5. KEY STRATEGIES. 193
      64. \r\n
      65. \r\n
      66. \r\n
      67. \r\n
      68. \r\n
      69. \r\n
      70. Anhui Jucheng Fine Chemicals Co., Ltd. 194
        1. COMPANY OVERVIEW.. 194
        2. FINANCIAL OVERVIEW.. 194
        3. PRODUCTS OFFERED. 194
        4. KEY DEVELOPMENTS. 195
        5. KEY STRATEGIES. 195
      71. \r\n
      72. \r\n
      73. \r\n
      74. \r\n
      75. \r\n
      76. \r\n
    11. References.. 196
      1. \r\n
      2. \r\n
    12. LIST OF TABLES
      1. \r\n
    13. Primary Interviews 27
      1. \r\n
    14. List of assumptions & Limitations 31
      1. \r\n
    15. Pricing Overview of polyacrylamide, By region (USD/Ton) 42
      1. \r\n
    16. Global POLYACRYLAMIDE Market Estimates & Forecast, BY product type, 2019–2025 (USD million) 44
      1. \r\n
    17. Global POLYACRYLAMIDE Market Estimates & Forecast, BY product type, 2026–2030 (USD million) 44
      1. \r\n
    18. Global POLYACRYLAMIDE Market Estimates & Forecast, BY product type, 2019–2025 (Kilo Tons) 44
      1. \r\n
    19. Global POLYACRYLAMIDE Market Estimates & Forecast, BY product type, 2026–2030 (Kilo Tons) 45
      1. \r\n
    20. Anionic: MARKET ESTIMATES & forecast, BY REGION, 2019–2025 (USD million) 45
      1. \r\n
    21. Anionic: MARKET ESTIMATES & forecast, BY REGION, 2026–2030 (USD million) 46
      1. \r\n
    22. Anionic: MARKET ESTIMATES & forecast, BY REGION, 2019–2025 (Kilo Tons) 46
      1. \r\n
    23. Anionic: MARKET ESTIMATES & forecast, BY REGION, 2026–2030 (Kilo Tons) 47
      1. \r\n
    24. cationic: MARKET ESTIMATES & forecast, BY REGION, 2019–2025 (USD million) 47
      1. \r\n
    25. cationic: MARKET ESTIMATES & forecast, BY REGION, 2026–2030 (USD million) 48
      1. \r\n
    26. cationic: MARKET ESTIMATES & forecast, BY REGION, 2019–2025 (Kilo Tons) 48
      1. \r\n
    27. cationic: MARKET ESTIMATES & forecast, BY REGION, 2026–2030 (Kilo Tons) 49
      1. \r\n
    28. non-ionic: MARKET ESTIMATES & forecast, BY REGION, 2019–2025 (USD million) 49
      1. \r\n
    29. non-ionic: MARKET ESTIMATES & forecast, BY REGION, 2026–2030 (USD million) 50
      1. \r\n
    30. non-ionic: MARKET ESTIMATES & forecast, BY REGION, 2019–2025 (Kilo Tons) 50
      1. \r\n
    31. non-ionic: MARKET ESTIMATES & forecast, BY REGION, 2026–2030 (Kilo Tons) 51
      1. \r\n
    32. Global POLYACRYLAMIDE Market Estimates & Forecast, BY application, 2019–2025 (USD million) 53
      1. \r\n
    33. Global POLYACRYLAMIDE Market Estimates & Forecast, BY application, 2026–2030 (USD million) 54
      1. \r\n
    34. Global POLYACRYLAMIDE Market Estimates & Forecast, BY application, 2019–2025 (Kilo Tons) 54
      1. \r\n
    35. Global POLYACRYLAMIDE Market Estimates & Forecast, BY application, 2026–2030 (Kilo Tons) 55
      1. \r\n
    36. Water Treatment: MARKET ESTIMATES & forecast, BY REGION, 2019–2025 (USD million) 55
      1. \r\n
    37. Water Treatment: MARKET ESTIMATES & forecast, BY REGION, 2026–2030 (USD million) 56
      1. \r\n
    38. Water Treatment: MARKET ESTIMATES & forecast, BY REGION, 2019–2025 (Kilo Tons) 56
      1. \r\n
    39. Water Treatment: MARKET ESTIMATES & forecast, BY REGION, 2026–2030 (Kilo Tons) 57
      1. \r\n
    40. Pulp and Paper: MARKET ESTIMATES & forecast, BY REGION, 2019–2025 (USD million) 57
      1. \r\n
    41. Pulp and Paper: MARKET ESTIMATES & forecast, BY REGION, 2026–2030 (USD million) 58
      1. \r\n
    42. Pulp and Paper: MARKET ESTIMATES & forecast, BY REGION, 2019–2025 (Kilo Tons) 58
      1. \r\n
    43. Pulp and Paper: MARKET ESTIMATES & forecast, BY REGION, 2026–2030 (Kilo Tons) 59
      1. \r\n
    44. Mineral Processing: MARKET ESTIMATES & forecast, BY REGION, 2019–2025 (USD million) 59
      1. \r\n
    45. Mineral Processing: MARKET ESTIMATES & forecast, BY REGION, 2026–2030 (USD million) 60
      1. \r\n
    46. Mineral Processing: MARKET ESTIMATES & forecast, BY REGION, 2019–2025 (Kilo Tons) 60
      1. \r\n
    47. Mineral Processing: MARKET ESTIMATES & forecast, BY REGION, 2026–2030 (Kilo Tons) 61
      1. \r\n
    48. Enhanced Oil Recovery: MARKET ESTIMATES & forecast, BY REGION, 2019–2025 (USD million) 61
      1. \r\n
    49. Enhanced Oil Recovery: MARKET ESTIMATES & forecast, BY REGION, 2026–2030 (USD million) 62
      1. \r\n
    50. Enhanced Oil Recovery: MARKET ESTIMATES & forecast, BY REGION, 2019–2025 (Kilo Tons) 62
      1. \r\n
    51. Enhanced Oil Recovery: MARKET ESTIMATES & forecast, BY REGION, 2026–2030 (Kilo Tons) 63
      1. \r\n
    52. Others: MARKET ESTIMATES & forecast, BY REGION, 2019–2025 (USD million) 63
      1. \r\n
    53. Others: MARKET ESTIMATES & forecast, BY REGION, 2026–2030 (USD million) 64
      1. \r\n
    54. Others: MARKET ESTIMATES & forecast, BY REGION, 2019–2025 (Kilo Tons) 64
      1. \r\n
    55. Others: MARKET ESTIMATES & forecast, BY REGION, 2026–2030 (Kilo Tons) 65
      1. \r\n
    56. global POLYACRYLAMIDE MARKET ESTIMATES & forecast, BY REGION, 2019–2025 (USD million) 67
      1. \r\n
    57. global POLYACRYLAMIDE MARKET ESTIMATES & forecast, BY REGION, 2026–2030 (USD million) 68
      1. \r\n
    58. global POLYACRYLAMIDE MARKET ESTIMATES & forecast, BY REGION, 2019–2025 (kilo tons) 68
      1. \r\n
    59. global POLYACRYLAMIDE MARKET ESTIMATES & forecast, BY REGION, 2026–2030 (kilo tons) 69
      1. \r\n
    60. North america: Market ESTIMATES & forecast, BY country, 2019–2025 (USD million) 70
      1. \r\n
    61. North america: Market ESTIMATES & forecast, BY country, 2026–2030 (USD million) 71
      1. \r\n
    62. North america: Market ESTIMATES & forecast, BY country, 2019–2025 (kilo tons) 71
      1. \r\n
    63. North america: Market ESTIMATES & forecast, BY country, 2026–2030 (kilo tons) 71
      1. \r\n
    64. North America: POLYACRYLAMIDE Market, BY product type, 2019–2025 (USD million) 72
      1. \r\n
    65. North America: POLYACRYLAMIDE Market, BY product type, 2026–2030 (USD million) 72
      1. \r\n
    66. North America: POLYACRYLAMIDE Market, BY product type, 2019–2025 (kilo tons) 72
      1. \r\n
    67. North America: POLYACRYLAMIDE Market, BY product type, 2026–2030 (kilo tons) 73
      1. \r\n
    68. North America: POLYACRYLAMIDE Market, BY application, 2019–2025 (USD million) 73
      1. \r\n
    69. North America: POLYACRYLAMIDE Market, BY application, 2026–2030 (USD million) 74
      1. \r\n
    70. North America: POLYACRYLAMIDE Market, BY application, 2019–2025 (kilo tons) 74
      1. \r\n
    71. North America: POLYACRYLAMIDE Market, BY application, 2026–2030 (kilo tons) 75
      1. \r\n
    72. US: POLYACRYLAMIDE Market, BY product type, 2019–2025 (USD million) 75
      1. \r\n
    73. US: POLYACRYLAMIDE Market, BY product type, 2026–2030 (USD million) 76
      1. \r\n
    74. US: POLYACRYLAMIDE Market, BY product type, 2019–2025 (kilo tons) 76
      1. \r\n
    75. US: POLYACRYLAMIDE Market, BY product type, 2026–2030 (kilo tons) 76
      1. \r\n
    76. US: POLYACRYLAMIDE Market, BY application, 2019–2025 (USD million) 77
      1. \r\n
    77. US: POLYACRYLAMIDE Market, BY application, 2026–2030 (USD million) 77
      1. \r\n
    78. US: POLYACRYLAMIDE Market, BY application, 2019–2025 (kilo tons) 77
      1. \r\n
    79. US: POLYACRYLAMIDE Market, BY application, 2026–2030 (kilo tons) 78
      1. \r\n
    80. Canada: POLYACRYLAMIDE Market, BY product type, 2019–2025 (USD million) 78
      1. \r\n
    81. Canada: POLYACRYLAMIDE Market, BY product type, 2026–2030 (USD million) 79
      1. \r\n
    82. Canada: POLYACRYLAMIDE Market, BY product type, 2019–2025 (kilo tons) 79
      1. \r\n
    83. Canada: POLYACRYLAMIDE Market, BY product type, 2026–2030 (kilo tons) 79
      1. \r\n
    84. Canada: POLYACRYLAMIDE Market, BY application, 2019–2025 (USD million) 80
      1. \r\n
    85. Canada: POLYACRYLAMIDE Market, BY application, 2026–2030 (USD million) 80
      1. \r\n
    86. Canada: POLYACRYLAMIDE Market, BY application, 2019–2025 (kilo tons) 80
      1. \r\n
    87. Canada: POLYACRYLAMIDE Market, BY application, 2026–2030 (kilo tons) 81
      1. \r\n
    88. europe: Market ESTIMATES & forecast, BY country, 2019–2025 (USD million) 82
      1. \r\n
    89. europe: Market ESTIMATES & forecast, BY country, 2026–2030 (USD million) 83
      1. \r\n
    90. europe: Market ESTIMATES & forecast, BY country, 2019–2025 (kilo tons) 83
      1. \r\n
    91. europe: Market ESTIMATES & forecast, BY country, 2026–2030 (kilo tons) 84
      1. \r\n
    92. europe: POLYACRYLAMIDE Market, BY product type, 2019–2025 (USD million) 84
      1. \r\n
    93. europe: POLYACRYLAMIDE Market, BY product type, 2026–2030 (USD million) 85
      1. \r\n
    94. europe: POLYACRYLAMIDE Market, BY product type, 2019–2025 (kilo tons) 85
      1. \r\n
    95. europe: POLYACRYLAMIDE Market, BY product type, 2026–2030 (kilo tons) 85
      1. \r\n
    96. europe: POLYACRYLAMIDE Market, BY application, 2019–2025 (USD million) 86
      1. \r\n
    97. europe: POLYACRYLAMIDE Market, BY application, 2026–2030 (USD million) 86
      1. \r\n
    98. europe: POLYACRYLAMIDE Market, BY application, 2019–2025 (kilo tons) 86
      1. \r\n
    99. europe: POLYACRYLAMIDE Market, BY application, 2026–2030 (kilo tons) 87
      1. \r\n
    100. Germany: POLYACRYLAMIDE Market, BY product type, 2019–2025 (USD million) 87
      1. \r\n
    101. Germany: POLYACRYLAMIDE Market, BY product type, 2026–2030 (USD million) 88
      1. \r\n
    102. Germany: POLYACRYLAMIDE Market, BY product type, 2019–2025 (kilo tons) 88
      1. \r\n
    103. Germany: POLYACRYLAMIDE Market, BY product type, 2026–2030 (kilo tons) 88
      1. \r\n
    104. Germany: POLYACRYLAMIDE Market, BY application, 2019–2025 (USD million) 89
      1. \r\n
    105. Germany: POLYACRYLAMIDE Market, BY application, 2026–2030 (USD million) 89
      1. \r\n
    106. Germany: POLYACRYLAMIDE Market, BY application, 2019–2025 (kilo tons) 89
      1. \r\n
    107. Germany: POLYACRYLAMIDE Market, BY application, 2026–2030 (kilo tons) 90
      1. \r\n
    108. UK: POLYACRYLAMIDE Market, BY product type, 2019–2025 (USD million) 90
      1. \r\n
    109. UK: POLYACRYLAMIDE Market, BY product type, 2026–2030 (USD million) 91
      1. \r\n
    110. UK: POLYACRYLAMIDE Market, BY product type, 2019–2025 (kilo tons) 91
      1. \r\n
    111. UK: POLYACRYLAMIDE Market, BY product type, 2026–2030 (kilo tons) 91
      1. \r\n
    112. UK: POLYACRYLAMIDE Market, BY application, 2019–2025 (USD million) 92
      1. \r\n
    113. UK: POLYACRYLAMIDE Market, BY application, 2026–2030 (USD million) 92
      1. \r\n
    114. UK: POLYACRYLAMIDE Market, BY application, 2019–2025 (kilo tons) 92
      1. \r\n
    115. UK: POLYACRYLAMIDE Market, BY application, 2026–2030 (kilo tons) 93
      1. \r\n
    116. france: POLYACRYLAMIDE Market, BY product type, 2019–2025 (USD million) 93
      1. \r\n
    117. france: POLYACRYLAMIDE Market, BY product type, 2026–2030 (USD million) 94
      1. \r\n
    118. france: POLYACRYLAMIDE Market, BY product type, 2019–2025 (kilo tons) 94
      1. \r\n
    119. france: POLYACRYLAMIDE Market, BY product type, 2026–2030 (kilo tons) 94
      1. \r\n
    120. france: POLYACRYLAMIDE Market, BY application, 2019–2025 (USD million) 95
      1. \r\n
    121. france: POLYACRYLAMIDE Market, BY application, 2026–2030 (USD million) 95
      1. \r\n
    122. france: POLYACRYLAMIDE Market, BY application, 2019–2025 (kilo tons) 95
      1. \r\n
    123. france: POLYACRYLAMIDE Market, BY application, 2026–2030 (kilo tons) 96
      1. \r\n
    124. russia: POLYACRYLAMIDE Market, BY product type, 2019–2025 (USD million) 96
      1. \r\n
    125. russia: POLYACRYLAMIDE Market, BY product type, 2026–2030 (USD million) 97
      1. \r\n
    126. russia: POLYACRYLAMIDE Market, BY product type, 2019–2025 (kilo tons) 97
      1. \r\n
    127. russia: POLYACRYLAMIDE Market, BY product type, 2026–2030 (kilo tons) 97
      1. \r\n
    128. russia: POLYACRYLAMIDE Market, BY application, 2019–2025 (USD million) 98
      1. \r\n
    129. russia: POLYACRYLAMIDE Market, BY application, 2026–2030 (USD million) 98
      1. \r\n
    130. russia: POLYACRYLAMIDE Market, BY application, 2019–2025 (kilo tons) 98
      1. \r\n
    131. russia: POLYACRYLAMIDE Market, BY application, 2026–2030 (kilo tons) 99
      1. \r\n
    132. spain: POLYACRYLAMIDE Market, BY product type, 2019–2025 (USD million) 99
      1. \r\n
    133. spain: POLYACRYLAMIDE Market, BY product type, 2026–2030 (USD million) 100
      1. \r\n
    134. spain: POLYACRYLAMIDE Market, BY product type, 2019–2025 (kilo tons) 100
      1. \r\n
    135. spain: POLYACRYLAMIDE Market, BY product type, 2026–2030 (kilo tons) 100
      1. \r\n
    136. spain: POLYACRYLAMIDE Market, BY application, 2019–2025 (USD million) 101
      1. \r\n
    137. spain: POLYACRYLAMIDE Market, BY application, 2026–2030 (USD million) 101
      1. \r\n
    138. spain: POLYACRYLAMIDE Market, BY application, 2019–2025 (kilo tons) 101
      1. \r\n
    139. spain: POLYACRYLAMIDE Market, BY application, 2026–2030 (kilo tons) 102
      1. \r\n
    140. italy: POLYACRYLAMIDE Market, BY product type, 2019–2025 (USD million) 102
      1. \r\n
    141. italy: POLYACRYLAMIDE Market, BY product type, 2026–2030 (USD million) 103
      1. \r\n
    142. italy: POLYACRYLAMIDE Market, BY product type, 2019–2025 (kilo tons) 103
      1. \r\n
    143. italy: POLYACRYLAMIDE Market, BY product type, 2026–2030 (kilo tons) 103
      1. \r\n
    144. italy: POLYACRYLAMIDE Market, BY application, 2019–2025 (USD million) 104
      1. \r\n
    145. italy: POLYACRYLAMIDE Market, BY application, 2026–2030 (USD million) 104
      1. \r\n
    146. italy: POLYACRYLAMIDE Market, BY application, 2019–2025 (kilo tons) 104
      1. \r\n
    147. italy: POLYACRYLAMIDE Market, BY application, 2026–2030 (kilo tons) 105
      1. \r\n
    148. Rest of Europe: POLYACRYLAMIDE Market, BY product type, 2019–2025 (USD million) 105
      1. \r\n
    149. Rest of Europe: POLYACRYLAMIDE Market, BY product type, 2026–2030 (USD million) 106
      1. \r\n
    150. Rest of Europe: POLYACRYLAMIDE Market, BY product type, 2019–2025 (kilo tons) 106
      1. \r\n
    151. Rest of Europe: POLYACRYLAMIDE Market, BY product type, 2026–2030 (kilo tons) 106
      1. \r\n
    152. Rest of Europe: POLYACRYLAMIDE Market, BY application, 2019–2025 (USD million) 107
      1. \r\n
    153. Rest of Europe: POLYACRYLAMIDE Market, BY application, 2026–2030 (USD million) 107
      1. \r\n
    154. Rest of Europe: POLYACRYLAMIDE Market, BY application, 2019–2025 (kilo tons) 107
      1. \r\n
    155. Rest of Europe: POLYACRYLAMIDE Market, BY application, 2026–2030 (kilo tons) 108
      1. \r\n
    156. Asia-Pacific: Market ESTIMATES & forecast, BY country, 2019–2025 (USD million) 109
      1. \r\n
    157. Asia-Pacific: Market ESTIMATES & forecast, BY country, 2026–2030 (USD million) 110
      1. \r\n
    158. Asia-Pacific: Market ESTIMATES & forecast, BY country, 2019–2025 (kilo tons) 110
      1. \r\n
    159. Asia-Pacific: Market ESTIMATES & forecast, BY country, 2026–2030 (kilo tons) 111
      1. \r\n
    160. Asia-Pacific: POLYACRYLAMIDE Market, BY product type, 2019–2025 (USD million) 111
      1. \r\n
    161. Asia-Pacific: POLYACRYLAMIDE Market, BY product type, 2026–2030 (USD million) 112
      1. \r\n
    162. Asia-Pacific: POLYACRYLAMIDE Market, BY product type, 2019–2025 (kilo tons) 112
      1. \r\n
    163. Asia-Pacific: POLYACRYLAMIDE Market, BY product type, 2026–2030 (kilo tons) 112
      1. \r\n
    164. Asia-Pacific: POLYACRYLAMIDE Market, BY application, 2019–2025 (USD million) 113
      1. \r\n
    165. Asia-Pacific: POLYACRYLAMIDE Market, BY application, 2026–2030 (USD million) 113
      1. \r\n
    166. Asia-Pacific: POLYACRYLAMIDE Market, BY application, 2019–2025 (kilo tons) 113
      1. \r\n
    167. Asia-Pacific: POLYACRYLAMIDE Market, BY application, 2026–2030 (kilo tons) 114
      1. \r\n
    168. china: POLYACRYLAMIDE Market, BY product type, 2019–2025 (USD million) 114
      1. \r\n
    169. china: POLYACRYLAMIDE Market, BY product type, 2026–2030 (USD million) 115
      1. \r\n
    170. china: POLYACRYLAMIDE Market, BY product type, 2019–2025 (kilo tons) 115
      1. \r\n
    171. china: POLYACRYLAMIDE Market, BY product type, 2026–2030 (kilo tons) 115
      1. \r\n
    172. china: POLYACRYLAMIDE Market, BY application, 2019–2025 (USD million) 116
      1. \r\n
    173. china: POLYACRYLAMIDE Market, BY application, 2026–2030 (USD million) 116
      1. \r\n
    174. china: POLYACRYLAMIDE Market, BY application, 2019–2025 (kilo tons) 116
      1. \r\n
    175. china: POLYACRYLAMIDE Market, BY application, 2026–2030 (kilo tons) 117
      1. \r\n
    176. Japan: POLYACRYLAMIDE Market, BY product type, 2019–2025 (USD million) 117
      1. \r\n
    177. Japan: POLYACRYLAMIDE Market, BY product type, 2026–2030 (USD million) 118
      1. \r\n
    178. Japan: POLYACRYLAMIDE Market, BY product type, 2019–2025 (kilo tons) 118
      1. \r\n
    179. Japan: POLYACRYLAMIDE Market, BY product type, 2026–2030 (kilo tons) 118
      1. \r\n
    180. Japan: POLYACRYLAMIDE Market, BY application, 2019–2025 (USD million) 119
      1. \r\n
    181. Japan: POLYACRYLAMIDE Market, BY application, 2026–2030 (USD million) 119
      1. \r\n
    182. Japan: POLYACRYLAMIDE Market, BY application, 2019–2025 (kilo tons) 119
      1. \r\n
    183. Japan: POLYACRYLAMIDE Market, BY application, 2026–2030 (kilo tons) 120
      1. \r\n
    184. India: POLYACRYLAMIDE Market, BY product type, 2019–2025 (USD million) 120
      1. \r\n
    185. India: POLYACRYLAMIDE Market, BY product type, 2026–2030 (USD million) 121
      1. \r\n
    186. India: POLYACRYLAMIDE Market, BY product type, 2019–2025 (kilo tons) 121
      1. \r\n
    187. India: POLYACRYLAMIDE Market, BY product type, 2026–2030 (kilo tons) 121
      1. \r\n
    188. India: POLYACRYLAMIDE Market, BY application, 2019–2025 (USD million) 122
      1. \r\n
    189. India: POLYACRYLAMIDE Market, BY application, 2026–2030 (USD million) 122
      1. \r\n
    190. India: POLYACRYLAMIDE Market, BY application, 2019–2025 (kilo tons) 122
      1. \r\n
    191. India: POLYACRYLAMIDE Market, BY application, 2026–2030 (kilo tons) 123
      1. \r\n
    192. South Korea: POLYACRYLAMIDE Market, BY product type, 2019–2025 (USD million) 123
      1. \r\n
    193. South Korea: POLYACRYLAMIDE Market, BY product type, 2026–2030 (USD million) 124
      1. \r\n
    194. South Korea: POLYACRYLAMIDE Market, BY product type, 2019–2025 (kilo tons) 124
      1. \r\n
    195. South Korea: POLYACRYLAMIDE Market, BY product type, 2026–2030 (kilo tons) 124
      1. \r\n
    196. South Korea: POLYACRYLAMIDE Market, BY application, 2019–2025 (USD million) 125
      1. \r\n
    197. South Korea: POLYACRYLAMIDE Market, BY application, 2026–2030 (USD million) 125
      1. \r\n
    198. South Korea: POLYACRYLAMIDE Market, BY application, 2019–2025 (kilo tons) 125
      1. \r\n
    199. South Korea: POLYACRYLAMIDE Market, BY application, 2026–2030 (kilo tons) 126
      1. \r\n
    200. Australia & New Zealand: POLYACRYLAMIDE Market, BY product type, 2019–2025 (USD million) 126
      1. \r\n
    201. Australia & New Zealand: POLYACRYLAMIDE Market, BY product type, 2026–2030 (USD million) 127
      1. \r\n
    202. Australia & New Zealand: POLYACRYLAMIDE Market, BY product type, 2019–2025 (kilo tons) 127
      1. \r\n
    203. Australia & New Zealand: POLYACRYLAMIDE Market, BY product type, 2026–2030 (kilo tons) 127
      1. \r\n
    204. Australia & New Zealand: POLYACRYLAMIDE Market, BY application, 2019–2025 (USD million) 128
      1. \r\n
    205. Australia & New Zealand: POLYACRYLAMIDE Market, BY application, 2026–2030 (USD million) 128
      1. \r\n
    206. Australia & New Zealand: POLYACRYLAMIDE Market, BY application, 2019–2025 (kilo tons) 128
      1. \r\n
    207. Australia & New Zealand: POLYACRYLAMIDE Market, BY application, 2026–2030 (kilo tons) 129
      1. \r\n
    208. Rest of Asia-Pacific: POLYACRYLAMIDE Market, BY product type, 2019–2025 (USD million) 129
      1. \r\n
    209. Rest of Asia-Pacific: POLYACRYLAMIDE Market, BY product type, 2026–2030 (USD million) 130
      1. \r\n
    210. Rest of Asia-Pacific: POLYACRYLAMIDE Market, BY product type, 2019–2025 (kilo tons) 130
      1. \r\n
    211. Rest of Asia-Pacific: POLYACRYLAMIDE Market, BY product type, 2026–2030 (kilo tons) 130
      1. \r\n
    212. Rest of Asia-Pacific: POLYACRYLAMIDE Market, BY application, 2019–2025 (USD million) 131
      1. \r\n
    213. Rest of Asia-Pacific: POLYACRYLAMIDE Market, BY application, 2026–2030 (USD million) 131
      1. \r\n
    214. Rest of Asia-Pacific: POLYACRYLAMIDE Market, BY application, 2019–2025 (kilo tons) 131
      1. \r\n
    215. Rest of Asia-Pacific: POLYACRYLAMIDE Market, BY application, 2026–2030 (kilo tons) 132
      1. \r\n
    216. Latin America: Market ESTIMATES & forecast, BY country, 2019–2025 (USD million) 133
      1. \r\n
    217. Latin America: Market ESTIMATES & forecast, BY country, 2026–2030 (USD million) 134
      1. \r\n
    218. Latin America: Market ESTIMATES & forecast, BY country, 2019–2025 (kilo tons) 134
      1. \r\n
    219. Latin America: Market ESTIMATES & forecast, BY country, 2026–2030 (kilo tons) 135
      1. \r\n
    220. Latin America: POLYACRYLAMIDE Market, BY product type, 2019–2025 (USD million) 135
      1. \r\n
    221. Latin America: POLYACRYLAMIDE Market, BY product type, 2026–2030 (USD million) 135
      1. \r\n
    222. Latin America: POLYACRYLAMIDE Market, BY product type, 2019–2025 (kilo tons) 136
      1. \r\n
    223. Latin America: POLYACRYLAMIDE Market, BY product type, 2026–2030 (kilo tons) 136
      1. \r\n
    224. Latin America: POLYACRYLAMIDE Market, BY application, 2019–2025 (USD million) 136
      1. \r\n
    225. Latin America: POLYACRYLAMIDE Market, BY application, 2026–2030 (USD million) 137
      1. \r\n
    226. Latin America: POLYACRYLAMIDE Market, BY application, 2019–2025 (kilo tons) 137
      1. \r\n
    227. Latin America: POLYACRYLAMIDE Market, BY application, 2026–2030 (kilo tons) 138
      1. \r\n
    228. Brazil: POLYACRYLAMIDE Market, BY product type, 2019–2025 (USD million) 138
      1. \r\n
    229. Brazil: POLYACRYLAMIDE Market, BY product type, 2026–2030 (USD million) 139
      1. \r\n
    230. Brazil: POLYACRYLAMIDE Market, BY product type, 2019–2025 (kilo tons) 139
      1. \r\n
    231. Brazil: POLYACRYLAMIDE Market, BY product type, 2026–2030 (kilo tons) 139
      1. \r\n
    232. Brazil: POLYACRYLAMIDE Market, BY application, 2019–2025 (USD million) 140
      1. \r\n
    233. Brazil: POLYACRYLAMIDE Market, BY application, 2026–2030 (USD million) 140
      1. \r\n
    234. Brazil: POLYACRYLAMIDE Market, BY application, 2019–2025 (kilo tons) 140
      1. \r\n
    235. Brazil: POLYACRYLAMIDE Market, BY application, 2026–2030 (kilo tons) 141
      1. \r\n
    236. Mexico: POLYACRYLAMIDE Market, BY product type, 2019–2025 (USD million) 141
      1. \r\n
    237. Mexico: POLYACRYLAMIDE Market, BY product type, 2026–2030 (USD million) 142
      1. \r\n
    238. Mexico: POLYACRYLAMIDE Market, BY product type, 2019–2025 (kilo tons) 142
      1. \r\n
    239. Mexico: POLYACRYLAMIDE Market, BY product type, 2026–2030 (kilo tons) 142
      1. \r\n
    240. Mexico: POLYACRYLAMIDE Market, BY application, 2019–2025 (USD million) 143
      1. \r\n
    241. Mexico: POLYACRYLAMIDE Market, BY application, 2026–2030 (USD million) 143
      1. \r\n
    242. Mexico: POLYACRYLAMIDE Market, BY application, 2019–2025 (kilo tons) 143
      1. \r\n
    243. Mexico: POLYACRYLAMIDE Market, BY application, 2026–2030 (kilo tons) 144
      1. \r\n
    244. Argentina: POLYACRYLAMIDE Market, BY product type, 2019–2025 (USD million) 144
      1. \r\n
    245. Argentina: POLYACRYLAMIDE Market, BY product type, 2026–2030 (USD million) 145
      1. \r\n
    246. Argentina: POLYACRYLAMIDE Market, BY product type, 2019–2025 (kilo tons) 145
      1. \r\n
    247. Argentina: POLYACRYLAMIDE Market, BY product type, 2026–2030 (kilo tons) 145
      1. \r\n
    248. Argentina: POLYACRYLAMIDE Market, BY application, 2019–2025 (USD million) 146
      1. \r\n
    249. Argentina: POLYACRYLAMIDE Market, BY application, 2026–2030 (USD million) 146
      1. \r\n
    250. Argentina: POLYACRYLAMIDE Market, BY application, 2019–2025 (kilo tons) 146
      1. \r\n
    251. Argentina: POLYACRYLAMIDE Market, BY application, 2026–2030 (kilo tons) 147
      1. \r\n
    252. Rest of Latin America: POLYACRYLAMIDE Market, BY product type, 2019–2025 (USD million) 147
      1. \r\n
    253. Rest of Latin America: POLYACRYLAMIDE Market, BY product type, 2026–2030 (USD million) 148
      1. \r\n
    254. Rest of Latin America: POLYACRYLAMIDE Market, BY product type, 2019–2025 (kilo tons) 148
      1. \r\n
    255. Rest of Latin America: POLYACRYLAMIDE Market, BY product type, 2026–2030 (kilo tons) 148
      1. \r\n
    256. Rest of Latin America: POLYACRYLAMIDE Market, BY application, 2019–2025 (USD million) 149
      1. \r\n
    257. Rest of Latin America: POLYACRYLAMIDE Market, BY application, 2026–2030 (USD million) 149
      1. \r\n
    258. Rest of Latin America: POLYACRYLAMIDE Market, BY application, 2019–2025 (kilo tons) 149
      1. \r\n
    259. Rest of Latin America: POLYACRYLAMIDE Market, BY application, 2026–2030 (kilo tons) 150
      1. \r\n
    260. Middle East & Africa: Market ESTIMATES & forecast, BY country, 2019–2025 (USD million) 151
      1. \r\n
    261. Middle East & Africa: Market ESTIMATES & forecast, BY country, 2026–2030 (USD million) 152
      1. \r\n
    262. Middle East & Africa: Market ESTIMATES & forecast, BY country, 2019–2025 (kilo tons) 152
      1. \r\n
    263. Middle East & Africa: Market ESTIMATES & forecast, BY country, 2026–2030 (kilo tons) 153
      1. \r\n
    264. Middle East & Africa: POLYACRYLAMIDE Market, BY product type, 2019–2025 (USD million) 153
      1. \r\n
    265. Middle East & Africa: POLYACRYLAMIDE Market, BY product type, 2026–2030 (USD million) 153
      1. \r\n
    266. Middle East & Africa: POLYACRYLAMIDE Market, BY product type, 2019–2025 (kilo tons) 154
      1. \r\n
    267. Middle East & Africa: POLYACRYLAMIDE Market, BY product type, 2026–2030 (kilo tons) 154
      1. \r\n
    268. Middle East & Africa: POLYACRYLAMIDE Market, BY application, 2019–2025 (USD million) 154
      1. \r\n
    269. Middle East & Africa: POLYACRYLAMIDE Market, BY application, 2026–2030 (USD million) 155
      1. \r\n
    270. Middle East & Africa: POLYACRYLAMIDE Market, BY application, 2019–2025 (kilo tons) 155
      1. \r\n
    271. Middle East & Africa: POLYACRYLAMIDE Market, BY application, 2026–2030 (kilo tons) 156
      1. \r\n
    272. Turkey: POLYACRYLAMIDE Market, BY product type, 2019–2025 (USD million) 156
      1. \r\n
    273. Turkey: POLYACRYLAMIDE Market, BY product type, 2026–2030 (USD million) 157
      1. \r\n
    274. Turkey: POLYACRYLAMIDE Market, BY product type, 2019–2025 (kilo tons) 157
      1. \r\n
    275. Turkey: POLYACRYLAMIDE Market, BY product type, 2026–2030 (kilo tons) 157
      1. \r\n
    276. Turkey: POLYACRYLAMIDE Market, BY application, 2019–2025 (USD million) 158
      1. \r\n
    277. Turkey: POLYACRYLAMIDE Market, BY application, 2026–2030 (USD million) 158
      1. \r\n
    278. Turkey: POLYACRYLAMIDE Market, BY application, 2019–2025 (kilo tons) 158
      1. \r\n
    279. Turkey: POLYACRYLAMIDE Market, BY application, 2026–2030 (kilo tons) 159
      1. \r\n
    280. South Africa: POLYACRYLAMIDE Market, BY product type, 2019–2025 (USD million) 159
      1. \r\n
    281. South Africa: POLYACRYLAMIDE Market, BY product type, 2026–2030 (USD million) 160
      1. \r\n
    282. South Africa: POLYACRYLAMIDE Market, BY product type, 2019–2025 (kilo tons) 160
      1. \r\n
    283. South Africa: POLYACRYLAMIDE Market, BY product type, 2026–2030 (kilo tons) 160
      1. \r\n
    284. South Africa: POLYACRYLAMIDE Market, BY application, 2019–2025 (USD million) 161
      1. \r\n
    285. South Africa: POLYACRYLAMIDE Market, BY application, 2026–2030 (USD million) 161
      1. \r\n
    286. South Africa: POLYACRYLAMIDE Market, BY application, 2019–2025 (kilo tons) 161
      1. \r\n
    287. South Africa: POLYACRYLAMIDE Market, BY application, 2026–2030 (kilo tons) 162
      1. \r\n
    288. GCC Countries: POLYACRYLAMIDE Market, BY product type, 2019–2025 (USD million) 162
      1. \r\n
    289. GCC Countries: POLYACRYLAMIDE Market, BY product type, 2026–2030 (USD million) 163
      1. \r\n
    290. GCC Countries: POLYACRYLAMIDE Market, BY product type, 2019–2025 (kilo tons) 163
      1. \r\n
    291. GCC Countries: POLYACRYLAMIDE Market, BY product type, 2026–2030 (kilo tons) 163
      1. \r\n
    292. GCC Countries: POLYACRYLAMIDE Market, BY application, 2019–2025 (USD million) 164
      1. \r\n
    293. GCC Countries: POLYACRYLAMIDE Market, BY application, 2026–2030 (USD million) 164
      1. \r\n
    294. GCC Countries: POLYACRYLAMIDE Market, BY application, 2019–2025 (kilo tons) 164
      1. \r\n
    295. GCC Countries: POLYACRYLAMIDE Market, BY application, 2026–2030 (kilo tons) 165
      1. \r\n
    296. Rest of the Middle East & Africa: POLYACRYLAMIDE Market, BY product type, 2019–2025 (USD million) 165
      1. \r\n
    297. Rest of the Middle East & Africa: POLYACRYLAMIDE Market, BY product type, 2026–2030 (USD million) 166
      1. \r\n
    298. Rest of the Middle East & Africa: POLYACRYLAMIDE Market, BY product type, 2019–2025 (kilo tons) 166
      1. \r\n
    299. Rest of the Middle East & Africa: POLYACRYLAMIDE Market, BY product type, 2026–2030 (kilo tons) 166
      1. \r\n
    300. Rest of the Middle East & Africa: POLYACRYLAMIDE Market, BY application, 2019–2025 (USD million) 167
      1. \r\n
    301. Rest of the Middle East & Africa: POLYACRYLAMIDE Market, BY application, 2026–2030 (USD million) 167
      1. \r\n
    302. Rest of the Middle East & Africa: POLYACRYLAMIDE Market, BY application, 2019–2025 (kilo tons) 168
      1. \r\n
    303. Rest of the Middle East & Africa: POLYACRYLAMIDE Market, BY application, 2026–2030 (kilo tons) 168
      1. \r\n
    304. expansions 170
      1. \r\n
    305. BASF SE: Products offered 172
      1. \r\n
    306. BASF SE: Key Developments 173
      1. \r\n
    307. SNF Group: Products Offered 175
      1. \r\n
    308. SNF GROUP: Key DEVELOPMENTS 176
      1. \r\n
    309. China National Petroleum Corporation (CNPC): Products Offered 179
      1. \r\n
    310. THE DOW CHEMICAL COMPANY: PRODUCTS Offered 183
      1. \r\n
    311. PetroChina Company Limited: PRODUCTS Offered 186
      1. \r\n
    312. BLACK ROSE INDUSTRIES LTD.: Products offered 189
      1. \r\n
    313. XITAO POLYMER CO., LTD.: Products offered 190
      1. \r\n
    314. KEMIRA OYJ: Products offered 192
      1. \r\n
    315. KEMIRA OYJ: Key DEVELOPMENTS 192
      1. \r\n
    316. ZL Petrochemicals Co., Ltd: Products offered 193
      1. \r\n
    317. ANHUI JUCHENG FINE CHEMICALS CO., LTD: Products offered 194
      1. \r\n
    318. LIST OF FIGURES
      1. \r\n
    319. Market synopsis 19
      1. \r\n
    320. Market Attractiveness Analysis: Global Polyacrylamide Market, 2021 20
      1. \r\n
    321. Global Polyacrylamide Market analysis, by product Type, 2021 21
      1. \r\n
    322. Global Polyacrylamide Market analysis, by application, 2021 22
      1. \r\n
    323. Global Polyacrylamide Market analysis, by region, 2021 23
      1. \r\n
    324. Global Polyacrylamide market: Structure 25
      1. \r\n
    325. Key Buying Criteria for Polyacrylamide 25
      1. \r\n
    326. Research Process 26
      1. \r\n
    327. TOP-DOWN & BOTTOM-UP APPROACHES 29
      1. \r\n
    328. MARKET dynamics overview 32
      1. \r\n
    329. Drivers Impact Analysis: GLOBAL polyacrylamide market 34
      1. \r\n
    330. Restraint Impact Analysis: GLOBAL polyacrylamide market 35
      1. \r\n
    331. GLOBAL polyacrylamide market: SUPPLY CHAIN analysis 37
      1. \r\n
    332. global polyacrylamide Market, BY product type, 2021 (% Share) 43
      1. \r\n
    333. global polyacrylamide Market, BY product type, 2019–2030 (USD million) 43
      1. \r\n
    334. global polyacrylamide Market, BY application, 2021 (% Share) 52
      1. \r\n
    335. global polyacrylamide Market, BY application, 2019–2030 (USD million) 53
      1. \r\n
    336. global POLYACRYLAMIDE MARKET, BY region, 2019–2030 (USD Million) 66
      1. \r\n
    337. global POLYACRYLAMIDE MARKET, BY region, 2021 (% Share) 67
      1. \r\n
    338. North America: POLYACRYLAMIDE MARKET share, BY country, 2021 (% share) 70
      1. \r\n
    339. europe: POLYACRYLAMIDE MARKET share, BY country, 2021 (% share) 82
      1. \r\n
    340. Asia-Pacific: POLYACRYLAMIDE MARKET share, BY country, 2021 (% share) 109
      1. \r\n
    341. Latin America: POLYACRYLAMIDE MARKET share, BY country, 2021 (% share) 133
      1. \r\n
    342. Middle East & Africa: POLYACRYLAMIDE MARKET share, BY country, 2021 (% share) 151
      1. \r\n
    343. BASF SE: Financial Overview snapshot 172
      1. \r\n
    344. BASF SE: SWOT Analysis 173
      1. \r\n
    345. SNF GROUP: SWOT Analysis 176
      1. \r\n
    346. China National Petroleum Corporation (CNPC): Financial Overview snapshot 178
      1. \r\n
    347. China National Petroleum Corporation (CNPC): SWOT Analysis 179
      1. \r\n
    348. THE DOW CHEMICAL COMPANY: Financial Overview snapshot 182
      1. \r\n
    349. THE DOW CHEMICAL COMPANY: SWOT Analysis 183
      1. \r\n
    350. PetroChina Company Limited: Financial Overview snapshot 186
      1. \r\n
    351. PetroChina Company LIMITED: SWOT Analysis 187
      1. \r\n
    352. Black Rose Industries Ltd.: Financial Overview snapshot 188
      1. \r\n
    353. KEMIRA OYJ: Financial Overview snapshot 191


    Polyacrylamide Market Segmentation

    Polyacrylamide Product Type Outlook (USD Billion, 2019-2030)

    Anionic

    Cationic

    Non-Ionic

    Polyacrylamide Application Outlook (USD Billion, 2019-2030)

    Water Treatment

    Pulp and Paper

    Mineral Processing

    Enhanced Oil Recovery

    Others

    Polyacrylamide Regional Outlook (USD Billion, 2019-2030)

    North America Outlook (USD Billion, 2019-2030)

    North America Polyacrylamide by Product Type

    Anionic

    Cationic

    Non-Ionic

    North America Polyacrylamide by Application

    Water Treatment

    Pulp and Paper

    Mineral Processing

    Enhanced Oil Recovery

    Others

    US Outlook (USD Billion, 2019-2030)

    US Polyacrylamide by Product Type

    Anionic

    Cationic

    Non-Ionic

    US America Polyacrylamide by Application

    Water Treatment

    Pulp and Paper

    Mineral Processing

    Enhanced Oil Recovery

    Others

    Canada Outlook (USD Billion, 2019-2030)

    Canada Polyacrylamide by Product Type

    Anionic

    Cationic

    Non-Ionic

    Canada Polyacrylamide by Application

    Water Treatment

    Pulp and Paper

    Mineral Processing

    Enhanced Oil Recovery

    Others

    Europe Outlook (USD Billion, 2019-2030)

    Europe Polyacrylamide by Product Type

    Anionic

    Cationic

    Non-Ionic

    Europe Polyacrylamide by Application

    Water Treatment

    Pulp and Paper

    Mineral Processing

    Enhanced Oil Recovery

    Others

    Germany Outlook (USD Billion, 2019-2030)

    Germany Polyacrylamide by Product Type

    Anionic

    Cationic

    Non-Ionic

    Germany Polyacrylamide by Application

    Water Treatment

    Pulp and Paper

    Mineral Processing

    Enhanced Oil Recovery

    Others

    Russia Outlook (USD Billion, 2019-2030)

    Russia Polyacrylamide by Product Type

    Anionic

    Cationic

    Non-Ionic

    Germany Polyacrylamide by Application

    Water Treatment

    Pulp and Paper

    Mineral Processing

    Enhanced Oil Recovery

    Others

    France Outlook (USD Billion, 2019-2030)

    France Polyacrylamide by Product Type

    Anionic

    Cationic

    Non-Ionic

    Germany Polyacrylamide by Application

    Water Treatment

    Pulp and Paper

    Mineral Processing

    Enhanced Oil Recovery

    Others

    UK Outlook (USD Billion, 2019-2030)

    UK Polyacrylamide by Product Type

    Anionic

    Cationic

    Non-Ionic

    UK Polyacrylamide by Application

    Water Treatment

    Pulp and Paper

    Mineral Processing

    Enhanced Oil Recovery

    Others

    Italy Outlook (USD Billion, 2019-2030)

    Italy Polyacrylamide by Product Type

    Anionic

    Cationic

    Non-Ionic

    Italy Polyacrylamide by Application

    Water Treatment

    Pulp and Paper

    Mineral Processing

    Enhanced Oil Recovery

    Others

    Spain Outlook (USD Billion, 2019-2030)

    Spain Polyacrylamide by Product Type

    Anionic

    Cationic

    Non-Ionic

    Spain Polyacrylamide by Application

    Water Treatment

    Pulp and Paper

    Mineral Processing

    Enhanced Oil Recovery

    Others

    Rest Of Europe Outlook (USD Billion, 2019-2030)

    Rest Of Europe Polyacrylamide by Product Type

    Anionic

    Cationic

    Non-Ionic

    Rest of Europe Polyacrylamide by Application

    Water Treatment

    Pulp and Paper

    Mineral Processing

    Enhanced Oil Recovery

    Others

    Asia-Pacific Outlook (USD Billion, 2019-2030)

    Asia-Pacific Polyacrylamide by Product Type

    Anionic

    Cationic

    Non-Ionic

    Asia-Pacific Polyacrylamide by Application

    Water Treatment

    Pulp and Paper

    Mineral Processing

    Enhanced Oil Recovery

    Others

    China Outlook (USD Billion, 2019-2030)

    China Polyacrylamide by Product Type

    Anionic

    Cationic

    Non-Ionic

    China Polyacrylamide by Application

    Water Treatment

    Pulp and Paper

    Mineral Processing

    Enhanced Oil Recovery

    Others

    Japan Outlook (USD Billion, 2019-2030)

    Japan Polyacrylamide by Product Type

    Anionic

    Cationic

    Non-Ionic

    Japan Polyacrylamide by Application

    Water Treatment

    Pulp and Paper

    Mineral Processing

    Enhanced Oil Recovery

    Others

    India Outlook (USD Billion, 2019-2030)

    India Polyacrylamide by Product Type

    Anionic

    Cationic

    Non-Ionic

    India Polyacrylamide by Application

    Water Treatment

    Pulp and Paper

    Mineral Processing

    Others

    South Korea Outlook (USD Billion, 2019-2030)

    South Korea Polyacrylamide by Product Type

    Anionic

    Cationic

    Non-Ionic

    South Korea Polyacrylamide by Application

    Water Treatment

    Pulp and Paper

    Mineral Processing

    Enhanced Oil Recovery

    Others

    Rest of Asia-Pacific Outlook (USD Billion, 2019-2030)

    Rest of Asia-Pacific Polyacrylamide by Product Type

    Anionic

    Cationic

    Non-Ionic

    Rest of Asia-Pacific Polyacrylamide by Application

    Water Treatment

    Pulp and Paper

    Mineral Processing

    Enhanced Oil Recovery

    Others

    Middle East & Africa Outlook (USD Billion, 2019-2030)

    Middle East & Africa Polyacrylamide by Product Type

    Anionic

    Cationic

    Non-Ionic

    Middle East & Africa Polyacrylamide by Application

    Water Treatment

    Pulp and Paper

    Mineral Processing

    Enhanced Oil Recovery

    Others

    South Africa Outlook (USD Billion, 2019-2030)

    South Africa Polyacrylamide by Product Type

    Anionic

    Cationic

    Non-Ionic

    South Africa Polyacrylamide by Application

    Water Treatment

    Pulp and Paper

    Mineral Processing

    Enhanced Oil Recovery

    Others

    GCC Countries Outlook (USD Billion, 2019-2030)

    GCC Countries Polyacrylamide by Product Type

    Anionic

    Cationic

    Non-Ionic

    GCC countries Polyacrylamide by Application

    Water Treatment

    Pulp and Paper

    Mineral Processing

    Enhanced Oil Recovery

    Others

    Latin America Outlook (USD Billion, 2019-2030)

    Latin America Polyacrylamide by Product Type

    Anionic

    Cationic

    Non-Ionic

    Latin America Polyacrylamide by Application

    Water Treatment

    Pulp and Paper

    Mineral Processing

    Enhanced Oil Recovery

    Others

    Brazil Outlook (USD Billion, 2019-2030)

    Brazil Polyacrylamide by Product Type

    Anionic

    Cationic

    Non-Ionic

    Brazil Polyacrylamide by Application

    Water Treatment

    Pulp and Paper

    Mineral Processing

    Enhanced Oil Recovery

    Others

    Mexico Outlook (USD Billion, 2019-2030)

    Mexico Polyacrylamide by Product Type

    Anionic

    Cationic

    Non-Ionic

    Mexico Polyacrylamide by Application

    Water Treatment

    Pulp and Paper

    Mineral Processing

    Enhanced Oil Recovery

    Others

    Argentina Outlook (USD Billion, 2019-2030)

    Argentina Polyacrylamide by Product Type

    Anionic

    Cationic

    Non-Ionic

    Argentina Polyacrylamide by Application

    Water Treatment

    Pulp and Paper

    Mineral Processing

    Enhanced Oil Recovery

    Others

    Rest of Latin America (USD Billion, 2019-2030)

    Rest of Latin America Polyacrylamide by Product Type

    Anionic

    Cationic

    Non-Ionic

    Rest of Latin America Polyacrylamide by Application

    Water Treatment

    Pulp and Paper

    Mineral Processing

    Enhanced Oil Recovery

    Others

    Infographic

    Free Sample Request

    Kindly complete the form below to receive a free sample of this Report

    Get Free Sample

    Customer Strories

    “I am very pleased with how market segments have been defined in a relevant way for my purposes (such as "Portable Freezers & refrigerators" and "last-mile"). In general the report is well structured. Thanks very much for your efforts.”

    Victoria Milne

    Founder
    Case Study
    Chemicals and Materials

    Compare Licence

    ×
    Features License Type
    Single User Multiuser License Enterprise User
    Price $4,950 $5,950 $7,250
    Maximum User Access Limit 1 User Upto 10 Users Unrestricted Access Throughout the Organization
    Free Customization
    Direct Access to Analyst
    Deliverable Format
    Platform Access
    Discount on Next Purchase 10% 15% 15%
    Printable Versions