• Cat-intel
  • MedIntelliX
  • Resources
  • About Us
  • Hero Background
    English
    Chinese
    French
    Japanese
    Korean
    German
    Spanish

    Polyacrylamide Market Trends

    ID: MRFR/CnM/6438-CR
    140 Pages
    Priya Nagrale
    March 2023

    Polyacrylamide Market Research Report Information by Product Type (Anionic, Cationic, Non-Ionic),by type (Thermal, Acoustic, Electric, Others) by Application (Water Treatment, Pulp and Paper, Mineral Processing, Enhanced Oil Recovery, Others) And by Region (North America, Europe, Asia-Pacific, Latin America, and Middle east & Africa) - Forecast Till 2035

    Share:
    Download PDF ×

    We do not share your information with anyone. However, we may send you emails based on your report interest from time to time. You may contact us at any time to opt-out.

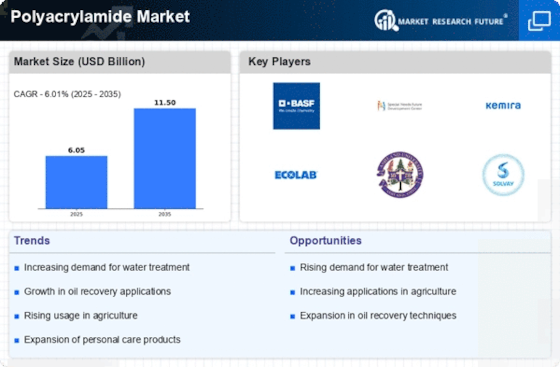
    Polyacrylamide Market Infographic
    $ 4,950.0
    $ 5,950.0
    $ 7,250.0

    Market Trends

    Key Emerging Trends in the Polyacrylamide Market

    The polyacrylamide market is undergoing significant shifts in response to various industry dynamics and evolving consumer needs. Polyacrylamide, a versatile polymer with applications ranging from water treatment to enhanced oil recovery, is witnessing noteworthy trends that shape its market landscape. One of the key trends influencing the market is the growing emphasis on water and wastewater treatment solutions. With increasing concerns about water scarcity and environmental pollution, there is a rising demand for polyacrylamide-based products in the water treatment sector. Polyacrylamide's ability to enhance the efficiency of water treatment processes, such as flocculation and sedimentation, positions it as a critical component in addressing water management challenges globally.

    Sustainability is a dominant theme in the polyacrylamide market, with a push towards environmentally friendly solutions. Manufacturers are investing in the development of bio-based and eco-friendly polyacrylamide derivatives to meet the demand for sustainable products. This trend aligns with the broader industry goal of reducing the environmental impact of chemical processes and products. Additionally, the adoption of water-soluble polyacrylamide formulations is gaining traction, particularly in agriculture and soil conditioning applications, as these formulations minimize environmental risks associated with runoff and leaching.

    Customization and innovation are key drivers in the polyacrylamide market, responding to the diverse needs of various industries. As end-users seek tailor-made solutions for specific applications, manufacturers are investing in research and development to create specialized polyacrylamide products. This trend is fostering collaborations between manufacturers and end-users, resulting in the co-creation of products that address unique challenges in areas such as agriculture, mining, and the petroleum industry.

    Globalization is reshaping the polyacrylamide market, with a surge in demand not limited to specific regions. Manufacturers are strategically expanding their market presence, diversifying their product portfolios, and engaging in mergers and acquisitions to strengthen their global footprint. The interconnected nature of markets has led to increased competition, prompting companies to innovate and offer competitive solutions on a global scale. This globalization trend is influencing supply chain dynamics, with a focus on efficiency and streamlined operations.

    The application of polyacrylamide in enhanced oil recovery (EOR) is driving market growth, particularly in the oil and gas industry. As the global demand for energy continues to rise, there is an increasing need for technologies that enhance oil extraction from reservoirs. Polyacrylamide's ability to improve the viscosity of injected water in EOR processes contributes to increased oil recovery rates, making it a crucial component in the petroleum sector.

    However, challenges persist in the polyacrylamide market, including concerns about toxicity and environmental impact. Efforts to address these challenges involve the development of safer and more sustainable polyacrylamide formulations. Additionally, regulatory compliance remains a key consideration for manufacturers, necessitating ongoing investments in research to meet evolving standards and regulations.

    Market Summary

    As per Market Research Future Analysis, the global Polyacrylamide market was valued at USD 5.71 billion in 2023 and is projected to grow to USD 6.06 billion by 2032, with a CAGR of 6.01% from 2024 to 2030. The growth is driven by increased demand for enhanced oil recovery and mining activities, where polyacrylamide is utilized as a flocculating agent for wastewater treatment. The Water Treatment segment dominated the market in 2021 and is expected to grow at a CAGR of 6.12% during the forecast period. The Asia-Pacific region accounted for USD 1.78 billion in 2021, driven by industrial wastewater treatment needs.

    Key Market Trends & Highlights

    Key trends influencing the Polyacrylamide market include:

    • Enhanced oil recovery techniques are driving demand, with current recovery rates from oilfields between 20% and 40%. The Water Treatment segment is projected to grow at a CAGR of 6.12% from 2022 to 2030. Asia-Pacific market is expected to grow at a CAGR of 5.59% from 2022 to 2030, attributed to wastewater treatment needs in developing nations. Anionic polyacrylamide held a market share of ~55-60% in 2021, driven by wastewater management awareness.

    Market Size & Forecast

    2023 Market Size USD 5.71 Billion
    2032 Market Size USD 6.06 Billion
    CAGR (2024-2030) 6.01%
    Largest Regional Market Share in 2021 Asia-Pacific.

    Major Players

    <p>Key players include BASF SE (Germany), SNF Group (France), China National Petroleum Corporation (China), The Dow Chemical Company (US), and Kemira OYJ (Finland).</p>

    Market Trends

    Increasing demand for enhanced oil recovery to boost market growth

    Rapid growth of energy demand across the globe due to increasing industrial activities is likely to create challenging situation to find new oilfields from which oil can be extracted in adequate quantities. Currently identified supplies of crude oil are anticipated to be sufficient to meet energy needs for around 50 years. Techniques for increasing the amount of oil recovered, thus, are being adopted to extend the capacity of oil reserves, whereby delaying the need to identify new giant fields.

    The global average for oil recovery from existing oilfields is only between 20% and 40%, less than half the recovery rates typically achieved in gas fields.

    Water flooding is generally the preferred option for enhanced oil recovery due to the ready availability of sea water at oilfields. This involves injecting water into the oil reservoir to displace the oil and force it to flow into the production well. The efficiency of water flooding can be increased by adding polymers to the injected water, a practice known as polymer flooding. Typically synthetic polymers are used by the oil industry for polymer flooding. Historically these were unhydrolyzed polyacrylamide-based polymers, selected because of their good chemical stability.

    However, it became apparent that these polymers did not increase viscosity substantially and showed a high level of adsorption onto mineral surfaces. Consequently, the increases in recovery rates were not huge and lost polymer continually needed to be replaced.

    Moreover, Growing mining activities is another key driver for polyacrylamide for augmenting the Polyacrylamide Market. Polyacrylamide is used as a flocculating agent to treat waste water generated during mining activities. The expansion in the mining sector is expected to propel the demand for polyacrylamide. Polyacrylamide is widely used in mining processing and in the treatment of minerals to separate mineral and mineral ore. It is also used as flocculants in the treatment of waste water from mineral processing that is formed by the mining channels during the mining process.

    Furthermore, increasing temperatures along with reduced rainfall has led to drying of river beds and lakes causing water scarcity. Anionic PAM can boost the settling mechanism of inorganic suspended solids in effluent water. This characteristic makes APAM ideal for utilization as a flocculent agent to ease solid-liquid separation in the paper and pulp industry, wastewater and drinking water treatment, aquaculture, and several other industrial applications. Besides, products that employ negatively charged polyacrylamide as their active component have exhibited low toxicity and promising performance in analyses completed to date, further pushing their adoption in the years to come.

    Thus, the increasing demand for enhanced oil recovery and increasing awareness regarding wastewater management and growing need to reduce soil erosion driving the growth of the Polyacrylamide market revenue.

    <p>The global polyacrylamide market is poised for growth, driven by increasing demand in water treatment and enhanced oil recovery applications, suggesting a robust trajectory for the industry.</p>

    U.S. Geological Survey

    Polyacrylamide Market Market Drivers

    Growth in Oil and Gas Sector

    The Global Polyacrylamide Market Industry benefits from the expansion of the oil and gas sector, where polyacrylamide is utilized in enhanced oil recovery processes. The chemical's ability to improve fluid viscosity and reduce friction losses makes it indispensable in drilling and production operations. As global energy demands rise, the oil and gas industry is likely to invest more in polyacrylamide-based solutions, contributing to market growth. The anticipated market value of 7.22 USD Billion by 2035 underscores the potential of polyacrylamide in supporting energy sector advancements.

    Market Trends and Projections

    Increasing Demand in Water Treatment

    The Global Polyacrylamide Market Industry experiences a robust demand surge due to the increasing need for effective water treatment solutions. Polyacrylamide serves as a crucial flocculant in wastewater treatment processes, facilitating the removal of contaminants and improving water quality. As urbanization accelerates, the pressure on water resources intensifies, prompting municipalities and industries to invest in advanced water treatment technologies. This trend is reflected in the projected market value of 6.05 USD Billion in 2024, indicating a growing recognition of polyacrylamide's role in sustainable water management practices.

    Agricultural Applications Driving Growth

    The Global Polyacrylamide Market Industry is significantly influenced by its applications in agriculture, particularly in soil conditioning and erosion control. Polyacrylamide enhances soil moisture retention, which is crucial for improving crop yields in arid regions. As agricultural practices evolve to address food security challenges, the adoption of polyacrylamide products is expected to rise. This trend aligns with the projected CAGR of 1.62% from 2025 to 2035, indicating a steady growth trajectory driven by agricultural innovations and sustainability efforts.

    Technological Advancements in Production

    The Global Polyacrylamide Market Industry is poised for growth due to ongoing technological advancements in production processes. Innovations in polymerization techniques and raw material sourcing are enhancing the efficiency and cost-effectiveness of polyacrylamide manufacturing. These advancements not only improve product quality but also expand the range of applications across various industries, including mining and construction. As production capabilities evolve, the market is likely to witness increased competition and diversification, contributing to a more dynamic landscape.

    Regulatory Support for Environmental Sustainability

    The Global Polyacrylamide Market Industry is positively impacted by increasing regulatory support for environmental sustainability. Governments worldwide are implementing stringent regulations aimed at reducing pollution and promoting efficient waste management practices. Polyacrylamide's effectiveness in wastewater treatment aligns with these regulatory frameworks, encouraging industries to adopt its use. This regulatory environment not only fosters market growth but also enhances the reputation of polyacrylamide as a sustainable solution in various applications, further solidifying its position in the market.

    Market Segment Insights

    Polyacrylamide Product Type Insights

    <p>The Polyacrylamide Market segmentation, based on product type, Anionic, Cationic, Non-Ionic. The Anionic segment held the majority share in 2021 contribution to around ~55-60% in respect to the Polyacrylamide Market revenue. This is primarily owing to the increasing awareness regarding wastewater management&nbsp;rising demand for Polyacrylamide.</p>

    <p>June 2022:&nbsp;Governor John Bel Edwards and SNF Holding Company President John Pittman confirmed the company is investing an additional $375 million to expand its water-treatment and water-conditioning polymer production plant near Plaquemine, Louisiana. With the investment, the company will retain 390 existing jobs while adding 150 positions with an average annual salary of $87,300, plus benefits. Louisiana Economic Development estimates that upon full employment of 540 jobs, the project will support 1,400 direct and indirect jobs in Iberville Parish and the broader Capital Region.</p>

    Polyacrylamide Application Insights

    <p>The Polyacrylamide Market segmentation, based on application, includes &nbsp;Water Treatment, Pulp and Paper, Mineral Processing, Enhanced Oil Recovery, Others. The Water Treatment segment dominated the market in 2021 and is projected to be the faster-growing segment during the forecast period, 2022-2030. Infrastructure is always known to be an essential factor in economic development, which has attracted much-renewed attention in recent years. The need for sustainable infrastructure to meet climate change challenges has influenced the demand for Polyacrylamide in developing countries. New infrastructure development and refurbishment of existing infrastructure are the driving force behind the increasing demand for Polyacrylamide.</p>

    <p>Increased demand for Polyacrylamide in various infrastructures, such as industrial, residential, and government buildings, has been seen recently. The growing prominence of room temperature control in these buildings is expected to boost the demand for Polyacrylamide further. Hence, demand in in different applications positively impacts the market growth.</p>

    <p>June 2021 Kemira has completed the installation of new state-of-the art production units for emulsion polymers and bio acrylamide monomer at its manufacturing site in Mobile, Alabama. The capacity expansion in Mobile will strengthen Kemira’s position in the energy market in the Americas and supports our growth in the region going forward. This development has further increased market share in the &nbsp;Polyacrylamide industry.</p>

    Polyacrylamide Application Insights

    <p>Based on application, the global Polyacrylamide industry has been segmented into &nbsp;Water Treatment, Pulp and Paper, Mineral Processing, Enhanced Oil Recovery, and Others.&nbsp; Water Treatment held the largest segment share in 2021, Water reuse and recycling processes have gained considerable traction over the years due to the worsening drinking water shortages and the growing needs of the global population. The Water Treatment segment is expected to bolster at a 6.12% CAGR during the assessed timeline.</p>

    Get more detailed insights about Polyacrylamide Market Research Report - Global Forecast till 2030

    Regional Insights

    By Region, the study segments the market into North America, Europe, Asia-Pacific, Latin America, and Middle east & Africa. Asia-Pacific Polyacrylamide market accounted for USD 1.78 billion in 2021 and is expected to exhibit an 5.59% CAGR during the study period. This is attributed to the robust base of pharmaceutical and chemical manufacturing industries in the region has resulted in huge volumes of wastewater, which is expected to propel the demand for polyacrylamide as a water treatment chemical.

    Further, the major countries studied are: The U.S, Canada, Germany, France, UK, Italy, Spain, China, Japan, India, Australia, South Korea, and Brazil.

    Figure 3: POLYACRYLAMIDE MARKET SHARE BY REGION 2021 (%)POLYACRYLAMIDE MARKET SHARE BY REGION 2021Source: Secondary Research, Primary Research, Market Research Future Database and Analyst Review

    Europe Polyacrylamide market accounts for the second-largest market share due to the growing investments in water recycling and purification technology. Further, the Germany Polyacrylamide market held the largest market share, and the UK Polyacrylamide market was the fastest growing market in the European region

    The Asia-Pacific Polyacrylamide Market is expected to grow at a CAGR of 5.59% from 2022 to 2030. This is because of the increasing demand of wastewater treatment for most of the industrial applications in developing nations like China and India. Moreover, China Polyacrylamide market held the largest market share, and the India Polyacrylamide market was the fastest growing market in the Asia-Pacific region

    For instance, India Polyacrylamide market is the favored destination for Polyacrylamide manufacturers due to the wastewater treatment. On the other hand, Japan is famous for the technology industry. Hence, Asia-Pacific is anticipated to register the highest growth rate over the forecast period from 2022–2030.

    Key Players and Competitive Insights

    Major market players are spending a lot of money on R&D to increase their product lines, which will help the Polyacrylamide market grow even more. Market participants are also taking a range of strategic initiatives to grow their worldwide footprint, including new product launches, contractual agreements, mergers and acquisitions, increased investments, and collaboration with other organizations. Competitors in the Polyacrylamide industry must offer cost-effective items to expand and survive in an increasingly competitive and rising market environment.

    One of the primary business strategies adopted by manufacturers in the global Polyacrylamide industry to benefit clients and expand the Polyacrylamide market sector is to manufacture locally to reduce operating costs. In recent years, Polyacrylamide has provided some of the most significant benefits.

    SNF (France) is a privately held, specialty chemical company based in the Rhone-Alpes region of France, with a long-standing presence on every continent. With 21 production sites in Europe, Asia, Australia, and America, with a production capacity of 1,325,000 tonnes, SNF has the largest polyacrylamide production capacity in the world. SNF products are sold into 130 countries, across every sector of the economy, with 70 subsidiaries located in more than 40 countries, in 3 major economic regions.

    In July 2022, Governor John Bel Edwards and SNF Holding Company President John Pittman confirmed the company is investing an additional $375 million to expand its water-treatment and water-conditioning polymer production plant near Plaquemine, Louisiana. With the investment, the company will retain 390 existing jobs while adding 150 positions with an average annual salary of $87,300, plus benefits. Louisiana Economic Development estimates that upon full employment of 540 jobs, the project will support 1,400 direct and indirect jobs in Iberville Parish and the broader Capital Region.

    Also, BASF SE (Germany) is one of the leading chemical producers in the world. Its portfolio is organized into six segments, namely, chemicals, materials, industrial solutions, surface technologies, nutrition & care, and agricultural solutions. The company has an extensive regional presence. It has subsidiaries and joint ventures in more than 80 countries and operates 390 production sites in Europe, Asia-Pacific, North America, and Africa. BASF has customers across more than 190 countries and supplies products to a range of industries. In April 2019, BASF expands production of polyacrylamide powder in Nanjing, China.

    The new fully owned asset in China expands BASF’s global PAM manufacturing footprint for the mining and oilfield industries which relies primarily on long term supply agreements with production units in Europe, North America and Australia.

    Key Companies in the Polyacrylamide Market market include

    Industry Developments

    April 2019 BASF expands production of polyacrylamide powder in Nanjing, China. The new fully owned asset in China expands BASF’s global PAM manufacturing footprint for the mining and oilfield industries which relies primarily on long term supply agreements with production units in Europe, North America and Australia.

    July 2018 BASF, one of the world leaders in the manufacturing of construction chemicals increased the production capacity of Neopor (expandable polystyrene containing graphite) by 40,000 metric tons per year through its two production sites in Ludwigshafen, Germany, and Ulsan, Korea. At the Ulsan site in Korea, BASF will switch the plant’s entire 85,000 metric tons capacity from white EPS (expandable polystyrene) Styropor to Neopor (grey EPS), which will help the company meet the growing demand for grey material in the Asian market.

    April 2023 Ashland Inc. announced the expansion of its polyacrylamide production capacity in China. The expansion is expected to be completed in the second half of 2023.

    June 2023 Kemira announced the acquisition of the polyacrylamide business of Nalco Water. The acquisition is expected to strengthen Kemira's position in the global polyacrylamide market.

    Future Outlook

    Polyacrylamide Market Future Outlook

    <p>The Global Polyacrylamide Market is projected to grow at a 1.62% CAGR from 2024 to 2035, driven by increasing demand in water treatment and agriculture.</p>

    New opportunities lie in:

    • <p>Develop biodegradable polyacrylamide products for eco-conscious markets. Expand applications in enhanced oil recovery for energy sector growth. Leverage digital technologies for efficient production processes and cost reduction.</p>

    <p>By 2035, the Polyacrylamide Market is expected to achieve robust growth, reflecting evolving industry needs.</p>

    Market Segmentation

    Polyacrylamide Regional Outlook

    • {"North America"=>["US"
    • "Canada"]}
    • {"Europe"=>["Germany"
    • "France"
    • "UK"
    • "Italy"
    • "Spain"
    • "Russia"
    • "Rest of Europe"]}
    • {"Asia-Pacific"=>["China"
    • "Japan"
    • "India"
    • "South Korea"
    • "Rest of Asia-Pacific"]}
    • {"Latin America"=>["Brazil"
    • "Mexico"
    • "Argentina"
    • "Rest of Latin America"]}
    • {"MEA"=>["GCC Countries"
    • "South Africa"
    • "Rest of MEA"]}

    Polyacrylamide Application Outlook

    • Water Treatment
    • Pulp and Paper
    • Mineral Processing
    • Enhanced Oil Recovery
    • Others

    Polyacrylamide Product Type Outlook

    • Anionic
    • Cationic
    • Non-Ionic

    Report Scope

    Report Attribute/MetricDetails
    Market Size 2023USD 5.71 billion
    Market Size 2024USD 6.05 billion
    Market Size 2032USD 6.06 billion
    Compound Annual Growth Rate (CAGR)6.01 % (2024-2030)
    Base Year2023
    Forecast Period2024-2030
    Historical Data2019 & 2020
    Forecast UnitsValue (USD Billion)
    Report CoverageRevenue Forecast, Competitive Landscape, Growth Factors, and Trends
    Segments CoveredProduct Type, Application, and Region
    Geographies CoveredNorth America, Europe, Asia Pacific, Latin America, and Middle East and Africa
    Countries CoveredThe U.S, Canada, Germany, France, UK, Italy, Spain, China, Japan, India, Australia, South Korea, and Brazil
    Key Companies ProfiledBASF SE (Germany), SNF Group (France), China National Petroleum Corporation (China), The Dow Chemical Company (US), PetroChina Company Limited (China)
    Key Market OpportunitiesIncrease in the demand for enhanced oil recovery
    Key Market DynamicsIncreasing awareness regarding wastewater management and growing need to reduce soil erosion

    Market Highlights

    Author

    Priya Nagrale
    Senior Research Analyst

    She holds an experience of about 6+ years in market research and business consulting, working under the spectrum of information communication technology, telecommunications and semiconductor domains. aarti conceptualizes and implements a scalable business strategy and provides strategic leadership to the clients. her expertise lies in market estimation, competitive intelligence, pipeline analysis, customer assessment, etc.

    Leave a Comment

    Latest Comments

    John Doe
    john@example.com

    This is a great article! Really helped me understand the topic better.

    Posted on July 23, 2025, 10:15 AM
    Jane Smith
    jane@domain.com

    Thanks for sharing this. I’ve bookmarked it for later reference.

    Posted on July 22, 2025, 7:45 PM

    FAQs

    How much is the Polyacrylamide market?

    The Polyacrylamide Market is USD 5.71 billion in 2023

    What is the growth rate of the Polyacrylamide market?

    The Polyacrylamide Market is expected to grow at a CAGR of 6.01%

    Which region held the largest market share in the Polyacrylamide market?

    Asia-Pacific held the largest market share in the Polyacrylamide market

    Which Product Type led the Polyacrylamide market?

    Anionic led the Polyacrylamide market

    Which Application had the largest market share in the Polyacrylamide market?

    Wastewater treatment had the largest market share in the Polyacrylamide market

    1. . 44
      1. Anionic. 45
      2. Anionic: MARKET ESTIMATES & FORECAST, BY REGION, 2019–
    2. Anionic. 45
    3. Anionic: MARKET ESTIMATES & FORECAST, BY REGION, 2019–
    4. . 45
      1. cationic. 47
      2. cationic: MARKET ESTIMATES & FORECAST, BY REGION, 2019–
    5. cationic. 47
    6. cationic: MARKET ESTIMATES & FORECAST, BY REGION, 2019–
    7. . 47
      1. non-ionic. 49
      2. non-ionic: MARKET ESTIMATES & FORECAST, BY REGION, 2019–
    8. non-ionic. 49
    9. non-ionic: MARKET ESTIMATES & FORECAST, BY REGION, 2019–
    10. . 49 7 GLOBAL polyacrylamide MARKET, BY application.. 52
      1. OVERVIEW.. 52
      2. GLOBAL POLYACRYLAMIDE MARKET ESTIMATES & FORECAST, BY application, 2019–
    11. OVERVIEW.. 52
    12. GLOBAL POLYACRYLAMIDE MARKET ESTIMATES & FORECAST, BY application, 2019–
    13. . 53
      1. Water Treatment. 55
      2. Water Treatment: MARKET ESTIMATES & FORECAST, BY REGION, 2019–
    14. Water Treatment. 55
    15. Water Treatment: MARKET ESTIMATES & FORECAST, BY REGION, 2019–
    16. . 55
      1. Pulp and Paper. 57
      2. Pulp and Paper: MARKET ESTIMATES & FORECAST, BY REGION, 2019–
    17. Pulp and Paper. 57
    18. Pulp and Paper: MARKET ESTIMATES & FORECAST, BY REGION, 2019–
    19. . 57
      1. Mineral Processing. 59
      2. Mineral Processing: MARKET ESTIMATES & FORECAST, BY REGION, 2019–
    20. Mineral Processing. 59
    21. Mineral Processing: MARKET ESTIMATES & FORECAST, BY REGION, 2019–
    22. . 59
      1. Enhanced Oil Recovery. 61
      2. Enhanced Oil Recovery: MARKET ESTIMATES & FORECAST, BY REGION, 2019–
    23. Enhanced Oil Recovery. 61
    24. Enhanced Oil Recovery: MARKET ESTIMATES & FORECAST, BY REGION, 2019–
    25. . 61
      1. Others. 63
      2. Others: MARKET ESTIMATES & FORECAST, BY REGION, 2019–
    26. Others. 63
    27. Others: MARKET ESTIMATES & FORECAST, BY REGION, 2019–
    28. . 63 8 GLOBAL POLYACRYLAMIDE MARKET, BY REGION.. 66
      1. OVERVIEW.. 66
      2. global POLYACRYLAMIDE MARKET ESTIMATES & forecast, BY REGION, 2019–
    29. OVERVIEW.. 66
    30. global POLYACRYLAMIDE MARKET ESTIMATES & forecast, BY REGION, 2019–
    31. . 67
      1. NORTH AMERICA. 70
      2. US. 75
      3. Canada. 78
      4. europe. 82
      5. Germany. 87
      6. UK. 90
      7. france. 93
      8. russia. 96
      9. spain. 99
      10. italy. 102
      11. Rest of Europe. 105
      12. Asia-Pacific. 109
      13. china. 114
      14. Japan. 117
      15. India. 120
      16. South Korea. 123
      17. Australia & New Zealand. 126
      18. Rest of Asia-Pacific. 129
      19. Latin America. 133
      20. Brazil. 138
      21. Mexico. 141
      22. Argentina. 144
      23. Rest of Latin America. 147
      24. Middle East & Africa. 151
      25. Turkey. 156
      26. South Africa. 159
      27. GCC Countries. 162
      28. Rest of the Middle East & Africa. 165 9 Competitive Landscape.. 169
      29. Introduction. 169
      30. COMPETITIVE BENCHMARKING. 169
      31. Global MArket Strategies. 170
      32. KEY DEVELOPMENTS & GROWTH STRATEGIES. 170
      33. expansions. 170 10 Company Profiles.. 171
      34. BASF SE. 171
      35. COMPANY OVERVIEW.. 171
      36. FINANCIAL OVERVIEW.. 172
      37. PRODUCTS OFFERED. 172
      38. KEY DEVELOPMENTS. 173
      39. SWOT ANALYSIS. 173
      40. KEY STRATEGIES. 174
      41. SNF GROUP. 175
      42. COMPANY OVERVIEW.. 175
      43. FINANCIAL OVERVIEW.. 175
      44. PRODUCTS OFFERed. 175
      45. KEY DEVELOPMENTS. 176
      46. SWOT ANALYSIS. 176
      47. KEY STRATEGIES. 177
      48. China National Petroleum Corporation (CNPC) 178
      49. COMPANY OVERVIEW.. 178
      50. FINANCIAL OVERVIEW.. 178
      51. PRODUCTS OFFERed. 179
      52. KEY DEVELOPMENTS. 179
      53. SWOT ANALYSIS. 179
      54. KEY STRATEGIES. 180
      55. The Dow Chemical Company. 181
      56. COMPANY OVERVIEW.. 181
      57. FINANCIAL OVERVIEW.. 182
      58. PRODUCTS OFFERed. 183
      59. KEY DEVELOPMENTS. 183
      60. SWOT ANALYSIS. 183
      61. Key Strategies. 184
      62. PetroChina Company Limited. 185
      63. COMPANY OVERVIEW.. 185
      64. FINANCIAL OVERVIEW.. 186
      65. PRODUCTS OFFERed. 186
      66. KEY DEVELOPMENTS. 186
      67. SWOT ANALYSIS. 187
      68. Key Strategies. 187
      69. Black Rose Industries Ltd. 188
      70. COMPANY OVERVIEW.. 188
      71. FINANCIAL OVERVIEW.. 188
      72. PRODUCTS OFFERED. 189
      73. KEY DEVELOPMENTS. 189
      74. KEY STRATEGIES. 189
      75. Xitao Polymer Co., Ltd. 190
      76. COMPANY OVERVIEW.. 190
      77. FINANCIAL OVERVIEW.. 190
      78. PRODUCTS OFFERED. 190
      79. KEY DEVELOPMENTS. 190
      80. KEY STRATEGIES. 190
      81. kemira oyj. 191
      82. COMPANY OVERVIEW.. 191
      83. FINANCIAL OVERVIEW.. 191
      84. PRODUCTS OFFERED. 192
      85. KEY DEVELOPMENTS. 192
      86. KEY STRATEGIES. 192
      87. ZL Petrochemicals Co., Ltd. 193
      88. COMPANY OVERVIEW.. 193
      89. FINANCIAL OVERVIEW.. 193
      90. PRODUCTS OFFERED. 193
      91. KEY DEVELOPMENTS. 193
      92. KEY STRATEGIES. 193
      93. Anhui Jucheng Fine Chemicals Co., Ltd. 194
      94. COMPANY OVERVIEW.. 194
      95. FINANCIAL OVERVIEW.. 194
      96. PRODUCTS OFFERED. 194
      97. KEY DEVELOPMENTS. 195
      98. KEY STRATEGIES. 195 11 References.. 196 LIST OF TABLES TABLE 1 Primary Interviews 27 TABLE 2 List of assumptions & Limitations 31 TABLE 3 Pricing Overview of polyacrylamide, By region (USD/Ton) 42 TABLE 4 Global POLYACRYLAMIDE Market Estimates & Forecast, BY product type, 2019–2025 (USD million) 44 TABLE 5 Global POLYACRYLAMIDE Market Estimates & Forecast, BY product type, 2026–2030 (USD million) 44 TABLE 6 Global POLYACRYLAMIDE Market Estimates & Forecast, BY product type, 2019–2025 (Kilo Tons) 44 TABLE 7 Global POLYACRYLAMIDE Market Estimates & Forecast, BY product type, 2026–2030 (Kilo Tons) 45 TABLE 8 Anionic: MARKET ESTIMATES & forecast, BY REGION, 2019–2025 (USD million) 45 TABLE 9 Anionic: MARKET ESTIMATES & forecast, BY REGION, 2026–2030 (USD million) 46 TABLE 10 Anionic: MARKET ESTIMATES & forecast, BY REGION, 2019–2025 (Kilo Tons) 46 TABLE 11 Anionic: MARKET ESTIMATES & forecast, BY REGION, 2026–2030 (Kilo Tons) 47 TABLE 12 cationic: MARKET ESTIMATES & forecast, BY REGION, 2019–2025 (USD million) 47 TABLE 13 cationic: MARKET ESTIMATES & forecast, BY REGION, 2026–2030 (USD million) 48 TABLE 14 cationic: MARKET ESTIMATES & forecast, BY REGION, 2019–2025 (Kilo Tons) 48 TABLE 15 cationic: MARKET ESTIMATES & forecast, BY REGION, 2026–2030 (Kilo Tons) 49 TABLE 16 non-ionic: MARKET ESTIMATES & forecast, BY REGION, 2019–2025 (USD million) 49 TABLE 17 non-ionic: MARKET ESTIMATES & forecast, BY REGION, 2026–2030 (USD million) 50 TABLE 18 non-ionic: MARKET ESTIMATES & forecast, BY REGION, 2019–2025 (Kilo Tons) 50 TABLE 19 non-ionic: MARKET ESTIMATES & forecast, BY REGION, 2026–2030 (Kilo Tons) 51 TABLE 20 Global POLYACRYLAMIDE Market Estimates & Forecast, BY application, 2019–2025 (USD million) 53 TABLE 21 Global POLYACRYLAMIDE Market Estimates & Forecast, BY application, 2026–2030 (USD million) 54 TABLE 22 Global POLYACRYLAMIDE Market Estimates & Forecast, BY application, 2019–2025 (Kilo Tons) 54 TABLE 23 Global POLYACRYLAMIDE Market Estimates & Forecast, BY application, 2026–2030 (Kilo Tons) 55 TABLE 24 Water Treatment: MARKET ESTIMATES & forecast, BY REGION, 2019–2025 (USD million) 55 TABLE 25 Water Treatment: MARKET ESTIMATES & forecast, BY REGION, 2026–2030 (USD million) 56 TABLE 26 Water Treatment: MARKET ESTIMATES & forecast, BY REGION, 2019–2025 (Kilo Tons) 56 TABLE 27 Water Treatment: MARKET ESTIMATES & forecast, BY REGION, 2026–2030 (Kilo Tons) 57 TABLE 28 Pulp and Paper: MARKET ESTIMATES & forecast, BY REGION, 2019–2025 (USD million) 57 TABLE 29 Pulp and Paper: MARKET ESTIMATES & forecast, BY REGION, 2026–2030 (USD million) 58 TABLE 30 Pulp and Paper: MARKET ESTIMATES & forecast, BY REGION, 2019–2025 (Kilo Tons) 58 TABLE 31 Pulp and Paper: MARKET ESTIMATES & forecast, BY REGION, 2026–2030 (Kilo Tons) 59 TABLE 32 Mineral Processing: MARKET ESTIMATES & forecast, BY REGION, 2019–2025 (USD million) 59 TABLE 33 Mineral Processing: MARKET ESTIMATES & forecast, BY REGION, 2026–2030 (USD million) 60 TABLE 34 Mineral Processing: MARKET ESTIMATES & forecast, BY REGION, 2019–2025 (Kilo Tons) 60 TABLE 35 Mineral Processing: MARKET ESTIMATES & forecast, BY REGION, 2026–2030 (Kilo Tons) 61 TABLE 36 Enhanced Oil Recovery: MARKET ESTIMATES & forecast, BY REGION, 2019–2025 (USD million) 61 TABLE 37 Enhanced Oil Recovery: MARKET ESTIMATES & forecast, BY REGION, 2026–2030 (USD million) 62 TABLE 38 Enhanced Oil Recovery: MARKET ESTIMATES & forecast, BY REGION, 2019–2025 (Kilo Tons) 62 TABLE 39 Enhanced Oil Recovery: MARKET ESTIMATES & forecast, BY REGION, 2026–2030 (Kilo Tons) 63 TABLE 40 Others: MARKET ESTIMATES & forecast, BY REGION, 2019–2025 (USD million) 63 TABLE 41 Others: MARKET ESTIMATES & forecast, BY REGION, 2026–2030 (USD million) 64 TABLE 42 Others: MARKET ESTIMATES & forecast, BY REGION, 2019–2025 (Kilo Tons) 64 TABLE 43 Others: MARKET ESTIMATES & forecast, BY REGION, 2026–2030 (Kilo Tons) 65 TABLE 44 global POLYACRYLAMIDE MARKET ESTIMATES & forecast, BY REGION, 2019–2025 (USD million) 67 TABLE 45 global POLYACRYLAMIDE MARKET ESTIMATES & forecast, BY REGION, 2026–2030 (USD million) 68 TABLE 46 global POLYACRYLAMIDE MARKET ESTIMATES & forecast, BY REGION, 2019–2025 (kilo tons) 68 TABLE 47 global POLYACRYLAMIDE MARKET ESTIMATES & forecast, BY REGION, 2026–2030 (kilo tons) 69 TABLE 48 North america: Market ESTIMATES & forecast, BY country, 2019–2025 (USD million) 70 TABLE 49 North america: Market ESTIMATES & forecast, BY country, 2026–2030 (USD million) 71 TABLE 50 North america: Market ESTIMATES & forecast, BY country, 2019–2025 (kilo tons) 71 TABLE 51 North america: Market ESTIMATES & forecast, BY country, 2026–2030 (kilo tons) 71 TABLE 52 North America: POLYACRYLAMIDE Market, BY product type, 2019–2025 (USD million) 72 TABLE 53 North America: POLYACRYLAMIDE Market, BY product type, 2026–2030 (USD million) 72 TABLE 54 North America: POLYACRYLAMIDE Market, BY product type, 2019–2025 (kilo tons) 72 TABLE 55 North America: POLYACRYLAMIDE Market, BY product type, 2026–2030 (kilo tons) 73 TABLE 56 North America: POLYACRYLAMIDE Market, BY application, 2019–2025 (USD million) 73 TABLE 57 North America: POLYACRYLAMIDE Market, BY application, 2026–2030 (USD million) 74 TABLE 58 North America: POLYACRYLAMIDE Market, BY application, 2019–2025 (kilo tons) 74 TABLE 59 North America: POLYACRYLAMIDE Market, BY application, 2026–2030 (kilo tons) 75 TABLE 60 US: POLYACRYLAMIDE Market, BY product type, 2019–2025 (USD million) 75 TABLE 61 US: POLYACRYLAMIDE Market, BY product type, 2026–2030 (USD million) 76 TABLE 62 US: POLYACRYLAMIDE Market, BY product type, 2019–2025 (kilo tons) 76 TABLE 63 US: POLYACRYLAMIDE Market, BY product type, 2026–2030 (kilo tons) 76 TABLE 64 US: POLYACRYLAMIDE Market, BY application, 2019–2025 (USD million) 77 TABLE 65 US: POLYACRYLAMIDE Market, BY application, 2026–2030 (USD million) 77 TABLE 66 US: POLYACRYLAMIDE Market, BY application, 2019–2025 (kilo tons) 77 TABLE 67 US: POLYACRYLAMIDE Market, BY application, 2026–2030 (kilo tons) 78 TABLE 68 Canada: POLYACRYLAMIDE Market, BY product type, 2019–2025 (USD million) 78 TABLE 69 Canada: POLYACRYLAMIDE Market, BY product type, 2026–2030 (USD million) 79 TABLE 70 Canada: POLYACRYLAMIDE Market, BY product type, 2019–2025 (kilo tons) 79 TABLE 71 Canada: POLYACRYLAMIDE Market, BY product type, 2026–2030 (kilo tons) 79 TABLE 72 Canada: POLYACRYLAMIDE Market, BY application, 2019–2025 (USD million) 80 TABLE 73 Canada: POLYACRYLAMIDE Market, BY application, 2026–2030 (USD million) 80 TABLE 74 Canada: POLYACRYLAMIDE Market, BY application, 2019–2025 (kilo tons) 80 TABLE 75 Canada: POLYACRYLAMIDE Market, BY application, 2026–2030 (kilo tons) 81 TABLE 76 europe: Market ESTIMATES & forecast, BY country, 2019–2025 (USD million) 82 TABLE 77 europe: Market ESTIMATES & forecast, BY country, 2026–2030 (USD million) 83 TABLE 78 europe: Market ESTIMATES & forecast, BY country, 2019–2025 (kilo tons) 83 TABLE 79 europe: Market ESTIMATES & forecast, BY country, 2026–2030 (kilo tons) 84 TABLE 80 europe: POLYACRYLAMIDE Market, BY product type, 2019–2025 (USD million) 84 TABLE 81 europe: POLYACRYLAMIDE Market, BY product type, 2026–2030 (USD million) 85 TABLE 82 europe: POLYACRYLAMIDE Market, BY product type, 2019–2025 (kilo tons) 85 TABLE 83 europe: POLYACRYLAMIDE Market, BY product type, 2026–2030 (kilo tons) 85 TABLE 84 europe: POLYACRYLAMIDE Market, BY application, 2019–2025 (USD million) 86 TABLE 85 europe: POLYACRYLAMIDE Market, BY application, 2026–2030 (USD million) 86 TABLE 86 europe: POLYACRYLAMIDE Market, BY application, 2019–2025 (kilo tons) 86 TABLE 87 europe: POLYACRYLAMIDE Market, BY application, 2026–2030 (kilo tons) 87 TABLE 88 Germany: POLYACRYLAMIDE Market, BY product type, 2019–2025 (USD million) 87 TABLE 89 Germany: POLYACRYLAMIDE Market, BY product type, 2026–2030 (USD million) 88 TABLE 90 Germany: POLYACRYLAMIDE Market, BY product type, 2019–2025 (kilo tons) 88 TABLE 91 Germany: POLYACRYLAMIDE Market, BY product type, 2026–2030 (kilo tons) 88 TABLE 92 Germany: POLYACRYLAMIDE Market, BY application, 2019–2025 (USD million) 89 TABLE 93 Germany: POLYACRYLAMIDE Market, BY application, 2026–2030 (USD million) 89 TABLE 94 Germany: POLYACRYLAMIDE Market, BY application, 2019–2025 (kilo tons) 89 TABLE 95 Germany: POLYACRYLAMIDE Market, BY application, 2026–2030 (kilo tons) 90 TABLE 96 UK: POLYACRYLAMIDE Market, BY product type, 2019–2025 (USD million) 90 TABLE 97 UK: POLYACRYLAMIDE Market, BY product type, 2026–2030 (USD million) 91 TABLE 98 UK: POLYACRYLAMIDE Market, BY product type, 2019–2025 (kilo tons) 91 TABLE 99 UK: POLYACRYLAMIDE Market, BY product type, 2026–2030 (kilo tons) 91 TABLE 100 UK: POLYACRYLAMIDE Market, BY application, 2019–2025 (USD million) 92 TABLE 101 UK: POLYACRYLAMIDE Market, BY application, 2026–2030 (USD million) 92 TABLE 102 UK: POLYACRYLAMIDE Market, BY application, 2019–2025 (kilo tons) 92 TABLE 103 UK: POLYACRYLAMIDE Market, BY application, 2026–2030 (kilo tons) 93 TABLE 104 france: POLYACRYLAMIDE Market, BY product type, 2019–2025 (USD million) 93 TABLE 105 france: POLYACRYLAMIDE Market, BY product type, 2026–2030 (USD million) 94 TABLE 106 france: POLYACRYLAMIDE Market, BY product type, 2019–2025 (kilo tons) 94 TABLE 107 france: POLYACRYLAMIDE Market, BY product type, 2026–2030 (kilo tons) 94 TABLE 108 france: POLYACRYLAMIDE Market, BY application, 2019–2025 (USD million) 95 TABLE 109 france: POLYACRYLAMIDE Market, BY application, 2026–2030 (USD million) 95 TABLE 110 france: POLYACRYLAMIDE Market, BY application, 2019–2025 (kilo tons) 95 TABLE 111 france: POLYACRYLAMIDE Market, BY application, 2026–2030 (kilo tons) 96 TABLE 112 russia: POLYACRYLAMIDE Market, BY product type, 2019–2025 (USD million) 96 TABLE 113 russia: POLYACRYLAMIDE Market, BY product type, 2026–2030 (USD million) 97 TABLE 114 russia: POLYACRYLAMIDE Market, BY product type, 2019–2025 (kilo tons) 97 TABLE 115 russia: POLYACRYLAMIDE Market, BY product type, 2026–2030 (kilo tons) 97 TABLE 116 russia: POLYACRYLAMIDE Market, BY application, 2019–2025 (USD million) 98 TABLE 117 russia: POLYACRYLAMIDE Market, BY application, 2026–2030 (USD million) 98 TABLE 118 russia: POLYACRYLAMIDE Market, BY application, 2019–2025 (kilo tons) 98 TABLE 119 russia: POLYACRYLAMIDE Market, BY application, 2026–2030 (kilo tons) 99 TABLE 120 spain: POLYACRYLAMIDE Market, BY product type, 2019–2025 (USD million) 99 TABLE 121 spain: POLYACRYLAMIDE Market, BY product type, 2026–2030 (USD million) 100 TABLE 122 spain: POLYACRYLAMIDE Market, BY product type, 2019–2025 (kilo tons) 100 TABLE 123 spain: POLYACRYLAMIDE Market, BY product type, 2026–2030 (kilo tons) 100 TABLE 124 spain: POLYACRYLAMIDE Market, BY application, 2019–2025 (USD million) 101 TABLE 125 spain: POLYACRYLAMIDE Market, BY application, 2026–2030 (USD million) 101 TABLE 126 spain: POLYACRYLAMIDE Market, BY application, 2019–2025 (kilo tons) 101 TABLE 127 spain: POLYACRYLAMIDE Market, BY application, 2026–2030 (kilo tons) 102 TABLE 128 italy: POLYACRYLAMIDE Market, BY product type, 2019–2025 (USD million) 102 TABLE 129 italy: POLYACRYLAMIDE Market, BY product type, 2026–2030 (USD million) 103 TABLE 130 italy: POLYACRYLAMIDE Market, BY product type, 2019–2025 (kilo tons) 103 TABLE 131 italy: POLYACRYLAMIDE Market, BY product type, 2026–2030 (kilo tons) 103 TABLE 132 italy: POLYACRYLAMIDE Market, BY application, 2019–2025 (USD million) 104 TABLE 133 italy: POLYACRYLAMIDE Market, BY application, 2026–2030 (USD million) 104 TABLE 134 italy: POLYACRYLAMIDE Market, BY application, 2019–2025 (kilo tons) 104 TABLE 135 italy: POLYACRYLAMIDE Market, BY application, 2026–2030 (kilo tons) 105 TABLE 136 Rest of Europe: POLYACRYLAMIDE Market, BY product type, 2019–2025 (USD million) 105 TABLE 137 Rest of Europe: POLYACRYLAMIDE Market, BY product type, 2026–2030 (USD million) 106 TABLE 138 Rest of Europe: POLYACRYLAMIDE Market, BY product type, 2019–2025 (kilo tons) 106 TABLE 139 Rest of Europe: POLYACRYLAMIDE Market, BY product type, 2026–2030 (kilo tons) 106 TABLE 140 Rest of Europe: POLYACRYLAMIDE Market, BY application, 2019–2025 (USD million) 107 TABLE 141 Rest of Europe: POLYACRYLAMIDE Market, BY application, 2026–2030 (USD million) 107 TABLE 142 Rest of Europe: POLYACRYLAMIDE Market, BY application, 2019–2025 (kilo tons) 107 TABLE 143 Rest of Europe: POLYACRYLAMIDE Market, BY application, 2026–2030 (kilo tons) 108 TABLE 144 Asia-Pacific: Market ESTIMATES & forecast, BY country, 2019–2025 (USD million) 109 TABLE 145 Asia-Pacific: Market ESTIMATES & forecast, BY country, 2026–2030 (USD million) 110 TABLE 146 Asia-Pacific: Market ESTIMATES & forecast, BY country, 2019–2025 (kilo tons) 110 TABLE 147 Asia-Pacific: Market ESTIMATES & forecast, BY country, 2026–2030 (kilo tons) 111 TABLE 148 Asia-Pacific: POLYACRYLAMIDE Market, BY product type, 2019–2025 (USD million) 111 TABLE 149 Asia-Pacific: POLYACRYLAMIDE Market, BY product type, 2026–2030 (USD million) 112 TABLE 150 Asia-Pacific: POLYACRYLAMIDE Market, BY product type, 2019–2025 (kilo tons) 112 TABLE 151 Asia-Pacific: POLYACRYLAMIDE Market, BY product type, 2026–2030 (kilo tons) 112 TABLE 152 Asia-Pacific: POLYACRYLAMIDE Market, BY application, 2019–2025 (USD million) 113 TABLE 153 Asia-Pacific: POLYACRYLAMIDE Market, BY application, 2026–2030 (USD million) 113 TABLE 154 Asia-Pacific: POLYACRYLAMIDE Market, BY application, 2019–2025 (kilo tons) 113 TABLE 155 Asia-Pacific: POLYACRYLAMIDE Market, BY application, 2026–2030 (kilo tons) 114 TABLE 156 china: POLYACRYLAMIDE Market, BY product type, 2019–2025 (USD million) 114 TABLE 157 china: POLYACRYLAMIDE Market, BY product type, 2026–2030 (USD million) 115 TABLE 158 china: POLYACRYLAMIDE Market, BY product type, 2019–2025 (kilo tons) 115 TABLE 159 china: POLYACRYLAMIDE Market, BY product type, 2026–2030 (kilo tons) 115 TABLE 160 china: POLYACRYLAMIDE Market, BY application, 2019–2025 (USD million) 116 TABLE 161 china: POLYACRYLAMIDE Market, BY application, 2026–2030 (USD million) 116 TABLE 162 china: POLYACRYLAMIDE Market, BY application, 2019–2025 (kilo tons) 116 TABLE 163 china: POLYACRYLAMIDE Market, BY application, 2026–2030 (kilo tons) 117 TABLE 164 Japan: POLYACRYLAMIDE Market, BY product type, 2019–2025 (USD million) 117 TABLE 165 Japan: POLYACRYLAMIDE Market, BY product type, 2026–2030 (USD million) 118 TABLE 166 Japan: POLYACRYLAMIDE Market, BY product type, 2019–2025 (kilo tons) 118 TABLE 167 Japan: POLYACRYLAMIDE Market, BY product type, 2026–2030 (kilo tons) 118 TABLE 168 Japan: POLYACRYLAMIDE Market, BY application, 2019–2025 (USD million) 119 TABLE 169 Japan: POLYACRYLAMIDE Market, BY application, 2026–2030 (USD million) 119 TABLE 170 Japan: POLYACRYLAMIDE Market, BY application, 2019–2025 (kilo tons) 119 TABLE 171 Japan: POLYACRYLAMIDE Market, BY application, 2026–2030 (kilo tons) 120 TABLE 172 India: POLYACRYLAMIDE Market, BY product type, 2019–2025 (USD million) 120 TABLE 173 India: POLYACRYLAMIDE Market, BY product type, 2026–2030 (USD million) 121 TABLE 174 India: POLYACRYLAMIDE Market, BY product type, 2019–2025 (kilo tons) 121 TABLE 175 India: POLYACRYLAMIDE Market, BY product type, 2026–2030 (kilo tons) 121 TABLE 176 India: POLYACRYLAMIDE Market, BY application, 2019–2025 (USD million) 122 TABLE 177 India: POLYACRYLAMIDE Market, BY application, 2026–2030 (USD million) 122 TABLE 178 India: POLYACRYLAMIDE Market, BY application, 2019–2025 (kilo tons) 122 TABLE 179 India: POLYACRYLAMIDE Market, BY application, 2026–2030 (kilo tons) 123 TABLE 180 South Korea: POLYACRYLAMIDE Market, BY product type, 2019–2025 (USD million) 123 TABLE 181 South Korea: POLYACRYLAMIDE Market, BY product type, 2026–2030 (USD million) 124 TABLE 182 South Korea: POLYACRYLAMIDE Market, BY product type, 2019–2025 (kilo tons) 124 TABLE 183 South Korea: POLYACRYLAMIDE Market, BY product type, 2026–2030 (kilo tons) 124 TABLE 184 South Korea: POLYACRYLAMIDE Market, BY application, 2019–2025 (USD million) 125 TABLE 185 South Korea: POLYACRYLAMIDE Market, BY application, 2026–2030 (USD million) 125 TABLE 186 South Korea: POLYACRYLAMIDE Market, BY application, 2019–2025 (kilo tons) 125 TABLE 187 South Korea: POLYACRYLAMIDE Market, BY application, 2026–2030 (kilo tons) 126 TABLE 188 Australia & New Zealand: POLYACRYLAMIDE Market, BY product type, 2019–2025 (USD million) 126 TABLE 189 Australia & New Zealand: POLYACRYLAMIDE Market, BY product type, 2026–2030 (USD million) 127 TABLE 190 Australia & New Zealand: POLYACRYLAMIDE Market, BY product type, 2019–2025 (kilo tons) 127 TABLE 191 Australia & New Zealand: POLYACRYLAMIDE Market, BY product type, 2026–2030 (kilo tons) 127 TABLE 192 Australia & New Zealand: POLYACRYLAMIDE Market, BY application, 2019–2025 (USD million) 128 TABLE 193 Australia & New Zealand: POLYACRYLAMIDE Market, BY application, 2026–2030 (USD million) 128 TABLE 194 Australia & New Zealand: POLYACRYLAMIDE Market, BY application, 2019–2025 (kilo tons) 128 TABLE 195 Australia & New Zealand: POLYACRYLAMIDE Market, BY application, 2026–2030 (kilo tons) 129 TABLE 196 Rest of Asia-Pacific: POLYACRYLAMIDE Market, BY product type, 2019–2025 (USD million) 129 TABLE 197 Rest of Asia-Pacific: POLYACRYLAMIDE Market, BY product type, 2026–2030 (USD million) 130 TABLE 198 Rest of Asia-Pacific: POLYACRYLAMIDE Market, BY product type, 2019–2025 (kilo tons) 130 TABLE 199 Rest of Asia-Pacific: POLYACRYLAMIDE Market, BY product type, 2026–2030 (kilo tons) 130 TABLE 200 Rest of Asia-Pacific: POLYACRYLAMIDE Market, BY application, 2019–2025 (USD million) 131 TABLE 201 Rest of Asia-Pacific: POLYACRYLAMIDE Market, BY application, 2026–2030 (USD million) 131 TABLE 202 Rest of Asia-Pacific: POLYACRYLAMIDE Market, BY application, 2019–2025 (kilo tons) 131 TABLE 203 Rest of Asia-Pacific: POLYACRYLAMIDE Market, BY application, 2026–2030 (kilo tons) 132 TABLE 204 Latin America: Market ESTIMATES & forecast, BY country, 2019–2025 (USD million) 133 TABLE 205 Latin America: Market ESTIMATES & forecast, BY country, 2026–2030 (USD million) 134 TABLE 206 Latin America: Market ESTIMATES & forecast, BY country, 2019–2025 (kilo tons) 134 TABLE 207 Latin America: Market ESTIMATES & forecast, BY country, 2026–2030 (kilo tons) 135 TABLE 208 Latin America: POLYACRYLAMIDE Market, BY product type, 2019–2025 (USD million) 135 TABLE 209 Latin America: POLYACRYLAMIDE Market, BY product type, 2026–2030 (USD million) 135 TABLE 210 Latin America: POLYACRYLAMIDE Market, BY product type, 2019–2025 (kilo tons) 136 TABLE 211 Latin America: POLYACRYLAMIDE Market, BY product type, 2026–2030 (kilo tons) 136 TABLE 212 Latin America: POLYACRYLAMIDE Market, BY application, 2019–2025 (USD million) 136 TABLE 213 Latin America: POLYACRYLAMIDE Market, BY application, 2026–2030 (USD million) 137 TABLE 214 Latin America: POLYACRYLAMIDE Market, BY application, 2019–2025 (kilo tons) 137 TABLE 215 Latin America: POLYACRYLAMIDE Market, BY application, 2026–2030 (kilo tons) 138 TABLE 216 Brazil: POLYACRYLAMIDE Market, BY product type, 2019–2025 (USD million) 138 TABLE 217 Brazil: POLYACRYLAMIDE Market, BY product type, 2026–2030 (USD million) 139 TABLE 218 Brazil: POLYACRYLAMIDE Market, BY product type, 2019–2025 (kilo tons) 139 TABLE 219 Brazil: POLYACRYLAMIDE Market, BY product type, 2026–2030 (kilo tons) 139 TABLE 220 Brazil: POLYACRYLAMIDE Market, BY application, 2019–2025 (USD million) 140 TABLE 221 Brazil: POLYACRYLAMIDE Market, BY application, 2026–2030 (USD million) 140 TABLE 222 Brazil: POLYACRYLAMIDE Market, BY application, 2019–2025 (kilo tons) 140 TABLE 223 Brazil: POLYACRYLAMIDE Market, BY application, 2026–2030 (kilo tons) 141 TABLE 224 Mexico: POLYACRYLAMIDE Market, BY product type, 2019–2025 (USD million) 141 TABLE 225 Mexico: POLYACRYLAMIDE Market, BY product type, 2026–2030 (USD million) 142 TABLE 226 Mexico: POLYACRYLAMIDE Market, BY product type, 2019–2025 (kilo tons) 142 TABLE 227 Mexico: POLYACRYLAMIDE Market, BY product type, 2026–2030 (kilo tons) 142 TABLE 228 Mexico: POLYACRYLAMIDE Market, BY application, 2019–2025 (USD million) 143 TABLE 229 Mexico: POLYACRYLAMIDE Market, BY application, 2026–2030 (USD million) 143 TABLE 230 Mexico: POLYACRYLAMIDE Market, BY application, 2019–2025 (kilo tons) 143 TABLE 231 Mexico: POLYACRYLAMIDE Market, BY application, 2026–2030 (kilo tons) 144 TABLE 232 Argentina: POLYACRYLAMIDE Market, BY product type, 2019–2025 (USD million) 144 TABLE 233 Argentina: POLYACRYLAMIDE Market, BY product type, 2026–2030 (USD million) 145 TABLE 234 Argentina: POLYACRYLAMIDE Market, BY product type, 2019–2025 (kilo tons) 145 TABLE 235 Argentina: POLYACRYLAMIDE Market, BY product type, 2026–2030 (kilo tons) 145 TABLE 236 Argentina: POLYACRYLAMIDE Market, BY application, 2019–2025 (USD million) 146 TABLE 237 Argentina: POLYACRYLAMIDE Market, BY application, 2026–2030 (USD million) 146 TABLE 238 Argentina: POLYACRYLAMIDE Market, BY application, 2019–2025 (kilo tons) 146 TABLE 239 Argentina: POLYACRYLAMIDE Market, BY application, 2026–2030 (kilo tons) 147 TABLE 240 Rest of Latin America: POLYACRYLAMIDE Market, BY product type, 2019–2025 (USD million) 147 TABLE 241 Rest of Latin America: POLYACRYLAMIDE Market, BY product type, 2026–2030 (USD million) 148 TABLE 242 Rest of Latin America: POLYACRYLAMIDE Market, BY product type, 2019–2025 (kilo tons) 148 TABLE 243 Rest of Latin America: POLYACRYLAMIDE Market, BY product type, 2026–2030 (kilo tons) 148 TABLE 244 Rest of Latin America: POLYACRYLAMIDE Market, BY application, 2019–2025 (USD million) 149 TABLE 245 Rest of Latin America: POLYACRYLAMIDE Market, BY application, 2026–2030 (USD million) 149 TABLE 246 Rest of Latin America: POLYACRYLAMIDE Market, BY application, 2019–2025 (kilo tons) 149 TABLE 247 Rest of Latin America: POLYACRYLAMIDE Market, BY application, 2026–2030 (kilo tons) 150 TABLE 248 Middle East & Africa: Market ESTIMATES & forecast, BY country, 2019–2025 (USD million) 151 TABLE 249 Middle East & Africa: Market ESTIMATES & forecast, BY country, 2026–2030 (USD million) 152 TABLE 250 Middle East & Africa: Market ESTIMATES & forecast, BY country, 2019–2025 (kilo tons) 152 TABLE 251 Middle East & Africa: Market ESTIMATES & forecast, BY country, 2026–2030 (kilo tons) 153 TABLE 252 Middle East & Africa: POLYACRYLAMIDE Market, BY product type, 2019–2025 (USD million) 153 TABLE 253 Middle East & Africa: POLYACRYLAMIDE Market, BY product type, 2026–2030 (USD million) 153 TABLE 254 Middle East & Africa: POLYACRYLAMIDE Market, BY product type, 2019–2025 (kilo tons) 154 TABLE 255 Middle East & Africa: POLYACRYLAMIDE Market, BY product type, 2026–2030 (kilo tons) 154 TABLE 256 Middle East & Africa: POLYACRYLAMIDE Market, BY application, 2019–2025 (USD million) 154 TABLE 257 Middle East & Africa: POLYACRYLAMIDE Market, BY application, 2026–2030 (USD million) 155 TABLE 258 Middle East & Africa: POLYACRYLAMIDE Market, BY application, 2019–2025 (kilo tons) 155 TABLE 259 Middle East & Africa: POLYACRYLAMIDE Market, BY application, 2026–2030 (kilo tons) 156 TABLE 260 Turkey: POLYACRYLAMIDE Market, BY product type, 2019–2025 (USD million) 156 TABLE 261 Turkey: POLYACRYLAMIDE Market, BY product type, 2026–2030 (USD million) 157 TABLE 262 Turkey: POLYACRYLAMIDE Market, BY product type, 2019–2025 (kilo tons) 157 TABLE 263 Turkey: POLYACRYLAMIDE Market, BY product type, 2026–2030 (kilo tons) 157 TABLE 264 Turkey: POLYACRYLAMIDE Market, BY application, 2019–2025 (USD million) 158 TABLE 265 Turkey: POLYACRYLAMIDE Market, BY application, 2026–2030 (USD million) 158 TABLE 266 Turkey: POLYACRYLAMIDE Market, BY application, 2019–2025 (kilo tons) 158 TABLE 267 Turkey: POLYACRYLAMIDE Market, BY application, 2026–2030 (kilo tons) 159 TABLE 268 South Africa: POLYACRYLAMIDE Market, BY product type, 2019–2025 (USD million) 159 TABLE 269 South Africa: POLYACRYLAMIDE Market, BY product type, 2026–2030 (USD million) 160 TABLE 270 South Africa: POLYACRYLAMIDE Market, BY product type, 2019–2025 (kilo tons) 160 TABLE 271 South Africa: POLYACRYLAMIDE Market, BY product type, 2026–2030 (kilo tons) 160 TABLE 272 South Africa: POLYACRYLAMIDE Market, BY application, 2019–2025 (USD million) 161 TABLE 273 South Africa: POLYACRYLAMIDE Market, BY application, 2026–2030 (USD million) 161 TABLE 274 South Africa: POLYACRYLAMIDE Market, BY application, 2019–2025 (kilo tons) 161 TABLE 275 South Africa: POLYACRYLAMIDE Market, BY application, 2026–2030 (kilo tons) 162 TABLE 276 GCC Countries: POLYACRYLAMIDE Market, BY product type, 2019–2025 (USD million) 162 TABLE 277 GCC Countries: POLYACRYLAMIDE Market, BY product type, 2026–2030 (USD million) 163 TABLE 278 GCC Countries: POLYACRYLAMIDE Market, BY product type, 2019–2025 (kilo tons) 163 TABLE 279 GCC Countries: POLYACRYLAMIDE Market, BY product type, 2026–2030 (kilo tons) 163 TABLE 280 GCC Countries: POLYACRYLAMIDE Market, BY application, 2019–2025 (USD million) 164 TABLE 281 GCC Countries: POLYACRYLAMIDE Market, BY application, 2026–2030 (USD million) 164 TABLE 282 GCC Countries: POLYACRYLAMIDE Market, BY application, 2019–2025 (kilo tons) 164 TABLE 283 GCC Countries: POLYACRYLAMIDE Market, BY application, 2026–2030 (kilo tons) 165 TABLE 284 Rest of the Middle East & Africa: POLYACRYLAMIDE Market, BY product type, 2019–2025 (USD million) 165 TABLE 285 Rest of the Middle East & Africa: POLYACRYLAMIDE Market, BY product type, 2026–2030 (USD million) 166 TABLE 286 Rest of the Middle East & Africa: POLYACRYLAMIDE Market, BY product type, 2019–2025 (kilo tons) 166 TABLE 287 Rest of the Middle East & Africa: POLYACRYLAMIDE Market, BY product type, 2026–2030 (kilo tons) 166 TABLE 288 Rest of the Middle East & Africa: POLYACRYLAMIDE Market, BY application, 2019–2025 (USD million) 167 TABLE 289 Rest of the Middle East & Africa: POLYACRYLAMIDE Market, BY application, 2026–2030 (USD million) 167 TABLE 290 Rest of the Middle East & Africa: POLYACRYLAMIDE Market, BY application, 2019–2025 (kilo tons) 168 TABLE 291 Rest of the Middle East & Africa: POLYACRYLAMIDE Market, BY application, 2026–2030 (kilo tons) 168 TABLE 292 expansions 170 TABLE 293 BASF SE: Products offered 172 TABLE 294 BASF SE: Key Developments 173 TABLE 295 SNF Group: Products Offered 175 TABLE 296 SNF GROUP: Key DEVELOPMENTS 176 TABLE 297 China National Petroleum Corporation (CNPC): Products Offered 179 TABLE 298 THE DOW CHEMICAL COMPANY: PRODUCTS Offered 183 TABLE 299 PetroChina Company Limited: PRODUCTS Offered 186 TABLE 300 BLACK ROSE INDUSTRIES LTD.: Products offered 189 TABLE 301 XITAO POLYMER CO., LTD.: Products offered 190 TABLE 302 KEMIRA OYJ: Products offered 192 TABLE 303 KEMIRA OYJ: Key DEVELOPMENTS 192 TABLE 304 ZL Petrochemicals Co., Ltd: Products offered 193 TABLE 305 ANHUI JUCHENG FINE CHEMICALS CO., LTD: Products offered 194 LIST OF FIGURES FIGURE 1 Market synopsis 19 FIGURE 2 Market Attractiveness Analysis: Global Polyacrylamide Market, 2021 20 FIGURE 3 Global Polyacrylamide Market analysis, by product Type, 2021 21 FIGURE 4 Global Polyacrylamide Market analysis, by application, 2021 22 FIGURE 5 Global Polyacrylamide Market analysis, by region, 2021 23 FIGURE 6 Global Polyacrylamide market: Structure 25 FIGURE 7 Key Buying Criteria for Polyacrylamide 25 FIGURE 8 Research Process 26 FIGURE 9 TOP-DOWN & BOTTOM-UP APPROACHES 29 FIGURE 10 MARKET dynamics overview 32 FIGURE 11 Drivers Impact Analysis: GLOBAL polyacrylamide market 34 FIGURE 12 Restraint Impact Analysis: GLOBAL polyacrylamide market 35 FIGURE 13 GLOBAL polyacrylamide market: SUPPLY CHAIN analysis 37 FIGURE 15 global polyacrylamide Market, BY product type, 2021 (% Share) 43 FIGURE 16 global polyacrylamide Market, BY product type, 2019–2030 (USD million) 43 FIGURE 17 global polyacrylamide Market, BY application, 2021 (% Share) 52 FIGURE 18 global polyacrylamide Market, BY application, 2019–2030 (USD million) 53 FIGURE 19 global POLYACRYLAMIDE MARKET, BY region, 2019–2030 (USD Million) 66 FIGURE 20 global POLYACRYLAMIDE MARKET, BY region, 2021 (% Share) 67 FIGURE 21 North America: POLYACRYLAMIDE MARKET share, BY country, 2021 (% share) 70 FIGURE 22 europe: POLYACRYLAMIDE MARKET share, BY country, 2021 (% share) 82 FIGURE 23 Asia-Pacific: POLYACRYLAMIDE MARKET share, BY country, 2021 (% share) 109 FIGURE 24 Latin America: POLYACRYLAMIDE MARKET share, BY country, 2021 (% share) 133 FIGURE 25 Middle East & Africa: POLYACRYLAMIDE MARKET share, BY country, 2021 (% share) 151 FIGURE 26 BASF SE: Financial Overview snapshot 172 FIGURE 27 BASF SE: SWOT Analysis 173 FIGURE 28 SNF GROUP: SWOT Analysis 176 FIGURE 29 China National Petroleum Corporation (CNPC): Financial Overview snapshot 178 FIGURE 30 China National Petroleum Corporation (CNPC): SWOT Analysis 179 FIGURE 31 THE DOW CHEMICAL COMPANY: Financial Overview snapshot 182 FIGURE 32 THE DOW CHEMICAL COMPANY: SWOT Analysis 183 FIGURE 33 PetroChina Company Limited: Financial Overview snapshot 186 FIGURE 34 PetroChina Company LIMITED: SWOT Analysis 187 FIGURE 35 Black Rose Industries Ltd.: Financial Overview snapshot 188 FIGURE 36 KEMIRA OYJ: Financial Overview snapshot 191
    32. NORTH AMERICA. 70
    33. US. 75
    34. Canada. 78
    35. europe. 82
    36. Germany. 87
    37. UK. 90
    38. france. 93
    39. russia. 96
    40. spain. 99
    41. italy. 102
    42. Rest of Europe. 105
    43. Asia-Pacific. 109
    44. china. 114
    45. Japan. 117
    46. India. 120
    47. South Korea. 123
    48. Australia & New Zealand. 126
    49. Rest of Asia-Pacific. 129
    50. Latin America. 133
    51. Brazil. 138
    52. Mexico. 141
    53. Argentina. 144
    54. Rest of Latin America. 147
    55. Middle East & Africa. 151
    56. Turkey. 156
    57. South Africa. 159
    58. GCC Countries. 162
    59. Rest of the Middle East & Africa. 165 9 Competitive Landscape.. 169
    60. Introduction. 169
    61. COMPETITIVE BENCHMARKING. 169
    62. Global MArket Strategies. 170
    63. KEY DEVELOPMENTS & GROWTH STRATEGIES. 170
    64. expansions. 170 10 Company Profiles.. 171
    65. BASF SE. 171
    66. COMPANY OVERVIEW.. 171
    67. FINANCIAL OVERVIEW.. 172
    68. PRODUCTS OFFERED. 172
    69. KEY DEVELOPMENTS. 173
    70. SWOT ANALYSIS. 173
    71. KEY STRATEGIES. 174
    72. SNF GROUP. 175
    73. COMPANY OVERVIEW.. 175
    74. FINANCIAL OVERVIEW.. 175
    75. PRODUCTS OFFERed. 175
    76. KEY DEVELOPMENTS. 176
    77. SWOT ANALYSIS. 176
    78. KEY STRATEGIES. 177
    79. China National Petroleum Corporation (CNPC) 178
    80. COMPANY OVERVIEW.. 178
    81. FINANCIAL OVERVIEW.. 178
    82. PRODUCTS OFFERed. 179
    83. KEY DEVELOPMENTS. 179
    84. SWOT ANALYSIS. 179
    85. KEY STRATEGIES. 180
    86. The Dow Chemical Company. 181
    87. COMPANY OVERVIEW.. 181
    88. FINANCIAL OVERVIEW.. 182
    89. PRODUCTS OFFERed. 183
    90. KEY DEVELOPMENTS. 183
    91. SWOT ANALYSIS. 183
    92. Key Strategies. 184
    93. PetroChina Company Limited. 185
    94. COMPANY OVERVIEW.. 185
    95. FINANCIAL OVERVIEW.. 186
    96. PRODUCTS OFFERed. 186
    97. KEY DEVELOPMENTS. 186
    98. SWOT ANALYSIS. 187
    99. Key Strategies. 187
    100. Black Rose Industries Ltd. 188
    101. COMPANY OVERVIEW.. 188
    102. FINANCIAL OVERVIEW.. 188
    103. PRODUCTS OFFERED. 189
    104. KEY DEVELOPMENTS. 189
    105. KEY STRATEGIES. 189
    106. Xitao Polymer Co., Ltd. 190
    107. COMPANY OVERVIEW.. 190
    108. FINANCIAL OVERVIEW.. 190
    109. PRODUCTS OFFERED. 190
    110. KEY DEVELOPMENTS. 190
    111. KEY STRATEGIES. 190
    112. kemira oyj. 191
    113. COMPANY OVERVIEW.. 191
    114. FINANCIAL OVERVIEW.. 191
    115. PRODUCTS OFFERED. 192
    116. KEY DEVELOPMENTS. 192
    117. KEY STRATEGIES. 192
    118. ZL Petrochemicals Co., Ltd. 193
    119. COMPANY OVERVIEW.. 193
    120. FINANCIAL OVERVIEW.. 193
    121. PRODUCTS OFFERED. 193
    122. KEY DEVELOPMENTS. 193
    123. KEY STRATEGIES. 193
    124. Anhui Jucheng Fine Chemicals Co., Ltd. 194
    125. COMPANY OVERVIEW.. 194
    126. FINANCIAL OVERVIEW.. 194
    127. PRODUCTS OFFERED. 194
    128. KEY DEVELOPMENTS. 195
    129. KEY STRATEGIES. 195 11 References.. 196 LIST OF TABLES TABLE 1 Primary Interviews 27 TABLE 2 List of assumptions & Limitations 31 TABLE 3 Pricing Overview of polyacrylamide, By region (USD/Ton) 42 TABLE 4 Global POLYACRYLAMIDE Market Estimates & Forecast, BY product type, 2019–2025 (USD million) 44 TABLE 5 Global POLYACRYLAMIDE Market Estimates & Forecast, BY product type, 2026–2030 (USD million) 44 TABLE 6 Global POLYACRYLAMIDE Market Estimates & Forecast, BY product type, 2019–2025 (Kilo Tons) 44 TABLE 7 Global POLYACRYLAMIDE Market Estimates & Forecast, BY product type, 2026–2030 (Kilo Tons) 45 TABLE 8 Anionic: MARKET ESTIMATES & forecast, BY REGION, 2019–2025 (USD million) 45 TABLE 9 Anionic: MARKET ESTIMATES & forecast, BY REGION, 2026–2030 (USD million) 46 TABLE 10 Anionic: MARKET ESTIMATES & forecast, BY REGION, 2019–2025 (Kilo Tons) 46 TABLE 11 Anionic: MARKET ESTIMATES & forecast, BY REGION, 2026–2030 (Kilo Tons) 47 TABLE 12 cationic: MARKET ESTIMATES & forecast, BY REGION, 2019–2025 (USD million) 47 TABLE 13 cationic: MARKET ESTIMATES & forecast, BY REGION, 2026–2030 (USD million) 48 TABLE 14 cationic: MARKET ESTIMATES & forecast, BY REGION, 2019–2025 (Kilo Tons) 48 TABLE 15 cationic: MARKET ESTIMATES & forecast, BY REGION, 2026–2030 (Kilo Tons) 49 TABLE 16 non-ionic: MARKET ESTIMATES & forecast, BY REGION, 2019–2025 (USD million) 49 TABLE 17 non-ionic: MARKET ESTIMATES & forecast, BY REGION, 2026–2030 (USD million) 50 TABLE 18 non-ionic: MARKET ESTIMATES & forecast, BY REGION, 2019–2025 (Kilo Tons) 50 TABLE 19 non-ionic: MARKET ESTIMATES & forecast, BY REGION, 2026–2030 (Kilo Tons) 51 TABLE 20 Global POLYACRYLAMIDE Market Estimates & Forecast, BY application, 2019–2025 (USD million) 53 TABLE 21 Global POLYACRYLAMIDE Market Estimates & Forecast, BY application, 2026–2030 (USD million) 54 TABLE 22 Global POLYACRYLAMIDE Market Estimates & Forecast, BY application, 2019–2025 (Kilo Tons) 54 TABLE 23 Global POLYACRYLAMIDE Market Estimates & Forecast, BY application, 2026–2030 (Kilo Tons) 55 TABLE 24 Water Treatment: MARKET ESTIMATES & forecast, BY REGION, 2019–2025 (USD million) 55 TABLE 25 Water Treatment: MARKET ESTIMATES & forecast, BY REGION, 2026–2030 (USD million) 56 TABLE 26 Water Treatment: MARKET ESTIMATES & forecast, BY REGION, 2019–2025 (Kilo Tons) 56 TABLE 27 Water Treatment: MARKET ESTIMATES & forecast, BY REGION, 2026–2030 (Kilo Tons) 57 TABLE 28 Pulp and Paper: MARKET ESTIMATES & forecast, BY REGION, 2019–2025 (USD million) 57 TABLE 29 Pulp and Paper: MARKET ESTIMATES & forecast, BY REGION, 2026–2030 (USD million) 58 TABLE 30 Pulp and Paper: MARKET ESTIMATES & forecast, BY REGION, 2019–2025 (Kilo Tons) 58 TABLE 31 Pulp and Paper: MARKET ESTIMATES & forecast, BY REGION, 2026–2030 (Kilo Tons) 59 TABLE 32 Mineral Processing: MARKET ESTIMATES & forecast, BY REGION, 2019–2025 (USD million) 59 TABLE 33 Mineral Processing: MARKET ESTIMATES & forecast, BY REGION, 2026–2030 (USD million) 60 TABLE 34 Mineral Processing: MARKET ESTIMATES & forecast, BY REGION, 2019–2025 (Kilo Tons) 60 TABLE 35 Mineral Processing: MARKET ESTIMATES & forecast, BY REGION, 2026–2030 (Kilo Tons) 61 TABLE 36 Enhanced Oil Recovery: MARKET ESTIMATES & forecast, BY REGION, 2019–2025 (USD million) 61 TABLE 37 Enhanced Oil Recovery: MARKET ESTIMATES & forecast, BY REGION, 2026–2030 (USD million) 62 TABLE 38 Enhanced Oil Recovery: MARKET ESTIMATES & forecast, BY REGION, 2019–2025 (Kilo Tons) 62 TABLE 39 Enhanced Oil Recovery: MARKET ESTIMATES & forecast, BY REGION, 2026–2030 (Kilo Tons) 63 TABLE 40 Others: MARKET ESTIMATES & forecast, BY REGION, 2019–2025 (USD million) 63 TABLE 41 Others: MARKET ESTIMATES & forecast, BY REGION, 2026–2030 (USD million) 64 TABLE 42 Others: MARKET ESTIMATES & forecast, BY REGION, 2019–2025 (Kilo Tons) 64 TABLE 43 Others: MARKET ESTIMATES & forecast, BY REGION, 2026–2030 (Kilo Tons) 65 TABLE 44 global POLYACRYLAMIDE MARKET ESTIMATES & forecast, BY REGION, 2019–2025 (USD million) 67 TABLE 45 global POLYACRYLAMIDE MARKET ESTIMATES & forecast, BY REGION, 2026–2030 (USD million) 68 TABLE 46 global POLYACRYLAMIDE MARKET ESTIMATES & forecast, BY REGION, 2019–2025 (kilo tons) 68 TABLE 47 global POLYACRYLAMIDE MARKET ESTIMATES & forecast, BY REGION, 2026–2030 (kilo tons) 69 TABLE 48 North america: Market ESTIMATES & forecast, BY country, 2019–2025 (USD million) 70 TABLE 49 North america: Market ESTIMATES & forecast, BY country, 2026–2030 (USD million) 71 TABLE 50 North america: Market ESTIMATES & forecast, BY country, 2019–2025 (kilo tons) 71 TABLE 51 North america: Market ESTIMATES & forecast, BY country, 2026–2030 (kilo tons) 71 TABLE 52 North America: POLYACRYLAMIDE Market, BY product type, 2019–2025 (USD million) 72 TABLE 53 North America: POLYACRYLAMIDE Market, BY product type, 2026–2030 (USD million) 72 TABLE 54 North America: POLYACRYLAMIDE Market, BY product type, 2019–2025 (kilo tons) 72 TABLE 55 North America: POLYACRYLAMIDE Market, BY product type, 2026–2030 (kilo tons) 73 TABLE 56 North America: POLYACRYLAMIDE Market, BY application, 2019–2025 (USD million) 73 TABLE 57 North America: POLYACRYLAMIDE Market, BY application, 2026–2030 (USD million) 74 TABLE 58 North America: POLYACRYLAMIDE Market, BY application, 2019–2025 (kilo tons) 74 TABLE 59 North America: POLYACRYLAMIDE Market, BY application, 2026–2030 (kilo tons) 75 TABLE 60 US: POLYACRYLAMIDE Market, BY product type, 2019–2025 (USD million) 75 TABLE 61 US: POLYACRYLAMIDE Market, BY product type, 2026–2030 (USD million) 76 TABLE 62 US: POLYACRYLAMIDE Market, BY product type, 2019–2025 (kilo tons) 76 TABLE 63 US: POLYACRYLAMIDE Market, BY product type, 2026–2030 (kilo tons) 76 TABLE 64 US: POLYACRYLAMIDE Market, BY application, 2019–2025 (USD million) 77 TABLE 65 US: POLYACRYLAMIDE Market, BY application, 2026–2030 (USD million) 77 TABLE 66 US: POLYACRYLAMIDE Market, BY application, 2019–2025 (kilo tons) 77 TABLE 67 US: POLYACRYLAMIDE Market, BY application, 2026–2030 (kilo tons) 78 TABLE 68 Canada: POLYACRYLAMIDE Market, BY product type, 2019–2025 (USD million) 78 TABLE 69 Canada: POLYACRYLAMIDE Market, BY product type, 2026–2030 (USD million) 79 TABLE 70 Canada: POLYACRYLAMIDE Market, BY product type, 2019–2025 (kilo tons) 79 TABLE 71 Canada: POLYACRYLAMIDE Market, BY product type, 2026–2030 (kilo tons) 79 TABLE 72 Canada: POLYACRYLAMIDE Market, BY application, 2019–2025 (USD million) 80 TABLE 73 Canada: POLYACRYLAMIDE Market, BY application, 2026–2030 (USD million) 80 TABLE 74 Canada: POLYACRYLAMIDE Market, BY application, 2019–2025 (kilo tons) 80 TABLE 75 Canada: POLYACRYLAMIDE Market, BY application, 2026–2030 (kilo tons) 81 TABLE 76 europe: Market ESTIMATES & forecast, BY country, 2019–2025 (USD million) 82 TABLE 77 europe: Market ESTIMATES & forecast, BY country, 2026–2030 (USD million) 83 TABLE 78 europe: Market ESTIMATES & forecast, BY country, 2019–2025 (kilo tons) 83 TABLE 79 europe: Market ESTIMATES & forecast, BY country, 2026–2030 (kilo tons) 84 TABLE 80 europe: POLYACRYLAMIDE Market, BY product type, 2019–2025 (USD million) 84 TABLE 81 europe: POLYACRYLAMIDE Market, BY product type, 2026–2030 (USD million) 85 TABLE 82 europe: POLYACRYLAMIDE Market, BY product type, 2019–2025 (kilo tons) 85 TABLE 83 europe: POLYACRYLAMIDE Market, BY product type, 2026–2030 (kilo tons) 85 TABLE 84 europe: POLYACRYLAMIDE Market, BY application, 2019–2025 (USD million) 86 TABLE 85 europe: POLYACRYLAMIDE Market, BY application, 2026–2030 (USD million) 86 TABLE 86 europe: POLYACRYLAMIDE Market, BY application, 2019–2025 (kilo tons) 86 TABLE 87 europe: POLYACRYLAMIDE Market, BY application, 2026–2030 (kilo tons) 87 TABLE 88 Germany: POLYACRYLAMIDE Market, BY product type, 2019–2025 (USD million) 87 TABLE 89 Germany: POLYACRYLAMIDE Market, BY product type, 2026–2030 (USD million) 88 TABLE 90 Germany: POLYACRYLAMIDE Market, BY product type, 2019–2025 (kilo tons) 88 TABLE 91 Germany: POLYACRYLAMIDE Market, BY product type, 2026–2030 (kilo tons) 88 TABLE 92 Germany: POLYACRYLAMIDE Market, BY application, 2019–2025 (USD million) 89 TABLE 93 Germany: POLYACRYLAMIDE Market, BY application, 2026–2030 (USD million) 89 TABLE 94 Germany: POLYACRYLAMIDE Market, BY application, 2019–2025 (kilo tons) 89 TABLE 95 Germany: POLYACRYLAMIDE Market, BY application, 2026–2030 (kilo tons) 90 TABLE 96 UK: POLYACRYLAMIDE Market, BY product type, 2019–2025 (USD million) 90 TABLE 97 UK: POLYACRYLAMIDE Market, BY product type, 2026–2030 (USD million) 91 TABLE 98 UK: POLYACRYLAMIDE Market, BY product type, 2019–2025 (kilo tons) 91 TABLE 99 UK: POLYACRYLAMIDE Market, BY product type, 2026–2030 (kilo tons) 91 TABLE 100 UK: POLYACRYLAMIDE Market, BY application, 2019–2025 (USD million) 92 TABLE 101 UK: POLYACRYLAMIDE Market, BY application, 2026–2030 (USD million) 92 TABLE 102 UK: POLYACRYLAMIDE Market, BY application, 2019–2025 (kilo tons) 92 TABLE 103 UK: POLYACRYLAMIDE Market, BY application, 2026–2030 (kilo tons) 93 TABLE 104 france: POLYACRYLAMIDE Market, BY product type, 2019–2025 (USD million) 93 TABLE 105 france: POLYACRYLAMIDE Market, BY product type, 2026–2030 (USD million) 94 TABLE 106 france: POLYACRYLAMIDE Market, BY product type, 2019–2025 (kilo tons) 94 TABLE 107 france: POLYACRYLAMIDE Market, BY product type, 2026–2030 (kilo tons) 94 TABLE 108 france: POLYACRYLAMIDE Market, BY application, 2019–2025 (USD million) 95 TABLE 109 france: POLYACRYLAMIDE Market, BY application, 2026–2030 (USD million) 95 TABLE 110 france: POLYACRYLAMIDE Market, BY application, 2019–2025 (kilo tons) 95 TABLE 111 france: POLYACRYLAMIDE Market, BY application, 2026–2030 (kilo tons) 96 TABLE 112 russia: POLYACRYLAMIDE Market, BY product type, 2019–2025 (USD million) 96 TABLE 113 russia: POLYACRYLAMIDE Market, BY product type, 2026–2030 (USD million) 97 TABLE 114 russia: POLYACRYLAMIDE Market, BY product type, 2019–2025 (kilo tons) 97 TABLE 115 russia: POLYACRYLAMIDE Market, BY product type, 2026–2030 (kilo tons) 97 TABLE 116 russia: POLYACRYLAMIDE Market, BY application, 2019–2025 (USD million) 98 TABLE 117 russia: POLYACRYLAMIDE Market, BY application, 2026–2030 (USD million) 98 TABLE 118 russia: POLYACRYLAMIDE Market, BY application, 2019–2025 (kilo tons) 98 TABLE 119 russia: POLYACRYLAMIDE Market, BY application, 2026–2030 (kilo tons) 99 TABLE 120 spain: POLYACRYLAMIDE Market, BY product type, 2019–2025 (USD million) 99 TABLE 121 spain: POLYACRYLAMIDE Market, BY product type, 2026–2030 (USD million) 100 TABLE 122 spain: POLYACRYLAMIDE Market, BY product type, 2019–2025 (kilo tons) 100 TABLE 123 spain: POLYACRYLAMIDE Market, BY product type, 2026–2030 (kilo tons) 100 TABLE 124 spain: POLYACRYLAMIDE Market, BY application, 2019–2025 (USD million) 101 TABLE 125 spain: POLYACRYLAMIDE Market, BY application, 2026–2030 (USD million) 101 TABLE 126 spain: POLYACRYLAMIDE Market, BY application, 2019–2025 (kilo tons) 101 TABLE 127 spain: POLYACRYLAMIDE Market, BY application, 2026–2030 (kilo tons) 102 TABLE 128 italy: POLYACRYLAMIDE Market, BY product type, 2019–2025 (USD million) 102 TABLE 129 italy: POLYACRYLAMIDE Market, BY product type, 2026–2030 (USD million) 103 TABLE 130 italy: POLYACRYLAMIDE Market, BY product type, 2019–2025 (kilo tons) 103 TABLE 131 italy: POLYACRYLAMIDE Market, BY product type, 2026–2030 (kilo tons) 103 TABLE 132 italy: POLYACRYLAMIDE Market, BY application, 2019–2025 (USD million) 104 TABLE 133 italy: POLYACRYLAMIDE Market, BY application, 2026–2030 (USD million) 104 TABLE 134 italy: POLYACRYLAMIDE Market, BY application, 2019–2025 (kilo tons) 104 TABLE 135 italy: POLYACRYLAMIDE Market, BY application, 2026–2030 (kilo tons) 105 TABLE 136 Rest of Europe: POLYACRYLAMIDE Market, BY product type, 2019–2025 (USD million) 105 TABLE 137 Rest of Europe: POLYACRYLAMIDE Market, BY product type, 2026–2030 (USD million) 106 TABLE 138 Rest of Europe: POLYACRYLAMIDE Market, BY product type, 2019–2025 (kilo tons) 106 TABLE 139 Rest of Europe: POLYACRYLAMIDE Market, BY product type, 2026–2030 (kilo tons) 106 TABLE 140 Rest of Europe: POLYACRYLAMIDE Market, BY application, 2019–2025 (USD million) 107 TABLE 141 Rest of Europe: POLYACRYLAMIDE Market, BY application, 2026–2030 (USD million) 107 TABLE 142 Rest of Europe: POLYACRYLAMIDE Market, BY application, 2019–2025 (kilo tons) 107 TABLE 143 Rest of Europe: POLYACRYLAMIDE Market, BY application, 2026–2030 (kilo tons) 108 TABLE 144 Asia-Pacific: Market ESTIMATES & forecast, BY country, 2019–2025 (USD million) 109 TABLE 145 Asia-Pacific: Market ESTIMATES & forecast, BY country, 2026–2030 (USD million) 110 TABLE 146 Asia-Pacific: Market ESTIMATES & forecast, BY country, 2019–2025 (kilo tons) 110 TABLE 147 Asia-Pacific: Market ESTIMATES & forecast, BY country, 2026–2030 (kilo tons) 111 TABLE 148 Asia-Pacific: POLYACRYLAMIDE Market, BY product type, 2019–2025 (USD million) 111 TABLE 149 Asia-Pacific: POLYACRYLAMIDE Market, BY product type, 2026–2030 (USD million) 112 TABLE 150 Asia-Pacific: POLYACRYLAMIDE Market, BY product type, 2019–2025 (kilo tons) 112 TABLE 151 Asia-Pacific: POLYACRYLAMIDE Market, BY product type, 2026–2030 (kilo tons) 112 TABLE 152 Asia-Pacific: POLYACRYLAMIDE Market, BY application, 2019–2025 (USD million) 113 TABLE 153 Asia-Pacific: POLYACRYLAMIDE Market, BY application, 2026–2030 (USD million) 113 TABLE 154 Asia-Pacific: POLYACRYLAMIDE Market, BY application, 2019–2025 (kilo tons) 113 TABLE 155 Asia-Pacific: POLYACRYLAMIDE Market, BY application, 2026–2030 (kilo tons) 114 TABLE 156 china: POLYACRYLAMIDE Market, BY product type, 2019–2025 (USD million) 114 TABLE 157 china: POLYACRYLAMIDE Market, BY product type, 2026–2030 (USD million) 115 TABLE 158 china: POLYACRYLAMIDE Market, BY product type, 2019–2025 (kilo tons) 115 TABLE 159 china: POLYACRYLAMIDE Market, BY product type, 2026–2030 (kilo tons) 115 TABLE 160 china: POLYACRYLAMIDE Market, BY application, 2019–2025 (USD million) 116 TABLE 161 china: POLYACRYLAMIDE Market, BY application, 2026–2030 (USD million) 116 TABLE 162 china: POLYACRYLAMIDE Market, BY application, 2019–2025 (kilo tons) 116 TABLE 163 china: POLYACRYLAMIDE Market, BY application, 2026–2030 (kilo tons) 117 TABLE 164 Japan: POLYACRYLAMIDE Market, BY product type, 2019–2025 (USD million) 117 TABLE 165 Japan: POLYACRYLAMIDE Market, BY product type, 2026–2030 (USD million) 118 TABLE 166 Japan: POLYACRYLAMIDE Market, BY product type, 2019–2025 (kilo tons) 118 TABLE 167 Japan: POLYACRYLAMIDE Market, BY product type, 2026–2030 (kilo tons) 118 TABLE 168 Japan: POLYACRYLAMIDE Market, BY application, 2019–2025 (USD million) 119 TABLE 169 Japan: POLYACRYLAMIDE Market, BY application, 2026–2030 (USD million) 119 TABLE 170 Japan: POLYACRYLAMIDE Market, BY application, 2019–2025 (kilo tons) 119 TABLE 171 Japan: POLYACRYLAMIDE Market, BY application, 2026–2030 (kilo tons) 120 TABLE 172 India: POLYACRYLAMIDE Market, BY product type, 2019–2025 (USD million) 120 TABLE 173 India: POLYACRYLAMIDE Market, BY product type, 2026–2030 (USD million) 121 TABLE 174 India: POLYACRYLAMIDE Market, BY product type, 2019–2025 (kilo tons) 121 TABLE 175 India: POLYACRYLAMIDE Market, BY product type, 2026–2030 (kilo tons) 121 TABLE 176 India: POLYACRYLAMIDE Market, BY application, 2019–2025 (USD million) 122 TABLE 177 India: POLYACRYLAMIDE Market, BY application, 2026–2030 (USD million) 122 TABLE 178 India: POLYACRYLAMIDE Market, BY application, 2019–2025 (kilo tons) 122 TABLE 179 India: POLYACRYLAMIDE Market, BY application, 2026–2030 (kilo tons) 123 TABLE 180 South Korea: POLYACRYLAMIDE Market, BY product type, 2019–2025 (USD million) 123 TABLE 181 South Korea: POLYACRYLAMIDE Market, BY product type, 2026–2030 (USD million) 124 TABLE 182 South Korea: POLYACRYLAMIDE Market, BY product type, 2019–2025 (kilo tons) 124 TABLE 183 South Korea: POLYACRYLAMIDE Market, BY product type, 2026–2030 (kilo tons) 124 TABLE 184 South Korea: POLYACRYLAMIDE Market, BY application, 2019–2025 (USD million) 125 TABLE 185 South Korea: POLYACRYLAMIDE Market, BY application, 2026–2030 (USD million) 125 TABLE 186 South Korea: POLYACRYLAMIDE Market, BY application, 2019–2025 (kilo tons) 125 TABLE 187 South Korea: POLYACRYLAMIDE Market, BY application, 2026–2030 (kilo tons) 126 TABLE 188 Australia & New Zealand: POLYACRYLAMIDE Market, BY product type, 2019–2025 (USD million) 126 TABLE 189 Australia & New Zealand: POLYACRYLAMIDE Market, BY product type, 2026–2030 (USD million) 127 TABLE 190 Australia & New Zealand: POLYACRYLAMIDE Market, BY product type, 2019–2025 (kilo tons) 127 TABLE 191 Australia & New Zealand: POLYACRYLAMIDE Market, BY product type, 2026–2030 (kilo tons) 127 TABLE 192 Australia & New Zealand: POLYACRYLAMIDE Market, BY application, 2019–2025 (USD million) 128 TABLE 193 Australia & New Zealand: POLYACRYLAMIDE Market, BY application, 2026–2030 (USD million) 128 TABLE 194 Australia & New Zealand: POLYACRYLAMIDE Market, BY application, 2019–2025 (kilo tons) 128 TABLE 195 Australia & New Zealand: POLYACRYLAMIDE Market, BY application, 2026–2030 (kilo tons) 129 TABLE 196 Rest of Asia-Pacific: POLYACRYLAMIDE Market, BY product type, 2019–2025 (USD million) 129 TABLE 197 Rest of Asia-Pacific: POLYACRYLAMIDE Market, BY product type, 2026–2030 (USD million) 130 TABLE 198 Rest of Asia-Pacific: POLYACRYLAMIDE Market, BY product type, 2019–2025 (kilo tons) 130 TABLE 199 Rest of Asia-Pacific: POLYACRYLAMIDE Market, BY product type, 2026–2030 (kilo tons) 130 TABLE 200 Rest of Asia-Pacific: POLYACRYLAMIDE Market, BY application, 2019–2025 (USD million) 131 TABLE 201 Rest of Asia-Pacific: POLYACRYLAMIDE Market, BY application, 2026–2030 (USD million) 131 TABLE 202 Rest of Asia-Pacific: POLYACRYLAMIDE Market, BY application, 2019–2025 (kilo tons) 131 TABLE 203 Rest of Asia-Pacific: POLYACRYLAMIDE Market, BY application, 2026–2030 (kilo tons) 132 TABLE 204 Latin America: Market ESTIMATES & forecast, BY country, 2019–2025 (USD million) 133 TABLE 205 Latin America: Market ESTIMATES & forecast, BY country, 2026–2030 (USD million) 134 TABLE 206 Latin America: Market ESTIMATES & forecast, BY country, 2019–2025 (kilo tons) 134 TABLE 207 Latin America: Market ESTIMATES & forecast, BY country, 2026–2030 (kilo tons) 135 TABLE 208 Latin America: POLYACRYLAMIDE Market, BY product type, 2019–2025 (USD million) 135 TABLE 209 Latin America: POLYACRYLAMIDE Market, BY product type, 2026–2030 (USD million) 135 TABLE 210 Latin America: POLYACRYLAMIDE Market, BY product type, 2019–2025 (kilo tons) 136 TABLE 211 Latin America: POLYACRYLAMIDE Market, BY product type, 2026–2030 (kilo tons) 136 TABLE 212 Latin America: POLYACRYLAMIDE Market, BY application, 2019–2025 (USD million) 136 TABLE 213 Latin America: POLYACRYLAMIDE Market, BY application, 2026–2030 (USD million) 137 TABLE 214 Latin America: POLYACRYLAMIDE Market, BY application, 2019–2025 (kilo tons) 137 TABLE 215 Latin America: POLYACRYLAMIDE Market, BY application, 2026–2030 (kilo tons) 138 TABLE 216 Brazil: POLYACRYLAMIDE Market, BY product type, 2019–2025 (USD million) 138 TABLE 217 Brazil: POLYACRYLAMIDE Market, BY product type, 2026–2030 (USD million) 139 TABLE 218 Brazil: POLYACRYLAMIDE Market, BY product type, 2019–2025 (kilo tons) 139 TABLE 219 Brazil: POLYACRYLAMIDE Market, BY product type, 2026–2030 (kilo tons) 139 TABLE 220 Brazil: POLYACRYLAMIDE Market, BY application, 2019–2025 (USD million) 140 TABLE 221 Brazil: POLYACRYLAMIDE Market, BY application, 2026–2030 (USD million) 140 TABLE 222 Brazil: POLYACRYLAMIDE Market, BY application, 2019–2025 (kilo tons) 140 TABLE 223 Brazil: POLYACRYLAMIDE Market, BY application, 2026–2030 (kilo tons) 141 TABLE 224 Mexico: POLYACRYLAMIDE Market, BY product type, 2019–2025 (USD million) 141 TABLE 225 Mexico: POLYACRYLAMIDE Market, BY product type, 2026–2030 (USD million) 142 TABLE 226 Mexico: POLYACRYLAMIDE Market, BY product type, 2019–2025 (kilo tons) 142 TABLE 227 Mexico: POLYACRYLAMIDE Market, BY product type, 2026–2030 (kilo tons) 142 TABLE 228 Mexico: POLYACRYLAMIDE Market, BY application, 2019–2025 (USD million) 143 TABLE 229 Mexico: POLYACRYLAMIDE Market, BY application, 2026–2030 (USD million) 143 TABLE 230 Mexico: POLYACRYLAMIDE Market, BY application, 2019–2025 (kilo tons) 143 TABLE 231 Mexico: POLYACRYLAMIDE Market, BY application, 2026–2030 (kilo tons) 144 TABLE 232 Argentina: POLYACRYLAMIDE Market, BY product type, 2019–2025 (USD million) 144 TABLE 233 Argentina: POLYACRYLAMIDE Market, BY product type, 2026–2030 (USD million) 145 TABLE 234 Argentina: POLYACRYLAMIDE Market, BY product type, 2019–2025 (kilo tons) 145 TABLE 235 Argentina: POLYACRYLAMIDE Market, BY product type, 2026–2030 (kilo tons) 145 TABLE 236 Argentina: POLYACRYLAMIDE Market, BY application, 2019–2025 (USD million) 146 TABLE 237 Argentina: POLYACRYLAMIDE Market, BY application, 2026–2030 (USD million) 146 TABLE 238 Argentina: POLYACRYLAMIDE Market, BY application, 2019–2025 (kilo tons) 146 TABLE 239 Argentina: POLYACRYLAMIDE Market, BY application, 2026–2030 (kilo tons) 147 TABLE 240 Rest of Latin America: POLYACRYLAMIDE Market, BY product type, 2019–2025 (USD million) 147 TABLE 241 Rest of Latin America: POLYACRYLAMIDE Market, BY product type, 2026–2030 (USD million) 148 TABLE 242 Rest of Latin America: POLYACRYLAMIDE Market, BY product type, 2019–2025 (kilo tons) 148 TABLE 243 Rest of Latin America: POLYACRYLAMIDE Market, BY product type, 2026–2030 (kilo tons) 148 TABLE 244 Rest of Latin America: POLYACRYLAMIDE Market, BY application, 2019–2025 (USD million) 149 TABLE 245 Rest of Latin America: POLYACRYLAMIDE Market, BY application, 2026–2030 (USD million) 149 TABLE 246 Rest of Latin America: POLYACRYLAMIDE Market, BY application, 2019–2025 (kilo tons) 149 TABLE 247 Rest of Latin America: POLYACRYLAMIDE Market, BY application, 2026–2030 (kilo tons) 150 TABLE 248 Middle East & Africa: Market ESTIMATES & forecast, BY country, 2019–2025 (USD million) 151 TABLE 249 Middle East & Africa: Market ESTIMATES & forecast, BY country, 2026–2030 (USD million) 152 TABLE 250 Middle East & Africa: Market ESTIMATES & forecast, BY country, 2019–2025 (kilo tons) 152 TABLE 251 Middle East & Africa: Market ESTIMATES & forecast, BY country, 2026–2030 (kilo tons) 153 TABLE 252 Middle East & Africa: POLYACRYLAMIDE Market, BY product type, 2019–2025 (USD million) 153 TABLE 253 Middle East & Africa: POLYACRYLAMIDE Market, BY product type, 2026–2030 (USD million) 153 TABLE 254 Middle East & Africa: POLYACRYLAMIDE Market, BY product type, 2019–2025 (kilo tons) 154 TABLE 255 Middle East & Africa: POLYACRYLAMIDE Market, BY product type, 2026–2030 (kilo tons) 154 TABLE 256 Middle East & Africa: POLYACRYLAMIDE Market, BY application, 2019–2025 (USD million) 154 TABLE 257 Middle East & Africa: POLYACRYLAMIDE Market, BY application, 2026–2030 (USD million) 155 TABLE 258 Middle East & Africa: POLYACRYLAMIDE Market, BY application, 2019–2025 (kilo tons) 155 TABLE 259 Middle East & Africa: POLYACRYLAMIDE Market, BY application, 2026–2030 (kilo tons) 156 TABLE 260 Turkey: POLYACRYLAMIDE Market, BY product type, 2019–2025 (USD million) 156 TABLE 261 Turkey: POLYACRYLAMIDE Market, BY product type, 2026–2030 (USD million) 157 TABLE 262 Turkey: POLYACRYLAMIDE Market, BY product type, 2019–2025 (kilo tons) 157 TABLE 263 Turkey: POLYACRYLAMIDE Market, BY product type, 2026–2030 (kilo tons) 157 TABLE 264 Turkey: POLYACRYLAMIDE Market, BY application, 2019–2025 (USD million) 158 TABLE 265 Turkey: POLYACRYLAMIDE Market, BY application, 2026–2030 (USD million) 158 TABLE 266 Turkey: POLYACRYLAMIDE Market, BY application, 2019–2025 (kilo tons) 158 TABLE 267 Turkey: POLYACRYLAMIDE Market, BY application, 2026–2030 (kilo tons) 159 TABLE 268 South Africa: POLYACRYLAMIDE Market, BY product type, 2019–2025 (USD million) 159 TABLE 269 South Africa: POLYACRYLAMIDE Market, BY product type, 2026–2030 (USD million) 160 TABLE 270 South Africa: POLYACRYLAMIDE Market, BY product type, 2019–2025 (kilo tons) 160 TABLE 271 South Africa: POLYACRYLAMIDE Market, BY product type, 2026–2030 (kilo tons) 160 TABLE 272 South Africa: POLYACRYLAMIDE Market, BY application, 2019–2025 (USD million) 161 TABLE 273 South Africa: POLYACRYLAMIDE Market, BY application, 2026–2030 (USD million) 161 TABLE 274 South Africa: POLYACRYLAMIDE Market, BY application, 2019–2025 (kilo tons) 161 TABLE 275 South Africa: POLYACRYLAMIDE Market, BY application, 2026–2030 (kilo tons) 162 TABLE 276 GCC Countries: POLYACRYLAMIDE Market, BY product type, 2019–2025 (USD million) 162 TABLE 277 GCC Countries: POLYACRYLAMIDE Market, BY product type, 2026–2030 (USD million) 163 TABLE 278 GCC Countries: POLYACRYLAMIDE Market, BY product type, 2019–2025 (kilo tons) 163 TABLE 279 GCC Countries: POLYACRYLAMIDE Market, BY product type, 2026–2030 (kilo tons) 163 TABLE 280 GCC Countries: POLYACRYLAMIDE Market, BY application, 2019–2025 (USD million) 164 TABLE 281 GCC Countries: POLYACRYLAMIDE Market, BY application, 2026–2030 (USD million) 164 TABLE 282 GCC Countries: POLYACRYLAMIDE Market, BY application, 2019–2025 (kilo tons) 164 TABLE 283 GCC Countries: POLYACRYLAMIDE Market, BY application, 2026–2030 (kilo tons) 165 TABLE 284 Rest of the Middle East & Africa: POLYACRYLAMIDE Market, BY product type, 2019–2025 (USD million) 165 TABLE 285 Rest of the Middle East & Africa: POLYACRYLAMIDE Market, BY product type, 2026–2030 (USD million) 166 TABLE 286 Rest of the Middle East & Africa: POLYACRYLAMIDE Market, BY product type, 2019–2025 (kilo tons) 166 TABLE 287 Rest of the Middle East & Africa: POLYACRYLAMIDE Market, BY product type, 2026–2030 (kilo tons) 166 TABLE 288 Rest of the Middle East & Africa: POLYACRYLAMIDE Market, BY application, 2019–2025 (USD million) 167 TABLE 289 Rest of the Middle East & Africa: POLYACRYLAMIDE Market, BY application, 2026–2030 (USD million) 167 TABLE 290 Rest of the Middle East & Africa: POLYACRYLAMIDE Market, BY application, 2019–2025 (kilo tons) 168 TABLE 291 Rest of the Middle East & Africa: POLYACRYLAMIDE Market, BY application, 2026–2030 (kilo tons) 168 TABLE 292 expansions 170 TABLE 293 BASF SE: Products offered 172 TABLE 294 BASF SE: Key Developments 173 TABLE 295 SNF Group: Products Offered 175 TABLE 296 SNF GROUP: Key DEVELOPMENTS 176 TABLE 297 China National Petroleum Corporation (CNPC): Products Offered 179 TABLE 298 THE DOW CHEMICAL COMPANY: PRODUCTS Offered 183 TABLE 299 PetroChina Company Limited: PRODUCTS Offered 186 TABLE 300 BLACK ROSE INDUSTRIES LTD.: Products offered 189 TABLE 301 XITAO POLYMER CO., LTD.: Products offered 190 TABLE 302 KEMIRA OYJ: Products offered 192 TABLE 303 KEMIRA OYJ: Key DEVELOPMENTS 192 TABLE 304 ZL Petrochemicals Co., Ltd: Products offered 193 TABLE 305 ANHUI JUCHENG FINE CHEMICALS CO., LTD: Products offered 194 LIST OF FIGURES FIGURE 1 Market synopsis 19 FIGURE 2 Market Attractiveness Analysis: Global Polyacrylamide Market, 2021 20 FIGURE 3 Global Polyacrylamide Market analysis, by product Type, 2021 21 FIGURE 4 Global Polyacrylamide Market analysis, by application, 2021 22 FIGURE 5 Global Polyacrylamide Market analysis, by region, 2021 23 FIGURE 6 Global Polyacrylamide market: Structure 25 FIGURE 7 Key Buying Criteria for Polyacrylamide 25 FIGURE 8 Research Process 26 FIGURE 9 TOP-DOWN & BOTTOM-UP APPROACHES 29 FIGURE 10 MARKET dynamics overview 32 FIGURE 11 Drivers Impact Analysis: GLOBAL polyacrylamide market 34 FIGURE 12 Restraint Impact Analysis: GLOBAL polyacrylamide market 35 FIGURE 13 GLOBAL polyacrylamide market: SUPPLY CHAIN analysis 37 FIGURE 15 global polyacrylamide Market, BY product type, 2021 (% Share) 43 FIGURE 16 global polyacrylamide Market, BY product type, 2019–2030 (USD million) 43 FIGURE 17 global polyacrylamide Market, BY application, 2021 (% Share) 52 FIGURE 18 global polyacrylamide Market, BY application, 2019–2030 (USD million) 53 FIGURE 19 global POLYACRYLAMIDE MARKET, BY region, 2019–2030 (USD Million) 66 FIGURE 20 global POLYACRYLAMIDE MARKET, BY region, 2021 (% Share) 67 FIGURE 21 North America: POLYACRYLAMIDE MARKET share, BY country, 2021 (% share) 70 FIGURE 22 europe: POLYACRYLAMIDE MARKET share, BY country, 2021 (% share) 82 FIGURE 23 Asia-Pacific: POLYACRYLAMIDE MARKET share, BY country, 2021 (% share) 109 FIGURE 24 Latin America: POLYACRYLAMIDE MARKET share, BY country, 2021 (% share) 133 FIGURE 25 Middle East & Africa: POLYACRYLAMIDE MARKET share, BY country, 2021 (% share) 151 FIGURE 26 BASF SE: Financial Overview snapshot 172 FIGURE 27 BASF SE: SWOT Analysis 173 FIGURE 28 SNF GROUP: SWOT Analysis 176 FIGURE 29 China National Petroleum Corporation (CNPC): Financial Overview snapshot 178 FIGURE 30 China National Petroleum Corporation (CNPC): SWOT Analysis 179 FIGURE 31 THE DOW CHEMICAL COMPANY: Financial Overview snapshot 182 FIGURE 32 THE DOW CHEMICAL COMPANY: SWOT Analysis 183 FIGURE 33 PetroChina Company Limited: Financial Overview snapshot 186 FIGURE 34 PetroChina Company LIMITED: SWOT Analysis 187 FIGURE 35 Black Rose Industries Ltd.: Financial Overview snapshot 188 FIGURE 36 KEMIRA OYJ: Financial Overview snapshot 191
    130. List of Tables and Figures
      1. Table FIGURE 1 Market synopsis 19 FIGURE 2 Market Attractiveness Analysis: Global Polyacrylamide Market, 2021 20 FIGURE 3 Global Polyacrylamide Market analysis, by product Type, 2021 21 FIGURE 4 Global Polyacrylamide Market analysis, by application, 2021 22 FIGURE 5 Global Polyacrylamide Market analysis, by region, 2021 23 FIGURE 6 Global Polyacrylamide market: Structure 25 FIGURE 7 Key Buying Criteria for Polyacrylamide 25 FIGURE 8 Research Process 26 FIGURE 9 TOP-DOWN & BOTTOM-UP APPROACHES 29 FIGURE 10 MARKET dynamics overview 32 FIGURE 11 Drivers Impact Analysis: GLOBAL polyacrylamide market 34 FIGURE 12 Restraint Impact Analysis: GLOBAL polyacrylamide market 35 FIGURE 13 GLOBAL polyacrylamide market: SUPPLY CHAIN analysis 37 FIGURE 15 global polyacrylamide Market, BY product type, 2021 (% Share) 43 FIGURE 16 global polyacrylamide Market, BY product type, 2019–2030 (USD million) 43 FIGURE 17 global polyacrylamide Market, BY application, 2021 (% Share) 52 FIGURE 18 global polyacrylamide Market, BY application, 2019–2030 (USD million) 53 FIGURE 19 global POLYACRYLAMIDE MARKET, BY region, 2019–2030 (USD Million) 66 FIGURE 20 global POLYACRYLAMIDE MARKET, BY region, 2021 (% Share) 67 FIGURE 21 North America: POLYACRYLAMIDE MARKET share, BY country, 2021 (% share) 70 FIGURE 22 europe: POLYACRYLAMIDE MARKET share, BY country, 2021 (% share) 82 FIGURE 23 Asia-Pacific: POLYACRYLAMIDE MARKET share, BY country, 2021 (% share) 109 FIGURE 24 Latin America: POLYACRYLAMIDE MARKET share, BY country, 2021 (% share) 133 FIGURE 25 Middle East & Africa: POLYACRYLAMIDE MARKET share, BY country, 2021 (% share) 151 FIGURE 26 BASF SE: Financial Overview snapshot 172 FIGURE 27 BASF SE: SWOT Analysis 173 FIGURE 28 SNF GROUP: SWOT Analysis 176 FIGURE 29 China National Petroleum Corporation (CNPC): Financial Overview snapshot 178 FIGURE 30 China National Petroleum Corporation (CNPC): SWOT Analysis 179 FIGURE 31 THE DOW CHEMICAL COMPANY: Financial Overview snapshot 182 FIGURE 32 THE DOW CHEMICAL COMPANY: SWOT Analysis 183 FIGURE 33 PetroChina Company Limited: Financial Overview snapshot 186 FIGURE 34 PetroChina Company LIMITED: SWOT Analysis 187 FIGURE 35 Black Rose Industries Ltd.: Financial Overview snapshot 188 FIGURE 36 KEMIRA OYJ: Financial Overview snapshot 191
    131. Table FIGURE 1 Market synopsis 19 FIGURE 2 Market Attractiveness Analysis: Global Polyacrylamide Market, 2021 20 FIGURE 3 Global Polyacrylamide Market analysis, by product Type, 2021 21 FIGURE 4 Global Polyacrylamide Market analysis, by application, 2021 22 FIGURE 5 Global Polyacrylamide Market analysis, by region, 2021 23 FIGURE 6 Global Polyacrylamide market: Structure 25 FIGURE 7 Key Buying Criteria for Polyacrylamide 25 FIGURE 8 Research Process 26 FIGURE 9 TOP-DOWN & BOTTOM-UP APPROACHES 29 FIGURE 10 MARKET dynamics overview 32 FIGURE 11 Drivers Impact Analysis: GLOBAL polyacrylamide market 34 FIGURE 12 Restraint Impact Analysis: GLOBAL polyacrylamide market 35 FIGURE 13 GLOBAL polyacrylamide market: SUPPLY CHAIN analysis 37 FIGURE 15 global polyacrylamide Market, BY product type, 2021 (% Share) 43 FIGURE 16 global polyacrylamide Market, BY product type, 2019–2030 (USD million) 43 FIGURE 17 global polyacrylamide Market, BY application, 2021 (% Share) 52 FIGURE 18 global polyacrylamide Market, BY application, 2019–2030 (USD million) 53 FIGURE 19 global POLYACRYLAMIDE MARKET, BY region, 2019–2030 (USD Million) 66 FIGURE 20 global POLYACRYLAMIDE MARKET, BY region, 2021 (% Share) 67 FIGURE 21 North America: POLYACRYLAMIDE MARKET share, BY country, 2021 (% share) 70 FIGURE 22 europe: POLYACRYLAMIDE MARKET share, BY country, 2021 (% share) 82 FIGURE 23 Asia-Pacific: POLYACRYLAMIDE MARKET share, BY country, 2021 (% share) 109 FIGURE 24 Latin America: POLYACRYLAMIDE MARKET share, BY country, 2021 (% share) 133 FIGURE 25 Middle East & Africa: POLYACRYLAMIDE MARKET share, BY country, 2021 (% share) 151 FIGURE 26 BASF SE: Financial Overview snapshot 172 FIGURE 27 BASF SE: SWOT Analysis 173 FIGURE 28 SNF GROUP: SWOT Analysis 176 FIGURE 29 China National Petroleum Corporation (CNPC): Financial Overview snapshot 178 FIGURE 30 China National Petroleum Corporation (CNPC): SWOT Analysis 179 FIGURE 31 THE DOW CHEMICAL COMPANY: Financial Overview snapshot 182 FIGURE 32 THE DOW CHEMICAL COMPANY: SWOT Analysis 183 FIGURE 33 PetroChina Company Limited: Financial Overview snapshot 186 FIGURE 34 PetroChina Company LIMITED: SWOT Analysis 187 FIGURE 35 Black Rose Industries Ltd.: Financial Overview snapshot 188 FIGURE 36 KEMIRA OYJ: Financial Overview snapshot 191


    Polyacrylamide Market Segmentation

    Polyacrylamide Product Type Outlook (USD Billion, 2019-2030)

    Anionic

    Cationic

    Non-Ionic

    Polyacrylamide Application Outlook (USD Billion, 2019-2030)

    Water Treatment

    Pulp and Paper

    Mineral Processing

    Enhanced Oil Recovery

    Others

    Polyacrylamide Regional Outlook (USD Billion, 2019-2030)

    North America Outlook (USD Billion, 2019-2030)

    North America Polyacrylamide by Product Type

    Anionic

    Cationic

    Non-Ionic

    North America Polyacrylamide by Application

    Water Treatment

    Pulp and Paper

    Mineral Processing

    Enhanced Oil Recovery

    Others

    US Outlook (USD Billion, 2019-2030)

    US Polyacrylamide by Product Type

    Anionic

    Cationic

    Non-Ionic

    US America Polyacrylamide by Application

    Water Treatment

    Pulp and Paper

    Mineral Processing

    Enhanced Oil Recovery

    Others

    Canada Outlook (USD Billion, 2019-2030)

    Canada Polyacrylamide by Product Type

    Anionic

    Cationic

    Non-Ionic

    Canada Polyacrylamide by Application

    Water Treatment

    Pulp and Paper

    Mineral Processing

    Enhanced Oil Recovery

    Others

    Europe Outlook (USD Billion, 2019-2030)

    Europe Polyacrylamide by Product Type

    Anionic

    Cationic

    Non-Ionic

    Europe Polyacrylamide by Application

    Water Treatment

    Pulp and Paper

    Mineral Processing

    Enhanced Oil Recovery

    Others

    Germany Outlook (USD Billion, 2019-2030)

    Germany Polyacrylamide by Product Type

    Anionic

    Cationic

    Non-Ionic

    Germany Polyacrylamide by Application

    Water Treatment

    Pulp and Paper

    Mineral Processing

    Enhanced Oil Recovery

    Others

    Russia Outlook (USD Billion, 2019-2030)

    Russia Polyacrylamide by Product Type

    Anionic

    Cationic

    Non-Ionic

    Germany Polyacrylamide by Application

    Water Treatment

    Pulp and Paper

    Mineral Processing

    Enhanced Oil Recovery

    Others

    France Outlook (USD Billion, 2019-2030)

    France Polyacrylamide by Product Type

    Anionic

    Cationic

    Non-Ionic

    Germany Polyacrylamide by Application

    Water Treatment

    Pulp and Paper

    Mineral Processing

    Enhanced Oil Recovery

    Others

    UK Outlook (USD Billion, 2019-2030)

    UK Polyacrylamide by Product Type

    Anionic

    Cationic

    Non-Ionic

    UK Polyacrylamide by Application

    Water Treatment

    Pulp and Paper

    Mineral Processing

    Enhanced Oil Recovery

    Others

    Italy Outlook (USD Billion, 2019-2030)

    Italy Polyacrylamide by Product Type

    Anionic

    Cationic

    Non-Ionic

    Italy Polyacrylamide by Application

    Water Treatment

    Pulp and Paper

    Mineral Processing

    Enhanced Oil Recovery

    Others

    Spain Outlook (USD Billion, 2019-2030)

    Spain Polyacrylamide by Product Type

    Anionic

    Cationic

    Non-Ionic

    Spain Polyacrylamide by Application

    Water Treatment

    Pulp and Paper

    Mineral Processing

    Enhanced Oil Recovery

    Others

    Rest Of Europe Outlook (USD Billion, 2019-2030)

    Rest Of Europe Polyacrylamide by Product Type

    Anionic

    Cationic

    Non-Ionic

    Rest of Europe Polyacrylamide by Application

    Water Treatment

    Pulp and Paper

    Mineral Processing

    Enhanced Oil Recovery

    Others

    Asia-Pacific Outlook (USD Billion, 2019-2030)

    Asia-Pacific Polyacrylamide by Product Type

    Anionic

    Cationic

    Non-Ionic

    Asia-Pacific Polyacrylamide by Application

    Water Treatment

    Pulp and Paper

    Mineral Processing

    Enhanced Oil Recovery

    Others

    China Outlook (USD Billion, 2019-2030)

    China Polyacrylamide by Product Type

    Anionic

    Cationic

    Non-Ionic

    China Polyacrylamide by Application

    Water Treatment

    Pulp and Paper

    Mineral Processing

    Enhanced Oil Recovery

    Others

    Japan Outlook (USD Billion, 2019-2030)

    Japan Polyacrylamide by Product Type

    Anionic

    Cationic

    Non-Ionic

    Japan Polyacrylamide by Application

    Water Treatment

    Pulp and Paper

    Mineral Processing

    Enhanced Oil Recovery

    Others

    India Outlook (USD Billion, 2019-2030)

    India Polyacrylamide by Product Type

    Anionic

    Cationic

    Non-Ionic

    India Polyacrylamide by Application

    Water Treatment

    Pulp and Paper

    Mineral Processing

    Others

    South Korea Outlook (USD Billion, 2019-2030)

    South Korea Polyacrylamide by Product Type

    Anionic

    Cationic

    Non-Ionic

    South Korea Polyacrylamide by Application

    Water Treatment

    Pulp and Paper

    Mineral Processing

    Enhanced Oil Recovery

    Others

    Rest of Asia-Pacific Outlook (USD Billion, 2019-2030)

    Rest of Asia-Pacific Polyacrylamide by Product Type

    Anionic

    Cationic

    Non-Ionic

    Rest of Asia-Pacific Polyacrylamide by Application

    Water Treatment

    Pulp and Paper

    Mineral Processing

    Enhanced Oil Recovery

    Others

    Middle East & Africa Outlook (USD Billion, 2019-2030)

    Middle East & Africa Polyacrylamide by Product Type

    Anionic

    Cationic

    Non-Ionic

    Middle East & Africa Polyacrylamide by Application

    Water Treatment

    Pulp and Paper

    Mineral Processing

    Enhanced Oil Recovery

    Others

    South Africa Outlook (USD Billion, 2019-2030)

    South Africa Polyacrylamide by Product Type

    Anionic

    Cationic

    Non-Ionic

    South Africa Polyacrylamide by Application

    Water Treatment

    Pulp and Paper

    Mineral Processing

    Enhanced Oil Recovery

    Others

    GCC Countries Outlook (USD Billion, 2019-2030)

    GCC Countries Polyacrylamide by Product Type

    Anionic

    Cationic

    Non-Ionic

    GCC countries Polyacrylamide by Application

    Water Treatment

    Pulp and Paper

    Mineral Processing

    Enhanced Oil Recovery

    Others

    Latin America Outlook (USD Billion, 2019-2030)

    Latin America Polyacrylamide by Product Type

    Anionic

    Cationic

    Non-Ionic

    Latin America Polyacrylamide by Application

    Water Treatment

    Pulp and Paper

    Mineral Processing

    Enhanced Oil Recovery

    Others

    Brazil Outlook (USD Billion, 2019-2030)

    Brazil Polyacrylamide by Product Type

    Anionic

    Cationic

    Non-Ionic

    Brazil Polyacrylamide by Application

    Water Treatment

    Pulp and Paper

    Mineral Processing

    Enhanced Oil Recovery

    Others

    Mexico Outlook (USD Billion, 2019-2030)

    Mexico Polyacrylamide by Product Type

    Anionic

    Cationic

    Non-Ionic

    Mexico Polyacrylamide by Application

    Water Treatment

    Pulp and Paper

    Mineral Processing

    Enhanced Oil Recovery

    Others

    Argentina Outlook (USD Billion, 2019-2030)

    Argentina Polyacrylamide by Product Type

    Anionic

    Cationic

    Non-Ionic

    Argentina Polyacrylamide by Application

    Water Treatment

    Pulp and Paper

    Mineral Processing

    Enhanced Oil Recovery

    Others

    Rest of Latin America (USD Billion, 2019-2030)

    Rest of Latin America Polyacrylamide by Product Type

    Anionic

    Cationic

    Non-Ionic

    Rest of Latin America Polyacrylamide by Application

    Water Treatment

    Pulp and Paper

    Mineral Processing

    Enhanced Oil Recovery

    Others

    Infographic

    Free Sample Request

    Kindly complete the form below to receive a free sample of this Report

    Get Free Sample

    Customer Strories

    “I am very pleased with how market segments have been defined in a relevant way for my purposes (such as "Portable Freezers & refrigerators" and "last-mile"). In general the report is well structured. Thanks very much for your efforts.”

    Victoria Milne

    Founder
    Case Study
    Chemicals and Materials