• Cat-intel
  • MedIntelliX
  • Resources
  • About Us
  • Hero Background
    English
    Chinese
    French
    Japanese
    Korean
    German
    Spanish

    Organic Drinks Market Analysis

    ID: MRFR/F-B & N/1974-HCR
    90 Pages
    Pradeep Nandi
    October 2025

    Organic Drinks Market Research Report Information By Type [Alcoholic and Non-Alcoholic), By Distribution Channel (Store-Based and Non-Store-Based), By Packaging Type (Bottles, Cans and Others), And By Region (North America, Europe, Asia-Pacific, And Rest Of The World) –Market Forecast Till 2035

    Share:
    Download PDF ×

    We do not share your information with anyone. However, we may send you emails based on your report interest from time to time. You may contact us at any time to opt-out.

    Organic Drinks Market Infographic
    Purchase Options

    Market Analysis

    In-depth Analysis of Organic Drinks Market Industry Landscape

    The market dynamics of the organic drinks segment are influenced by a variety of factors that collectively shape the industry's growth and evolution. One primary driver is the increasing consumer demand for healthier beverage options. As awareness of the potential health benefits associated with organic products grows, consumers are seeking organic drinks as a preferable alternative to conventional sugary and artificial beverages. The emphasis on natural ingredients, absence of synthetic additives, and overall nutritional value positions organic drinks as a choice aligned with health and wellness trends.

    Regulatory factors play a crucial role in shaping the dynamics of the organic drinks market. Governments and certification bodies, such as the USDA Organic and various organic certification agencies, have established stringent standards to ensure the authenticity and quality of organic products. Adherence to these standards not only instills consumer confidence but also serves as a key market differentiator. The presence of recognized certification labels on organic drinks assures consumers of the product's organic status, influencing purchasing decisions and shaping market dynamics. Significant research and development initiatives undertaken by major automakers to enhance the shelf life, smoothness, taste, and nutritional content of their products are expected to positively impact market growth. These efforts reflect a commitment to advancing product quality and consumer satisfaction in the automotive industry.

    The investment in research and development by leading automakers underscores their dedication to addressing key aspects of their goods, aiming to prolong shelf life and improve sensory attributes. This strategic focus on innovation extends beyond mere functionality, emphasizing the enhancement of taste and nutritional value in their offerings.

    By prioritizing advancements in product attributes, automakers are positioned to meet evolving consumer expectations and preferences. The anticipated favorable influence on market growth signifies the importance of continuous improvement and innovation in the automotive sector. As these companies strive to deliver products that not only meet but exceed consumer demands, the ongoing research and development endeavors play a crucial role in shaping the future landscape of the automotive market. Economic factors, particularly the disposable income of consumers, impact the growth of the organic drinks market. As disposable incomes rise, consumers are more willing to invest in premium and healthier beverage options. While organic drinks often come with a premium price tag, the perceived health benefits and premium quality ingredients justify the expense for many consumers. However, market dynamics also involve the need for brands to balance premium quality with competitive pricing to appeal to a wider consumer base and capture market share.

    Technological advancements in food and beverage production contribute to the market dynamics of organic drinks. Innovations in processing techniques, sustainable packaging, and distribution channels enhance the efficiency and sustainability of organic drink production. Additionally, advancements in organic farming practices and agricultural technologies impact the availability and cost of organic ingredients, influencing market dynamics.

    Consumer preferences and evolving trends significantly shape the product offerings within the organic drinks market. Brands respond to the demand for diverse flavors, functional beverages, and unique formulations that cater to specific health and lifestyle needs. The market is witnessing an expansion beyond traditional categories like organic juices to include organic teas, plant-based milk alternatives, and innovative health-focused beverages. Companies that can adapt to changing consumer preferences are better positioned to thrive in the dynamic organic drinks market.

    Sustainability considerations are increasingly influencing the market dynamics of organic drinks. Consumers are not only seeking healthier beverage options but also expressing a preference for brands that prioritize sustainability and ethical practices. Companies that emphasize environmentally conscious sourcing, ethical production methods, and eco-friendly packaging can gain a competitive edge in the market. Sustainability is becoming a key factor in consumer purchasing decisions, influencing the overall market dynamics of the organic drinks segment.

    Global trends, such as the rise of plant-based diets and the focus on clean labels, intersect with the organic drinks market. Plant-based organic beverages, free from artificial additives and preservatives, align with the preferences of consumers seeking natural and ethical choices. The intersection of these trends contributes to the market dynamics, driving the demand for organic drinks and shaping the industry's trajectory.

    Author
    Pradeep Nandi
    Senior Research Analyst

    I have a bachelor's degree in mechanical engineering and an MBA. I have more than two years of expertise in the retail, food, and beverage, chemical, and material industries, and hence have developed a sound cross-domain expertise. A firm believer in lifelong learning and sharing of knowledge. Having a proclivity for hatching ideas and trying to absorb as much information as possible in a short amount of time. Introducing corporates to the data and insight, which enables them to move from probability to possibility, has been my key areas of interest. 

    Leave a Comment

    FAQs

    How much is the Organic Drinks market?

    The Organic Drinks market size was valued at USD 19.07 Billion in 2023.

    What is the growth rate of the Organic Drinks market?

    The Organic Drinks market is projected to grow at a CAGR of 11.30% during 2024-2032.

    Which Region held the largest market share in the Organic Drinks market?

    North America had the largest share of the Organic Drinks market

    Who are the key players in the Organic Drinks market?

    The key players in the Organic Drinks market are Hain Celestial (U.S.), Suja Life LLC (U.S.), the Coca-Cola Company (U.S.), Danone S.A. (France), Purity Organic LLC (U.S.), the Better Drinks Co. (New Zealand), Parker's Organic Juices Pty Ltd (Australia), Bison Organic Beer (U.S.), James White Drinks Ltd. (U.K.), PepsiCo Inc. (U.S.), Nutrition & Sante Iberia S.L. (Spain), Republica Coffee (Australia), The WhiteWave Foods Company (U.S.), Alnatura Produktions & Handels GmbH (Germany), Parkers Organic Juices PTY LTD (Australia).

    Which type led the Organic Drinks market?

    The Non-Alcoholic Organic Drinks category dominated the market in 2023.

    Which distribution channel had the largest market share in the Organic Drinks market?

    The store-based channel had the largest share of the Organic Drinks market.

    Market Summary

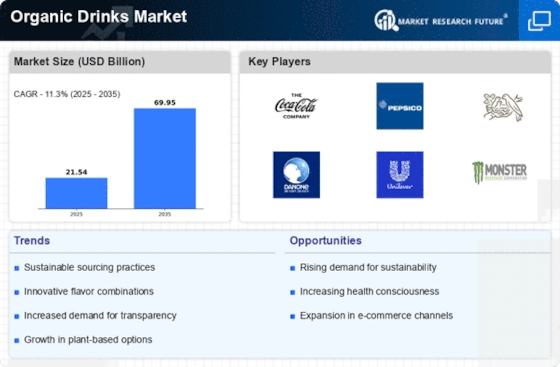
    As per MRFR analysis, the Organic Drinks Market Size was estimated at 21.54 USD Billion in 2024. The Organic Drinks industry is projected to grow from 23.97 USD Billion in 2025 to 69.95 USD Billion by 2035, exhibiting a compound annual growth rate (CAGR) of 11.3 during the forecast period 2025 - 2035.

    Key Market Trends & Highlights

    The Organic Drinks Market is experiencing robust growth driven by health consciousness and sustainability trends.

    • The North American region remains the largest market for organic drinks, reflecting a strong health and wellness focus among consumers.
    • In contrast, the Asia-Pacific region is emerging as the fastest-growing market, driven by evolving consumer preferences for organic products.
    • The non-alcoholic segment continues to dominate the market, while the alcoholic segment is witnessing rapid growth due to innovative flavor profiles.
    • Key market drivers include rising health consciousness and sustainability trends, which are shaping consumer choices in both store-based and non-store-based segments.

    Market Size & Forecast

    2024 Market Size 21.54 (USD Billion)
    2035 Market Size 69.95 (USD Billion)
    CAGR (2025 - 2035) 11.3%
    Largest Regional Market Share in 2024 North America

    Major Players

    <p>Coca-Cola (US), PepsiCo (US), Nestle (CH), Danone (FR), Unilever (GB), Monster Beverage Corporation (US), Kraft Heinz (US), Hain Celestial Group (US), Organic Valley (US)</p>

    Market Trends

    The Organic Drinks Market is currently experiencing a notable transformation, driven by a growing consumer preference for health-conscious choices. This shift is largely influenced by an increasing awareness of the benefits associated with organic ingredients, which are perceived as safer and more nutritious compared to their conventional counterparts. As consumers become more discerning, they tend to gravitate towards beverages that not only satisfy their taste preferences but also align with their values regarding sustainability and environmental impact. This trend is further amplified by the rise of social media, where information about organic products spreads rapidly, influencing purchasing decisions and brand loyalty. Moreover, the Organic Drinks Market is witnessing a diversification of product offerings, as manufacturers innovate to meet the evolving demands of consumers. This includes the introduction of unique flavors, functional beverages that promote wellness, and options catering to specific dietary needs. The market appears to be expanding beyond traditional categories, incorporating elements such as adaptogens and superfoods, which may enhance the appeal of organic drinks. As the landscape continues to evolve, it seems likely that the Organic Drinks Market will further solidify its position as a key player in the broader beverage industry, reflecting a shift towards healthier lifestyles and conscious consumption.

    Health and Wellness Focus

    The Organic Drinks Market is increasingly characterized by a strong emphasis on health and wellness. Consumers are actively seeking beverages that contribute positively to their overall well-being, leading to a rise in demand for organic options that are free from artificial additives and preservatives.

    Sustainability and Ethical Sourcing

    Sustainability has emerged as a critical factor influencing consumer choices within the Organic Drinks Market. There is a growing expectation for brands to demonstrate ethical sourcing practices, which resonates with environmentally conscious consumers who prioritize products that support sustainable agriculture.

    Innovative Product Development

    Innovation plays a pivotal role in the Organic Drinks Market, as companies strive to differentiate their offerings. This trend encompasses the introduction of novel flavors, functional ingredients, and beverages designed to cater to specific dietary preferences, thereby attracting a broader audience.

    The increasing consumer preference for organic beverages reflects a broader trend towards health-conscious choices and sustainable practices in food consumption.

    U.S. Department of Agriculture (USDA)

    Organic Drinks Market Market Drivers

    Sustainability Trends

    Sustainability has emerged as a pivotal driver within the Organic Drinks Market, as consumers increasingly seek products that align with their environmental values. The demand for sustainably sourced ingredients and eco-friendly packaging is on the rise, with many consumers willing to pay a premium for products that demonstrate a commitment to environmental stewardship. Reports suggest that nearly 60 percent of consumers consider sustainability when making beverage choices, indicating a significant shift in purchasing behavior. This trend compels companies in the Organic Drinks Market to adopt sustainable practices, from sourcing organic ingredients to implementing eco-friendly production methods. As a result, brands that prioritize sustainability are likely to gain a competitive edge, appealing to a growing segment of environmentally conscious consumers.

    Innovative Flavor Profiles

    Innovation in flavor profiles is becoming a key differentiator in the Organic Drinks Market, as brands strive to capture consumer interest in a crowded marketplace. The introduction of unique and exotic flavors, often derived from organic sources, is attracting adventurous consumers looking for novel taste experiences. Market analysis reveals that beverages featuring innovative flavors are witnessing higher sales growth compared to traditional options, suggesting that consumers are eager to explore new taste sensations. This trend encourages companies within the Organic Drinks Market to invest in research and development, creating products that not only meet health standards but also excite the palate. As a result, the ability to offer distinctive flavors may become a crucial factor in brand loyalty and market share.

    Rising Health Consciousness

    The Organic Drinks Market is experiencing a notable surge in demand driven by an increasing awareness of health and wellness among consumers. As individuals become more informed about the benefits of organic ingredients, they are gravitating towards beverages that promise natural and wholesome nutrition. Recent data indicates that the organic beverage segment has seen a growth rate of approximately 10 percent annually, reflecting a shift in consumer preferences towards healthier options. This trend is particularly pronounced among younger demographics, who are more likely to prioritize organic products in their purchasing decisions. Consequently, brands within the Organic Drinks Market are responding by expanding their product lines to include a variety of organic options, catering to the evolving tastes and preferences of health-conscious consumers.

    Evolving Consumer Preferences

    Consumer preferences are rapidly evolving, significantly impacting the Organic Drinks Market. A growing segment of the population is shifting towards plant-based diets and organic lifestyles, which is reflected in their beverage choices. Data indicates that approximately 40 percent of consumers are actively seeking organic options, driven by a desire for transparency in ingredient sourcing and a preference for natural flavors. This shift is prompting brands within the Organic Drinks Market to adapt their marketing strategies and product formulations to align with these changing preferences. Companies are increasingly focusing on clean labels and minimal processing, appealing to consumers who prioritize authenticity and simplicity in their food and beverage choices. As these preferences continue to evolve, the Organic Drinks Market must remain agile to meet the demands of a discerning consumer base.

    Increased Availability of Organic Ingredients

    The Organic Drinks Market is benefiting from an enhanced supply chain for organic ingredients, which has made it easier for manufacturers to source high-quality components. As more farmers transition to organic farming practices, the availability of organic fruits, herbs, and other ingredients has expanded significantly. This increase in supply is crucial for the growth of the Organic Drinks Market, as it allows brands to innovate and diversify their product offerings without facing significant cost barriers. Furthermore, the establishment of certification programs and regulatory frameworks has bolstered consumer confidence in organic labeling, ensuring that products meet stringent quality standards. Consequently, the improved accessibility of organic ingredients is likely to fuel further growth in the market, as companies can respond more effectively to consumer demand for organic beverages.

    Market Segment Insights

    By Type: Non-Alcoholic (Largest) vs. Alcoholic (Fastest-Growing)

    <p>The Organic Drinks Market is currently dominated by the Non-Alcoholic segment, which has significantly outpaced the Alcoholic segment in market share. Non-Alcoholic organic drinks appeal to a broad consumer base, capitalizing on the increasing health consciousness among individuals. The organic certification and the absence of artificial ingredients in these products have led to growing demand, particularly among families and health-oriented consumers seeking natural alternatives. In contrast, the Alcoholic segment is on a rapid growth trajectory, becoming increasingly popular among millennials and younger demographics looking for organic choices in their beverages. This trend is driven by a growing preference for quality over quantity and a heightened awareness of the origins and ingredients of alcoholic products.</p>

    <p>Non-Alcoholic (Dominant) vs. Alcoholic (Emerging)</p>

    <p>In the Organic Drinks Market, the Non-Alcoholic segment stands out as the dominant player, characterized by its wide variety of options, including organic juices, teas, and soft drinks. This dominance is supported by robust consumer demand for healthier options that provide taste without compromising well-being. In contrast, the Alcoholic segment, while emerging, is rapidly capturing attention with a diverse range of organic wines, beers, and spirits that cater to discerning consumers. This segment appeals to those seeking unique flavor profiles and environmentally-friendly production methods, reflecting a significant shift in consumer preferences towards organic offerings. The growth of the Alcoholic segment indicates a promising future for organic alcoholic beverages as they carve out their niche in a competitive market.</p>

    By Distribution Channel: Store-Based (Largest) vs. Non-Store-Based (Fastest-Growing)

    <p>The distribution of organic drinks across various channels shows a significant preference for store-based shopping, which captures the majority of the market share. Retail outlets such as supermarkets and health food stores provide consumers with immediate access to organic beverages, leveraging established customer trust and brand recognition. In contrast, non-store-based channels, including e-commerce platforms and direct-to-consumer delivery services, have begun to carve out a notable presence, especially among younger consumers who prioritize convenience and variety in their shopping experience.</p>

    <p>Distribution Channel: Store-Based (Dominant) vs. Non-Store-Based (Emerging)</p>

    <p>Store-based distribution channels dominate the organic drinks market by providing a familiar shopping environment with well-established products that appeal to health-conscious consumers. These traditional retail outlets are pivotal for brand exposure, allowing customers to browse various offerings firsthand. On the other hand, non-store-based channels are rapidly emerging as a significant force, driven by the digital transformation of shopping habits and an increased demand for convenience. Many consumers now prefer to purchase organic drinks online, influenced by the ease of comparing brands and accessing exclusive products. This channel is characterized by innovative marketing strategies, direct engagement with consumers, and a wider selection of niche products that cater to evolving consumer tastes.</p>

    By Packaging Type: Bottles (Largest) vs. Cans (Fastest-Growing)

    <p>In the Organic Drinks Market, the packaging type segment is predominantly dominated by bottles, which hold the largest market share among various packaging formats. Bottles are favored for their convenient handling and perceived sustainability, attracting health-conscious and environmentally aware consumers. Following bottles, cans are gaining significant traction, thanks to their portable nature and recyclability, appealing to a broader range of consumers seeking convenience and sustainability in their beverage choices.</p>

    <p>Bottles (Dominant) vs. Cans (Emerging)</p>

    <p>Bottles have established themselves as the dominant packaging type in the Organic Drinks Market due to their extensive use for various types of organic beverages, including juices, smoothies, and teas. They offer an appealing aesthetic, which enhances brand visibility and consumer trust. On the other hand, cans represent an emerging segment, characterized by their lightweight nature and ability to preserve freshness, thus appealing to on-the-go lifestyles. The rising trend towards sustainability is shaping the growth of cans, as they are increasingly viewed as eco-friendly options, positioning them strongly for future market expansion.</p>

    Get more detailed insights about Organic Drinks Market Research Report - Forecast till 2035

    Regional Insights

    By Region, the study provides market insights into North America, Europe, Asia-Pacific and the Rest of the World. The North American Organic Drinks market accounted for USD 7.74 billion in 2022 and is expected to exhibit a significant CAGR growth during the study period. Consumer use of organic drinks has increased due to the Region's growing interest in health and well-being. In several nations, like the U.S. and Mexico, consumers are embracing the meal replacement trend, raising the demand for organic drinks.

    The organic drink market is anticipated to increase sales value due to the expansion in demand for such beverages.

    Further, the major countries studied in the market report are The U.S., Canada, German, France, the U.K., Italy, Spain, China, Japan, India, Australia, South Korea, and Brazil.

    Figure 2: ORGANIC DRINKS MARKET SHARE BY REGION 2022 (%)

    ORGANIC DRINKS MARKET SHARE BY REGION 2022

    Source: Secondary Research, Primary Research, Market Research Future Database and Analyst Review

    Europe's Organic Drinks market accounts for the second-largest market share during the forecast period. Natural and nutritious beverages are becoming more popular among the nation's health-conscious customers. There is a great need for organic beverages in the area since shoppers are concerned about the effects of synthetic components, food additives, and stabilizers used by beverage production corporations. Emerging businesses earn considerable market share through unconventional sales channels like social media and e-commerce. Further, the Germany Organic Drinks market held the largest market share, and the U.K. Organic Drinks market was the fastest-growing market in the European Region.

    Asia-Pacific Organic Drinks market is also emerging at a rapid rate. The consumption of alcoholic beverages is rising in countries such as India, China, and Australia. The rising economic conditions and wellness concerns among consumers are shifting towards organic beverages, driving the demand for organic alcoholic beverages throughout the Region and contributing to the growth of the organic beverages market. Moreover, China's Organic Drinks market held the largest market share, and the India Organic Drinks market was the fastest-growing market in the Asia-Pacific region.

    Key Players and Competitive Insights

    Leading industry companies are investing significantly in R&D to broaden their product offerings, which will spur further expansion of the organic drink product market. Important market developments include new product releases, contractual agreements, mergers and acquisitions, greater investments, and collaboration with other organizations. Market participants also engage in several strategic actions to increase their worldwide presence. The Organic Drinks industry must offer reasonably priced products to grow and thrive in a more cutthroat and competitive environment.

    One of the primary business strategies manufacturers employ in the worldwide Organic Drinks industry to benefit customers and expand the market sector is local manufacturing to reduce operating costs. The Organic Drinks industry has recently provided some of medicine's most important benefits.

    Major players in the Organic Drinks market, Hain Celestial (U.S.),  Suja Life LLC (U.S.), the Coca-Cola Company (U.S.), Danone S.A. (France),  Purity Organic LLC (U.S.), the Better Drinks Co. (New Zealand), Parker's Organic Juices Pty Ltd (Australia),  Bison Organic Beer (U.S.), James White Drinks Ltd. (U.K.),  PepsiCo Inc. (U.S.), Nutrition & Sante Iberia S.L. (Spain), Republica Coffee (Australia),  The WhiteWave Foods Company (U.S.), Alnatura Produktions & Handels GmbH (Germany), Parkers Organic Juices PTY LTD (Australia), and others, are attempting to increase market demand by investing in research and development operations.

    The only spirits firm that distills its alcoholic beverages using solely natural cane sugar grown in Colombia's Cauca Valley is Drake's Organic Spirits, certified USDA Organic, Gluten Free®, Non-GMO, Vegan, and Kosher. Drake's Organic Spirits debuted a brand-new BOXTAIL flavor in January 2022 called Drake's Perfect Margarita BOXTAIL. It joins Drake's lineup of RTD drinks, including the Black Cherry Limeade, Watermelon-Tini, Mango Punch, and Minted Mojito.

    Anheuser-Busch InBev SA/NV, also known as A.B. InBev, is a Belgian beverage and brewing business headquartered in Leuven, Belgium. A worldwide functional management office for A.B. InBev is in New York City. At the same time, regional offices are also located in So Paulo, London, St. Louis, Mexico City, Bremen, and Johannesburg. In March 2022, Anheuser-Busch InBev will introduce a new line of Michelob Ultra hard seltzers that use coconut water as an ingredient. There are four tastes in all in this line: Kiwi Lime, Berry Hibiscus, Strawberry Guava, and Blueberry Watermelon.

    Key Companies in the Organic Drinks Market market include

    Industry Developments

      • In June 2022, System Foods, a food and beverage company, purchased Chameleon Organic Coffee from Nestlé USA. The product line offered by Chameleon Organic Coffee consists of multi-serve concentrations and single-serve ready-to-drink items.
      • March 2022: Graasi Barley Water has launched a brand-new collection of ready-to-drink (RTD) organic waters in flavors including Citrus Mint, Cucumber Lime and Lemongrass Ginger.

    Future Outlook

    Organic Drinks Market Future Outlook

    <p>The Organic Drinks Market is projected to grow at an 11.3% CAGR from 2024 to 2035, driven by increasing health consciousness, sustainable practices, and innovative product offerings.</p>

    New opportunities lie in:

    • <p>Expansion of organic beverage subscription services</p>
    • <p>Development of plant-based functional drinks</p>
    • <p>Investment in eco-friendly packaging solutions</p>

    <p>By 2035, the market is expected to be robust, reflecting strong consumer demand and innovative growth strategies.</p>

    Market Segmentation

    Organic Drinks Market Type Outlook

    • Alcoholic
    • Non-Alcoholic

    Organic Drinks Market Packaging Type Outlook

    • Bottles
    • Cans
    • Others

    Organic Drinks Market Distribution Channel Outlook

    • Store-Based
    • Non-Store-Based

    Report Scope

    MARKET SIZE 202421.54(USD Billion)
    MARKET SIZE 202523.97(USD Billion)
    MARKET SIZE 203569.95(USD Billion)
    COMPOUND ANNUAL GROWTH RATE (CAGR)11.3% (2024 - 2035)
    REPORT COVERAGERevenue Forecast, Competitive Landscape, Growth Factors, and Trends
    BASE YEAR2024
    Market Forecast Period2025 - 2035
    Historical Data2019 - 2024
    Market Forecast UnitsUSD Billion
    Key Companies ProfiledMarket analysis in progress
    Segments CoveredMarket segmentation analysis in progress
    Key Market OpportunitiesGrowing consumer preference for health-conscious, sustainable beverages drives innovation in the Organic Drinks Market.
    Key Market DynamicsRising consumer preference for health-conscious beverages drives innovation and competition in the organic drinks sector.
    Countries CoveredNorth America, Europe, APAC, South America, MEA

    FAQs

    How much is the Organic Drinks market?

    The Organic Drinks market size was valued at USD 19.07 Billion in 2023.

    What is the growth rate of the Organic Drinks market?

    The Organic Drinks market is projected to grow at a CAGR of 11.30% during 2024-2032.

    Which Region held the largest market share in the Organic Drinks market?

    North America had the largest share of the Organic Drinks market

    Who are the key players in the Organic Drinks market?

    The key players in the Organic Drinks market are Hain Celestial (U.S.), Suja Life LLC (U.S.), the Coca-Cola Company (U.S.), Danone S.A. (France), Purity Organic LLC (U.S.), the Better Drinks Co. (New Zealand), Parker's Organic Juices Pty Ltd (Australia), Bison Organic Beer (U.S.), James White Drinks Ltd. (U.K.), PepsiCo Inc. (U.S.), Nutrition &amp; Sante Iberia S.L. (Spain), Republica Coffee (Australia), The WhiteWave Foods Company (U.S.), Alnatura Produktions &amp; Handels GmbH (Germany), Parkers Organic Juices PTY LTD (Australia).

    Which type led the Organic Drinks market?

    The Non-Alcoholic Organic Drinks category dominated the market in 2023.

    Which distribution channel had the largest market share in the Organic Drinks market?

    The store-based channel had the largest share of the Organic Drinks market.

    1. SECTION I: EXECUTIVE SUMMARY AND KEY HIGHLIGHTS
      1. | 1.1 EXECUTIVE SUMMARY
      2. | | 1.1.1 Market Overview
      3. | | 1.1.2 Key Findings
      4. | | 1.1.3 Market Segmentation
      5. | | 1.1.4 Competitive Landscape
      6. | | 1.1.5 Challenges and Opportunities
      7. | | 1.1.6 Future Outlook
    2. SECTION II: SCOPING, METHODOLOGY AND MARKET STRUCTURE
      1. | 2.1 MARKET INTRODUCTION
      2. | | 2.1.1 Definition
      3. | | 2.1.2 Scope of the study
      4. | | | 2.1.2.1 Research Objective
      5. | | | 2.1.2.2 Assumption
      6. | | | 2.1.2.3 Limitations
      7. | 2.2 RESEARCH METHODOLOGY
      8. | | 2.2.1 Overview
      9. | | 2.2.2 Data Mining
      10. | | 2.2.3 Secondary Research
      11. | | 2.2.4 Primary Research
      12. | | | 2.2.4.1 Primary Interviews and Information Gathering Process
      13. | | | 2.2.4.2 Breakdown of Primary Respondents
      14. | | 2.2.5 Forecasting Model
      15. | | 2.2.6 Market Size Estimation
      16. | | | 2.2.6.1 Bottom-Up Approach
      17. | | | 2.2.6.2 Top-Down Approach
      18. | | 2.2.7 Data Triangulation
      19. | | 2.2.8 Validation
    3. SECTION III: QUALITATIVE ANALYSIS
      1. | 3.1 MARKET DYNAMICS
      2. | | 3.1.1 Overview
      3. | | 3.1.2 Drivers
      4. | | 3.1.3 Restraints
      5. | | 3.1.4 Opportunities
      6. | 3.2 MARKET FACTOR ANALYSIS
      7. | | 3.2.1 Value chain Analysis
      8. | | 3.2.2 Porter's Five Forces Analysis
      9. | | | 3.2.2.1 Bargaining Power of Suppliers
      10. | | | 3.2.2.2 Bargaining Power of Buyers
      11. | | | 3.2.2.3 Threat of New Entrants
      12. | | | 3.2.2.4 Threat of Substitutes
      13. | | | 3.2.2.5 Intensity of Rivalry
      14. | | 3.2.3 COVID-19 Impact Analysis
      15. | | | 3.2.3.1 Market Impact Analysis
      16. | | | 3.2.3.2 Regional Impact
      17. | | | 3.2.3.3 Opportunity and Threat Analysis
    4. SECTION IV: QUANTITATIVE ANALYSIS
      1. | 4.1 Food, Beverages & Nutrition, BY Type (USD Billion)
      2. | | 4.1.1 Alcoholic
      3. | | 4.1.2 Non-Alcoholic
      4. | 4.2 Food, Beverages & Nutrition, BY Distribution Channel (USD Billion)
      5. | | 4.2.1 Store-Based
      6. | | 4.2.2 Non-Store-Based
      7. | 4.3 Food, Beverages & Nutrition, BY Packaging Type (USD Billion)
      8. | | 4.3.1 Bottles
      9. | | 4.3.2 Cans
      10. | | 4.3.3 Others
      11. | 4.4 Food, Beverages & Nutrition, BY Region (USD Billion)
      12. | | 4.4.1 North America
      13. | | | 4.4.1.1 US
      14. | | | 4.4.1.2 Canada
      15. | | 4.4.2 Europe
      16. | | | 4.4.2.1 Germany
      17. | | | 4.4.2.2 UK
      18. | | | 4.4.2.3 France
      19. | | | 4.4.2.4 Russia
      20. | | | 4.4.2.5 Italy
      21. | | | 4.4.2.6 Spain
      22. | | | 4.4.2.7 Rest of Europe
      23. | | 4.4.3 APAC
      24. | | | 4.4.3.1 China
      25. | | | 4.4.3.2 India
      26. | | | 4.4.3.3 Japan
      27. | | | 4.4.3.4 South Korea
      28. | | | 4.4.3.5 Malaysia
      29. | | | 4.4.3.6 Thailand
      30. | | | 4.4.3.7 Indonesia
      31. | | | 4.4.3.8 Rest of APAC
      32. | | 4.4.4 South America
      33. | | | 4.4.4.1 Brazil
      34. | | | 4.4.4.2 Mexico
      35. | | | 4.4.4.3 Argentina
      36. | | | 4.4.4.4 Rest of South America
      37. | | 4.4.5 MEA
      38. | | | 4.4.5.1 GCC Countries
      39. | | | 4.4.5.2 South Africa
      40. | | | 4.4.5.3 Rest of MEA
    5. SECTION V: COMPETITIVE ANALYSIS
      1. | 5.1 Competitive Landscape
      2. | | 5.1.1 Overview
      3. | | 5.1.2 Competitive Analysis
      4. | | 5.1.3 Market share Analysis
      5. | | 5.1.4 Major Growth Strategy in the Food, Beverages & Nutrition
      6. | | 5.1.5 Competitive Benchmarking
      7. | | 5.1.6 Leading Players in Terms of Number of Developments in the Food, Beverages & Nutrition
      8. | | 5.1.7 Key developments and growth strategies
      9. | | | 5.1.7.1 New Product Launch/Service Deployment
      10. | | | 5.1.7.2 Merger & Acquisitions
      11. | | | 5.1.7.3 Joint Ventures
      12. | | 5.1.8 Major Players Financial Matrix
      13. | | | 5.1.8.1 Sales and Operating Income
      14. | | | 5.1.8.2 Major Players R&D Expenditure. 2023
      15. | 5.2 Company Profiles
      16. | | 5.2.1 Coca-Cola (US)
      17. | | | 5.2.1.1 Financial Overview
      18. | | | 5.2.1.2 Products Offered
      19. | | | 5.2.1.3 Key Developments
      20. | | | 5.2.1.4 SWOT Analysis
      21. | | | 5.2.1.5 Key Strategies
      22. | | 5.2.2 PepsiCo (US)
      23. | | | 5.2.2.1 Financial Overview
      24. | | | 5.2.2.2 Products Offered
      25. | | | 5.2.2.3 Key Developments
      26. | | | 5.2.2.4 SWOT Analysis
      27. | | | 5.2.2.5 Key Strategies
      28. | | 5.2.3 Nestle (CH)
      29. | | | 5.2.3.1 Financial Overview
      30. | | | 5.2.3.2 Products Offered
      31. | | | 5.2.3.3 Key Developments
      32. | | | 5.2.3.4 SWOT Analysis
      33. | | | 5.2.3.5 Key Strategies
      34. | | 5.2.4 Danone (FR)
      35. | | | 5.2.4.1 Financial Overview
      36. | | | 5.2.4.2 Products Offered
      37. | | | 5.2.4.3 Key Developments
      38. | | | 5.2.4.4 SWOT Analysis
      39. | | | 5.2.4.5 Key Strategies
      40. | | 5.2.5 Unilever (GB)
      41. | | | 5.2.5.1 Financial Overview
      42. | | | 5.2.5.2 Products Offered
      43. | | | 5.2.5.3 Key Developments
      44. | | | 5.2.5.4 SWOT Analysis
      45. | | | 5.2.5.5 Key Strategies
      46. | | 5.2.6 Monster Beverage Corporation (US)
      47. | | | 5.2.6.1 Financial Overview
      48. | | | 5.2.6.2 Products Offered
      49. | | | 5.2.6.3 Key Developments
      50. | | | 5.2.6.4 SWOT Analysis
      51. | | | 5.2.6.5 Key Strategies
      52. | | 5.2.7 Kraft Heinz (US)
      53. | | | 5.2.7.1 Financial Overview
      54. | | | 5.2.7.2 Products Offered
      55. | | | 5.2.7.3 Key Developments
      56. | | | 5.2.7.4 SWOT Analysis
      57. | | | 5.2.7.5 Key Strategies
      58. | | 5.2.8 Hain Celestial Group (US)
      59. | | | 5.2.8.1 Financial Overview
      60. | | | 5.2.8.2 Products Offered
      61. | | | 5.2.8.3 Key Developments
      62. | | | 5.2.8.4 SWOT Analysis
      63. | | | 5.2.8.5 Key Strategies
      64. | | 5.2.9 Organic Valley (US)
      65. | | | 5.2.9.1 Financial Overview
      66. | | | 5.2.9.2 Products Offered
      67. | | | 5.2.9.3 Key Developments
      68. | | | 5.2.9.4 SWOT Analysis
      69. | | | 5.2.9.5 Key Strategies
      70. | 5.3 Appendix
      71. | | 5.3.1 References
      72. | | 5.3.2 Related Reports
    6. LIST OF FIGURES
      1. | 6.1 MARKET SYNOPSIS
      2. | 6.2 NORTH AMERICA MARKET ANALYSIS
      3. | 6.3 US MARKET ANALYSIS BY TYPE
      4. | 6.4 US MARKET ANALYSIS BY DISTRIBUTION CHANNEL
      5. | 6.5 US MARKET ANALYSIS BY PACKAGING TYPE
      6. | 6.6 CANADA MARKET ANALYSIS BY TYPE
      7. | 6.7 CANADA MARKET ANALYSIS BY DISTRIBUTION CHANNEL
      8. | 6.8 CANADA MARKET ANALYSIS BY PACKAGING TYPE
      9. | 6.9 EUROPE MARKET ANALYSIS
      10. | 6.10 GERMANY MARKET ANALYSIS BY TYPE
      11. | 6.11 GERMANY MARKET ANALYSIS BY DISTRIBUTION CHANNEL
      12. | 6.12 GERMANY MARKET ANALYSIS BY PACKAGING TYPE
      13. | 6.13 UK MARKET ANALYSIS BY TYPE
      14. | 6.14 UK MARKET ANALYSIS BY DISTRIBUTION CHANNEL
      15. | 6.15 UK MARKET ANALYSIS BY PACKAGING TYPE
      16. | 6.16 FRANCE MARKET ANALYSIS BY TYPE
      17. | 6.17 FRANCE MARKET ANALYSIS BY DISTRIBUTION CHANNEL
      18. | 6.18 FRANCE MARKET ANALYSIS BY PACKAGING TYPE
      19. | 6.19 RUSSIA MARKET ANALYSIS BY TYPE
      20. | 6.20 RUSSIA MARKET ANALYSIS BY DISTRIBUTION CHANNEL
      21. | 6.21 RUSSIA MARKET ANALYSIS BY PACKAGING TYPE
      22. | 6.22 ITALY MARKET ANALYSIS BY TYPE
      23. | 6.23 ITALY MARKET ANALYSIS BY DISTRIBUTION CHANNEL
      24. | 6.24 ITALY MARKET ANALYSIS BY PACKAGING TYPE
      25. | 6.25 SPAIN MARKET ANALYSIS BY TYPE
      26. | 6.26 SPAIN MARKET ANALYSIS BY DISTRIBUTION CHANNEL
      27. | 6.27 SPAIN MARKET ANALYSIS BY PACKAGING TYPE
      28. | 6.28 REST OF EUROPE MARKET ANALYSIS BY TYPE
      29. | 6.29 REST OF EUROPE MARKET ANALYSIS BY DISTRIBUTION CHANNEL
      30. | 6.30 REST OF EUROPE MARKET ANALYSIS BY PACKAGING TYPE
      31. | 6.31 APAC MARKET ANALYSIS
      32. | 6.32 CHINA MARKET ANALYSIS BY TYPE
      33. | 6.33 CHINA MARKET ANALYSIS BY DISTRIBUTION CHANNEL
      34. | 6.34 CHINA MARKET ANALYSIS BY PACKAGING TYPE
      35. | 6.35 INDIA MARKET ANALYSIS BY TYPE
      36. | 6.36 INDIA MARKET ANALYSIS BY DISTRIBUTION CHANNEL
      37. | 6.37 INDIA MARKET ANALYSIS BY PACKAGING TYPE
      38. | 6.38 JAPAN MARKET ANALYSIS BY TYPE
      39. | 6.39 JAPAN MARKET ANALYSIS BY DISTRIBUTION CHANNEL
      40. | 6.40 JAPAN MARKET ANALYSIS BY PACKAGING TYPE
      41. | 6.41 SOUTH KOREA MARKET ANALYSIS BY TYPE
      42. | 6.42 SOUTH KOREA MARKET ANALYSIS BY DISTRIBUTION CHANNEL
      43. | 6.43 SOUTH KOREA MARKET ANALYSIS BY PACKAGING TYPE
      44. | 6.44 MALAYSIA MARKET ANALYSIS BY TYPE
      45. | 6.45 MALAYSIA MARKET ANALYSIS BY DISTRIBUTION CHANNEL
      46. | 6.46 MALAYSIA MARKET ANALYSIS BY PACKAGING TYPE
      47. | 6.47 THAILAND MARKET ANALYSIS BY TYPE
      48. | 6.48 THAILAND MARKET ANALYSIS BY DISTRIBUTION CHANNEL
      49. | 6.49 THAILAND MARKET ANALYSIS BY PACKAGING TYPE
      50. | 6.50 INDONESIA MARKET ANALYSIS BY TYPE
      51. | 6.51 INDONESIA MARKET ANALYSIS BY DISTRIBUTION CHANNEL
      52. | 6.52 INDONESIA MARKET ANALYSIS BY PACKAGING TYPE
      53. | 6.53 REST OF APAC MARKET ANALYSIS BY TYPE
      54. | 6.54 REST OF APAC MARKET ANALYSIS BY DISTRIBUTION CHANNEL
      55. | 6.55 REST OF APAC MARKET ANALYSIS BY PACKAGING TYPE
      56. | 6.56 SOUTH AMERICA MARKET ANALYSIS
      57. | 6.57 BRAZIL MARKET ANALYSIS BY TYPE
      58. | 6.58 BRAZIL MARKET ANALYSIS BY DISTRIBUTION CHANNEL
      59. | 6.59 BRAZIL MARKET ANALYSIS BY PACKAGING TYPE
      60. | 6.60 MEXICO MARKET ANALYSIS BY TYPE
      61. | 6.61 MEXICO MARKET ANALYSIS BY DISTRIBUTION CHANNEL
      62. | 6.62 MEXICO MARKET ANALYSIS BY PACKAGING TYPE
      63. | 6.63 ARGENTINA MARKET ANALYSIS BY TYPE
      64. | 6.64 ARGENTINA MARKET ANALYSIS BY DISTRIBUTION CHANNEL
      65. | 6.65 ARGENTINA MARKET ANALYSIS BY PACKAGING TYPE
      66. | 6.66 REST OF SOUTH AMERICA MARKET ANALYSIS BY TYPE
      67. | 6.67 REST OF SOUTH AMERICA MARKET ANALYSIS BY DISTRIBUTION CHANNEL
      68. | 6.68 REST OF SOUTH AMERICA MARKET ANALYSIS BY PACKAGING TYPE
      69. | 6.69 MEA MARKET ANALYSIS
      70. | 6.70 GCC COUNTRIES MARKET ANALYSIS BY TYPE
      71. | 6.71 GCC COUNTRIES MARKET ANALYSIS BY DISTRIBUTION CHANNEL
      72. | 6.72 GCC COUNTRIES MARKET ANALYSIS BY PACKAGING TYPE
      73. | 6.73 SOUTH AFRICA MARKET ANALYSIS BY TYPE
      74. | 6.74 SOUTH AFRICA MARKET ANALYSIS BY DISTRIBUTION CHANNEL
      75. | 6.75 SOUTH AFRICA MARKET ANALYSIS BY PACKAGING TYPE
      76. | 6.76 REST OF MEA MARKET ANALYSIS BY TYPE
      77. | 6.77 REST OF MEA MARKET ANALYSIS BY DISTRIBUTION CHANNEL
      78. | 6.78 REST OF MEA MARKET ANALYSIS BY PACKAGING TYPE
      79. | 6.79 KEY BUYING CRITERIA OF FOOD, BEVERAGES & NUTRITION
      80. | 6.80 RESEARCH PROCESS OF MRFR
      81. | 6.81 DRO ANALYSIS OF FOOD, BEVERAGES & NUTRITION
      82. | 6.82 DRIVERS IMPACT ANALYSIS: FOOD, BEVERAGES & NUTRITION
      83. | 6.83 RESTRAINTS IMPACT ANALYSIS: FOOD, BEVERAGES & NUTRITION
      84. | 6.84 SUPPLY / VALUE CHAIN: FOOD, BEVERAGES & NUTRITION
      85. | 6.85 FOOD, BEVERAGES & NUTRITION, BY TYPE, 2024 (% SHARE)
      86. | 6.86 FOOD, BEVERAGES & NUTRITION, BY TYPE, 2024 TO 2035 (USD Billion)
      87. | 6.87 FOOD, BEVERAGES & NUTRITION, BY DISTRIBUTION CHANNEL, 2024 (% SHARE)
      88. | 6.88 FOOD, BEVERAGES & NUTRITION, BY DISTRIBUTION CHANNEL, 2024 TO 2035 (USD Billion)
      89. | 6.89 FOOD, BEVERAGES & NUTRITION, BY PACKAGING TYPE, 2024 (% SHARE)
      90. | 6.90 FOOD, BEVERAGES & NUTRITION, BY PACKAGING TYPE, 2024 TO 2035 (USD Billion)
      91. | 6.91 BENCHMARKING OF MAJOR COMPETITORS
    7. LIST OF TABLES
      1. | 7.1 LIST OF ASSUMPTIONS
      2. | | 7.1.1
      3. | 7.2 North America MARKET SIZE ESTIMATES; FORECAST
      4. | | 7.2.1 BY TYPE, 2025-2035 (USD Billion)
      5. | | 7.2.2 BY DISTRIBUTION CHANNEL, 2025-2035 (USD Billion)
      6. | | 7.2.3 BY PACKAGING TYPE, 2025-2035 (USD Billion)
      7. | 7.3 US MARKET SIZE ESTIMATES; FORECAST
      8. | | 7.3.1 BY TYPE, 2025-2035 (USD Billion)
      9. | | 7.3.2 BY DISTRIBUTION CHANNEL, 2025-2035 (USD Billion)
      10. | | 7.3.3 BY PACKAGING TYPE, 2025-2035 (USD Billion)
      11. | 7.4 Canada MARKET SIZE ESTIMATES; FORECAST
      12. | | 7.4.1 BY TYPE, 2025-2035 (USD Billion)
      13. | | 7.4.2 BY DISTRIBUTION CHANNEL, 2025-2035 (USD Billion)
      14. | | 7.4.3 BY PACKAGING TYPE, 2025-2035 (USD Billion)
      15. | 7.5 Europe MARKET SIZE ESTIMATES; FORECAST
      16. | | 7.5.1 BY TYPE, 2025-2035 (USD Billion)
      17. | | 7.5.2 BY DISTRIBUTION CHANNEL, 2025-2035 (USD Billion)
      18. | | 7.5.3 BY PACKAGING TYPE, 2025-2035 (USD Billion)
      19. | 7.6 Germany MARKET SIZE ESTIMATES; FORECAST
      20. | | 7.6.1 BY TYPE, 2025-2035 (USD Billion)
      21. | | 7.6.2 BY DISTRIBUTION CHANNEL, 2025-2035 (USD Billion)
      22. | | 7.6.3 BY PACKAGING TYPE, 2025-2035 (USD Billion)
      23. | 7.7 UK MARKET SIZE ESTIMATES; FORECAST
      24. | | 7.7.1 BY TYPE, 2025-2035 (USD Billion)
      25. | | 7.7.2 BY DISTRIBUTION CHANNEL, 2025-2035 (USD Billion)
      26. | | 7.7.3 BY PACKAGING TYPE, 2025-2035 (USD Billion)
      27. | 7.8 France MARKET SIZE ESTIMATES; FORECAST
      28. | | 7.8.1 BY TYPE, 2025-2035 (USD Billion)
      29. | | 7.8.2 BY DISTRIBUTION CHANNEL, 2025-2035 (USD Billion)
      30. | | 7.8.3 BY PACKAGING TYPE, 2025-2035 (USD Billion)
      31. | 7.9 Russia MARKET SIZE ESTIMATES; FORECAST
      32. | | 7.9.1 BY TYPE, 2025-2035 (USD Billion)
      33. | | 7.9.2 BY DISTRIBUTION CHANNEL, 2025-2035 (USD Billion)
      34. | | 7.9.3 BY PACKAGING TYPE, 2025-2035 (USD Billion)
      35. | 7.10 Italy MARKET SIZE ESTIMATES; FORECAST
      36. | | 7.10.1 BY TYPE, 2025-2035 (USD Billion)
      37. | | 7.10.2 BY DISTRIBUTION CHANNEL, 2025-2035 (USD Billion)
      38. | | 7.10.3 BY PACKAGING TYPE, 2025-2035 (USD Billion)
      39. | 7.11 Spain MARKET SIZE ESTIMATES; FORECAST
      40. | | 7.11.1 BY TYPE, 2025-2035 (USD Billion)
      41. | | 7.11.2 BY DISTRIBUTION CHANNEL, 2025-2035 (USD Billion)
      42. | | 7.11.3 BY PACKAGING TYPE, 2025-2035 (USD Billion)
      43. | 7.12 Rest of Europe MARKET SIZE ESTIMATES; FORECAST
      44. | | 7.12.1 BY TYPE, 2025-2035 (USD Billion)
      45. | | 7.12.2 BY DISTRIBUTION CHANNEL, 2025-2035 (USD Billion)
      46. | | 7.12.3 BY PACKAGING TYPE, 2025-2035 (USD Billion)
      47. | 7.13 APAC MARKET SIZE ESTIMATES; FORECAST
      48. | | 7.13.1 BY TYPE, 2025-2035 (USD Billion)
      49. | | 7.13.2 BY DISTRIBUTION CHANNEL, 2025-2035 (USD Billion)
      50. | | 7.13.3 BY PACKAGING TYPE, 2025-2035 (USD Billion)
      51. | 7.14 China MARKET SIZE ESTIMATES; FORECAST
      52. | | 7.14.1 BY TYPE, 2025-2035 (USD Billion)
      53. | | 7.14.2 BY DISTRIBUTION CHANNEL, 2025-2035 (USD Billion)
      54. | | 7.14.3 BY PACKAGING TYPE, 2025-2035 (USD Billion)
      55. | 7.15 India MARKET SIZE ESTIMATES; FORECAST
      56. | | 7.15.1 BY TYPE, 2025-2035 (USD Billion)
      57. | | 7.15.2 BY DISTRIBUTION CHANNEL, 2025-2035 (USD Billion)
      58. | | 7.15.3 BY PACKAGING TYPE, 2025-2035 (USD Billion)
      59. | 7.16 Japan MARKET SIZE ESTIMATES; FORECAST
      60. | | 7.16.1 BY TYPE, 2025-2035 (USD Billion)
      61. | | 7.16.2 BY DISTRIBUTION CHANNEL, 2025-2035 (USD Billion)
      62. | | 7.16.3 BY PACKAGING TYPE, 2025-2035 (USD Billion)
      63. | 7.17 South Korea MARKET SIZE ESTIMATES; FORECAST
      64. | | 7.17.1 BY TYPE, 2025-2035 (USD Billion)
      65. | | 7.17.2 BY DISTRIBUTION CHANNEL, 2025-2035 (USD Billion)
      66. | | 7.17.3 BY PACKAGING TYPE, 2025-2035 (USD Billion)
      67. | 7.18 Malaysia MARKET SIZE ESTIMATES; FORECAST
      68. | | 7.18.1 BY TYPE, 2025-2035 (USD Billion)
      69. | | 7.18.2 BY DISTRIBUTION CHANNEL, 2025-2035 (USD Billion)
      70. | | 7.18.3 BY PACKAGING TYPE, 2025-2035 (USD Billion)
      71. | 7.19 Thailand MARKET SIZE ESTIMATES; FORECAST
      72. | | 7.19.1 BY TYPE, 2025-2035 (USD Billion)
      73. | | 7.19.2 BY DISTRIBUTION CHANNEL, 2025-2035 (USD Billion)
      74. | | 7.19.3 BY PACKAGING TYPE, 2025-2035 (USD Billion)
      75. | 7.20 Indonesia MARKET SIZE ESTIMATES; FORECAST
      76. | | 7.20.1 BY TYPE, 2025-2035 (USD Billion)
      77. | | 7.20.2 BY DISTRIBUTION CHANNEL, 2025-2035 (USD Billion)
      78. | | 7.20.3 BY PACKAGING TYPE, 2025-2035 (USD Billion)
      79. | 7.21 Rest of APAC MARKET SIZE ESTIMATES; FORECAST
      80. | | 7.21.1 BY TYPE, 2025-2035 (USD Billion)
      81. | | 7.21.2 BY DISTRIBUTION CHANNEL, 2025-2035 (USD Billion)
      82. | | 7.21.3 BY PACKAGING TYPE, 2025-2035 (USD Billion)
      83. | 7.22 South America MARKET SIZE ESTIMATES; FORECAST
      84. | | 7.22.1 BY TYPE, 2025-2035 (USD Billion)
      85. | | 7.22.2 BY DISTRIBUTION CHANNEL, 2025-2035 (USD Billion)
      86. | | 7.22.3 BY PACKAGING TYPE, 2025-2035 (USD Billion)
      87. | 7.23 Brazil MARKET SIZE ESTIMATES; FORECAST
      88. | | 7.23.1 BY TYPE, 2025-2035 (USD Billion)
      89. | | 7.23.2 BY DISTRIBUTION CHANNEL, 2025-2035 (USD Billion)
      90. | | 7.23.3 BY PACKAGING TYPE, 2025-2035 (USD Billion)
      91. | 7.24 Mexico MARKET SIZE ESTIMATES; FORECAST
      92. | | 7.24.1 BY TYPE, 2025-2035 (USD Billion)
      93. | | 7.24.2 BY DISTRIBUTION CHANNEL, 2025-2035 (USD Billion)
      94. | | 7.24.3 BY PACKAGING TYPE, 2025-2035 (USD Billion)
      95. | 7.25 Argentina MARKET SIZE ESTIMATES; FORECAST
      96. | | 7.25.1 BY TYPE, 2025-2035 (USD Billion)
      97. | | 7.25.2 BY DISTRIBUTION CHANNEL, 2025-2035 (USD Billion)
      98. | | 7.25.3 BY PACKAGING TYPE, 2025-2035 (USD Billion)
      99. | 7.26 Rest of South America MARKET SIZE ESTIMATES; FORECAST
      100. | | 7.26.1 BY TYPE, 2025-2035 (USD Billion)
      101. | | 7.26.2 BY DISTRIBUTION CHANNEL, 2025-2035 (USD Billion)
      102. | | 7.26.3 BY PACKAGING TYPE, 2025-2035 (USD Billion)
      103. | 7.27 MEA MARKET SIZE ESTIMATES; FORECAST
      104. | | 7.27.1 BY TYPE, 2025-2035 (USD Billion)
      105. | | 7.27.2 BY DISTRIBUTION CHANNEL, 2025-2035 (USD Billion)
      106. | | 7.27.3 BY PACKAGING TYPE, 2025-2035 (USD Billion)
      107. | 7.28 GCC Countries MARKET SIZE ESTIMATES; FORECAST
      108. | | 7.28.1 BY TYPE, 2025-2035 (USD Billion)
      109. | | 7.28.2 BY DISTRIBUTION CHANNEL, 2025-2035 (USD Billion)
      110. | | 7.28.3 BY PACKAGING TYPE, 2025-2035 (USD Billion)
      111. | 7.29 South Africa MARKET SIZE ESTIMATES; FORECAST
      112. | | 7.29.1 BY TYPE, 2025-2035 (USD Billion)
      113. | | 7.29.2 BY DISTRIBUTION CHANNEL, 2025-2035 (USD Billion)
      114. | | 7.29.3 BY PACKAGING TYPE, 2025-2035 (USD Billion)
      115. | 7.30 Rest of MEA MARKET SIZE ESTIMATES; FORECAST
      116. | | 7.30.1 BY TYPE, 2025-2035 (USD Billion)
      117. | | 7.30.2 BY DISTRIBUTION CHANNEL, 2025-2035 (USD Billion)
      118. | | 7.30.3 BY PACKAGING TYPE, 2025-2035 (USD Billion)
      119. | 7.31 PRODUCT LAUNCH/PRODUCT DEVELOPMENT/APPROVAL
      120. | | 7.31.1
      121. | 7.32 ACQUISITION/PARTNERSHIP
      122. | | 7.32.1

    Organic Drinks Market Segmentation

    Market Segmentation Overview

    • Detailed segmentation data will be available in the full report
    • Comprehensive analysis by multiple parameters
    • Regional and country-level breakdowns
    • Market size forecasts by segment
    Infographic

    Free Sample Request

    Kindly complete the form below to receive a free sample of this Report

    Get Free Sample

    Customer Strories

    “I am very pleased with how market segments have been defined in a relevant way for my purposes (such as "Portable Freezers & refrigerators" and "last-mile"). In general the report is well structured. Thanks very much for your efforts.”

    Victoria Milne

    Founder
    Case Study
    Chemicals and Materials

    Compare Licence

    ×
    Features License Type
    Single User Multiuser License Enterprise User
    Price $4,950 $5,950 $7,250
    Maximum User Access Limit 1 User Upto 10 Users Unrestricted Access Throughout the Organization
    Free Customization
    Direct Access to Analyst
    Deliverable Format
    Platform Access
    Discount on Next Purchase 10% 15% 15%
    Printable Versions