• Cat-intel
  • MedIntelliX
  • Resources
  • About Us
  • Request Free Sample ×

    Kindly complete the form below to receive a free sample of this Report

    Leading companies partner with us for data-driven Insights

    clients tt-cursor

    Liquefied Natural Gas Carrier Market

    ID: MRFR/CnM/24484-HCR
    111 Pages
    Chitranshi Jaiswal
    September 2025

    Liquefied Natural Gas (LNG) Carrier Market Research Report By Carrier Capacity (Small (less than 125,000 cubic meters), Medium (125,000 to 175,000 cubic meters), Large (over 175,000 cubic meters)), By Propulsion Type (Steam Turbine, Diesel Electric, Dual-Fuel, LNG-Fueled), By Containment System (Single Membrane, Double Membrane, Independent), By Trade Route (Inter-basin, Intra-basin, Short-distance) and By Regional (North America, Europe, South America, Asia-Pacific, Middle East and Africa) - Forecast to 2034

    Share:
    Download PDF ×

    We do not share your information with anyone. However, we may send you emails based on your report interest from time to time. You may contact us at any time to opt-out.

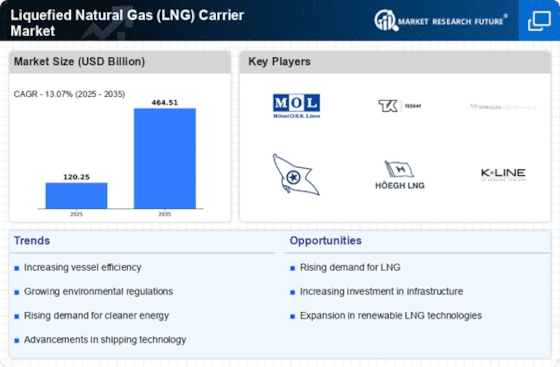
    Liquefied Natural Gas (LNG) Carrier Market Research Report — Global Forecast till 2034 Infographic
    Purchase Options
    $ 4,950.0
    $ 5,950
    $ 7,250.0
    Table of Contents

    Liquefied Natural Gas Carrier Market Summary

    The Global Liquefied Natural Gas (LNG) Carrier Market is poised for substantial growth, reaching an estimated value of 541.32 USD Billion by 2035.

    Key Market Trends & Highlights

    Liquefied Natural Gas (LNG) Carrier Key Trends and Highlights

    • The market is valued at 235.94 USD Billion in 2024 and is projected to grow to 541.32 USD Billion by 2035.
    • The compound annual growth rate (CAGR) for the period from 2025 to 2035 is estimated at 7.84%.
    • Increasing demand for cleaner energy sources is likely to drive the expansion of the LNG carrier market.
    • Growing adoption of LNG technology due to the rising need for energy security is a major market driver.

    Market Size & Forecast

    2024 Market Size 235.94 (USD Billion)
    2035 Market Size 541.32 (USD Billion)
    CAGR (2025 - 2035) 7.84%

    Major Players

    Apple Inc (US), Microsoft Corp (US), Amazon.com Inc (US), Alphabet Inc (US), Berkshire Hathaway Inc (US), Tesla Inc (US), Meta Platforms Inc (US), Johnson & Johnson (US), Visa Inc (US), Procter & Gamble Co (US)

    Liquefied Natural Gas Carrier Market Trends

    The Liquefied Natural Gas (LNG) Carrier Market is projected to witness substantial growth in the coming years, driven by the increasing demand for natural gas as a cleaner alternative fuel. The rising adoption of LNG as a marine fuel and the expansion of LNG infrastructure are contributing to the market's growth. Moreover, the growing demand for natural gas in emerging economies is fueling the need for specialized carriers to transport LNG safely and efficiently.

    The market is also witnessing a trend towards larger and more efficient LNG carriers, as well as the adoption of innovative technologies to enhance the efficiency and safety of LNG transportation.


    The global Liquefied Natural Gas (LNG) carrier market appears poised for robust growth, driven by increasing demand for cleaner energy sources and the strategic shift towards natural gas as a transitional fuel in various economies.

    U.S. Energy Information Administration (EIA)

    Liquefied Natural Gas Carrier Market Drivers

    Market Trends and Projections

    The Global Liquefied Natural Gas (LNG) Carrier Market Industry is characterized by various trends and projections that indicate its future trajectory. The market is anticipated to grow from a valuation of 235.94 USD Billion in 2024 to approximately 541.32 USD Billion by 2035, reflecting a robust CAGR of 7.84% from 2025 to 2035. This growth is underpinned by factors such as increasing demand for natural gas, technological advancements, and the expansion of LNG infrastructure. The market trends suggest a dynamic landscape where stakeholders must remain agile to adapt to evolving demands and geopolitical influences.

    Expansion of LNG Infrastructure

    The Global Liquefied Natural Gas (LNG) Carrier Market Industry is poised for growth due to the expansion of LNG infrastructure worldwide. Countries are investing heavily in LNG terminals, regasification facilities, and pipelines to support the increasing demand for natural gas. For instance, the development of new LNG terminals in the United States and Qatar enhances export capabilities, facilitating global trade. This infrastructure expansion not only supports existing markets but also opens new avenues for LNG distribution. As the market approaches an estimated value of 541.32 USD Billion by 2035, the infrastructure development is likely to play a crucial role in sustaining this growth trajectory.

    Increasing Demand for Natural Gas

    The Global Liquefied Natural Gas (LNG) Carrier Market Industry experiences a surge in demand for natural gas as countries transition towards cleaner energy sources. This shift is largely driven by the need to reduce greenhouse gas emissions and reliance on coal. For instance, nations in Asia, particularly China and India, are ramping up their imports of LNG to meet growing energy needs. In 2024, the market is valued at approximately 235.94 USD Billion, reflecting this increasing demand. The trend suggests that as more countries commit to environmental goals, the demand for LNG carriers will likely continue to rise, further propelling market growth.

    Geopolitical Factors Influencing LNG Trade

    The Global Liquefied Natural Gas (LNG) Carrier Market Industry is significantly influenced by geopolitical factors that affect LNG trade dynamics. Political stability in key producing regions, such as the Middle East and North America, plays a critical role in ensuring a steady supply of LNG. Additionally, trade agreements and tariffs can impact pricing and availability, influencing market strategies. For example, the recent shifts in energy policies among European nations have led to increased LNG imports from the United States, altering traditional trade routes. These geopolitical considerations are likely to shape the market landscape, creating both opportunities and challenges for LNG carriers.

    Technological Advancements in LNG Carriers

    The Global Liquefied Natural Gas (LNG) Carrier Market Industry benefits from ongoing technological advancements that enhance the efficiency and safety of LNG transportation. Innovations such as improved hull designs and advanced propulsion systems contribute to reduced fuel consumption and lower operational costs. For example, the introduction of membrane containment systems has significantly increased the capacity and reliability of LNG carriers. These advancements not only optimize performance but also align with the industry's sustainability goals. As a result, the market is projected to grow at a CAGR of 7.84% from 2025 to 2035, indicating a robust future driven by technological progress.

    Growing Investment in Renewable Energy Integration

    The Global Liquefied Natural Gas (LNG) Carrier Market Industry is witnessing a growing investment in the integration of LNG with renewable energy sources. As countries strive for energy diversification, LNG is increasingly viewed as a transitional fuel that complements renewable energy. Investments in hybrid systems that utilize both LNG and renewables are on the rise, particularly in regions with abundant natural resources. This trend not only enhances energy security but also supports the global shift towards sustainable energy solutions. The interplay between LNG and renewables is expected to drive market growth, as stakeholders recognize the potential of LNG carriers in facilitating this transition.

    Market Segment Insights

    Get more detailed insights about Liquefied Natural Gas (LNG) Carrier Market Research Report — Global Forecast till 2034

    Regional Insights

    The Liquefied Natural Gas (LNG) Carrier Market exhibits substantial regional differentiation, reflecting diverse growth trajectories. In 2023, North America led with a valuation of 28.5 USD Billion, indicating a majority holding in the market, driven by increasing domestic gas production and robust export facilities.

    Europe follows closely with a valuation of 25.0 USD Billion, highlighting significant investment in LNG infrastructure to enhance energy security. The Asia-Pacific region, valued at 22.55 USD Billion, showcases vibrant demand dynamics, primarily from countries seeking alternative energy sources, which further substantiates its growing influence. South America and the Middle East  Africa, with valuations of 10.0 USD Billion and 8.0 USD Billion, respectively, reflect emerging markets with developing LNG initiatives. South America is gradually cultivating its LNG potential, while Middle East  Africa is expected to see a rise in investment as energy demand escalates.

    Collectively, these dynamics reveal the complexity of the Liquefied Natural Gas (LNG) Carrier Market segmentation, with regional variations driven by local energy policies, infrastructure readiness, and international trade relationships.

    Liquefied Natural Gas (LNG) Carrier Market Regional

    Source: Primary Research, Secondary Research, Market Research Future Database and Analyst Review

    Key Players and Competitive Insights

    Liquefied Natural Gas (LNG) Carrier Market industry's major players are investing substantially in research and development to gain a competitive edge. Major players in the Liquefied Natural Gas (LNG) Carrier Market are concentrating on developing new technologies to increase the efficiency and safety of their vessels. In addition, they are expanding their geographical reach and exploring new markets to meet the growing demand for LNG. Overall, the Liquefied Natural Gas (LNG) Carrier Market is expected to grow over the forthcoming years on account of an increasing need for cleaner sources of energy and the expansion of the LNG infrastructure.

    In addition, mergers and acquisitions are also expected to help shape the Liquefied Natural Gas (LNG) Carrier Market's competitive landscape. Hyundai Heavy Industries is a major player in the Liquefied Natural Gas (LNG) Carrier Market that has a record of developing innovative and advanced technologies. Hyundai Heavy Industries has constructed a vast number of LNG carriers, including vessels with membrane-type insulation and Moss-type insulation systems. In addition, the company is investing in the development of advanced technologies, such as LNG-fueled propulsion engines and carbon capture and storage systems.

    Overall, Hyundai Heavy Industries's strong financial position and presence enable it to compete effectively in the Liquefied Natural Gas (LNG) Carrier Market. Daewoo Shipbuilding  Marine Engineering is a major player in the Liquefied Natural Gas (LNG) Carrier Market that has a record of developing advanced technologies. The company boasts a long history of shipbuilding and has delivered a substantial number of LNG carriers worldwide. In particular, Daewoo Shipbuilding  Marine Engineering is known for its advanced technologies used in the design and construction of LNG carriers. In addition, the company has a record of on-time delivery and high-quality construction.

    Moreover, Daewoo Shipbuilding  Marine Engineering is investing in new technologies, such as the development of an LNG-fueled mechanical propulsion engine and a ballast water treatment system. Overall, Daewoo Shipbuilding  Marine Engineering's strong financial position and presence enable it to effectively compete in the Liquefied Natural Gas (LNG) Carrier Market.

    Key Companies in the Liquefied Natural Gas Carrier Market market include

    Industry Developments

    The market growth is attributed to the increasing demand for LNG as a cleaner and more efficient fuel, particularly in the power generation and transportation sectors. The Asia-Pacific region is expected to dominate the market due to the growing LNG consumption in countries like China, India, and Japan. Moreover, the expansion of LNG infrastructure, including new terminals and pipelines, is further driving market growth. Recent developments include the commissioning of the world's largest LNG carrier, the "Hummingbird," capable of transporting 216,000 cubic meters of LNG.

    Additionally, the industry is exploring innovative technologies such as dual-fuel and battery-powered LNG carriers to reduce emissions and enhance operational efficiency.

    Future Outlook

    Liquefied Natural Gas Carrier Market Future Outlook

    The Global Liquefied Natural Gas (LNG) Carrier Market is projected to grow at a 7.84% CAGR from 2024 to 2035, driven by increasing demand for cleaner energy and expanding LNG infrastructure.

    New opportunities lie in:

    • Invest in advanced LNG carrier technologies to enhance fuel efficiency and reduce emissions.
    • Explore strategic partnerships with emerging LNG markets to secure long-term contracts.
    • Develop innovative financing models to support new LNG carrier construction projects.

    By 2035, the LNG Carrier Market is expected to be robust, reflecting substantial growth and innovation.

    Market Segmentation

    Liquefied Natural Gas (LNG) Carrier Market Regional Outlook

    • North America
    • Europe
    • South America
    • Asia-Pacific
    • Middle East and Africa

    Liquefied Natural Gas (LNG) Carrier Market Trade Route Outlook

    • Inter-basin
    • Intra-basin
    • Short-distance

    Liquefied Natural Gas (LNG) Carrier Market Propulsion Type Outlook

    • Steam Turbine
    • Diesel Electric
    • Dual-Fuel
    • LNG-Fueled

    Liquefied Natural Gas (LNG) Carrier Market Carrier Capacity Outlook

    • Small (less than 125,000 cubic meters)
    • Medium (125,000 to 175,000 cubic meters)
    • Large (over 175,000 cubic meters)

    Liquefied Natural Gas (LNG) Carrier Market Containment System Outlook

    • Single Membrane
    • Double Membrane
    • Independent

    Report Scope

    Report Attribute/Metric Details
    Market Size 2024 120.25(USD Billion)
    Market Size 2025 135.97(USD Billion)
    Market Size 2034 410.81(USD Billion)
    Compound Annual Growth Rate (CAGR) 13.10% (2025 - 2034)
    Report Coverage Revenue Forecast, Competitive Landscape, Growth Factors, and Trends
    Base Year 2024
    Market Forecast Period 2025 - 2034
    Historical Data 2020 - 2024
    Market Forecast Units USD Billion
    Key Companies Profiled GasLog, Dorian LPG, Golar LNG, Mitsui O.S.K. Lines, Kawasaki Kisen Kaisha, Exmar, Dynagas, Hoegh LNG, Flex LNG, Nippon Yusen Kabushiki Kaisha, Tsakos Energy Navigation, MOL LNG Transport, Maran Gas Maritime, China LNG Shipping, Teekay LNG
    Segments Covered Carrier Capacity, Propulsion Type, Containment System, Trade Route, Regional
    Key Market Opportunities Growing LNG trade Technological advancements Environmental regulations Expansion of LNG infrastructure  Increasing demand for cleaner fuels
    Key Market Dynamics Growing LNG trade Technological advancements Increasing demand for cleaner fuels Government regulations Infrastructure expansion
    Countries Covered North America, Europe, APAC, South America, MEA

    Market Highlights

    Author
    Chitranshi Jaiswal
    Research Analyst Level I

    In her 3 years of experience in the market research field, she has handled critical cross-domain projects. She has an in-depth knowledge of market estimation & analysis, problem-solving, primary as well as secondary research, and team management.She holds an engineering degree and is an MBA professional from a well-known university, capable of evaluating the market and competitive conditions. An exceptional strategist with excellent communication skills and a passion for delivering cutting-edge & practical insights for the market. Proficient in multi-tasking, and can successfully deal with competing demands, while maintaining complete confidentiality. Generated business through active client and project development, networking, and high-quality responses. Her knowledge and skills have helped in making solid business decisions, securing funding from investors, and avoiding business failures.

    Leave a Comment

    FAQs

    What is the expected market size of the Liquefied Natural Gas (LNG) Carrier Market in 2034?

    The Liquefied Natural Gas (LNG) Carrier Market is expected to reach a market size of 410.81 USD Billion by the year 2034.

    What is the projected Compound Annual Growth Rate (CAGR) for the Liquefied Natural Gas (LNG) Carrier Market from 2025 to 2034?

    The expected CAGR for the Liquefied Natural Gas (LNG) Carrier Market is 13.10% during the period from 2025 to 2034.

    Which region is expected to dominate the Liquefied Natural Gas (LNG) Carrier Market by 2032?

    North America is expected to dominate the Liquefied Natural Gas (LNG) Carrier Market, reaching a valuation of 85.5 USD Billion by 2032.

    What is the market value of the Liquefied Natural Gas (LNG) Carrier Market in Europe for the year 2032?

    The market value of the Liquefied Natural Gas (LNG) Carrier Market in Europe is projected to be 74.0 USD Billion by the year 2032.

    Who are the key players in the Liquefied Natural Gas (LNG) Carrier Market?

    Key players in the Liquefied Natural Gas (LNG) Carrier Market include GasLog, Dorian LPG, and Golar LNG, among others.

    What is the expected market value for Medium-sized LNG carriers by 2032?

    Medium-sized LNG carriers are projected to reach a market value of 95.12 USD Billion by the year 2032.

    How much is the Small LNG carrier market expected to grow by 2032?

    The Small LNG carrier market is expected to grow to a value of 84.0 USD Billion by the year 2032.

    What are the anticipated market trends influencing the Liquefied Natural Gas (LNG) Carrier Market?

    Anticipated market trends include growing demand for LNG and advancements in carrier technology impacting the Liquefied Natural Gas (LNG) Carrier Market.

    What is the forecasted market value for the Asia-Pacific region by 2032?

    The forecasted market value for the Asia-Pacific region is expected to reach 67.5 USD Billion by the year 2032.

    What is the expected market value of Large LNG carriers in 2034?

    The market value of Large LNG carriers is expected to be 410.81 USD Billion by the year 2034.

    1. EXECUTIVE SUMMARY   
      1. Market Overview     
      2. Key Findings     
      3. Market Segmentation   
      4. Competitive Landscape     
      5. Challenges
    2. and Opportunities     
      1. Future Outlook     
    3. MARKET INTRODUCTION 
      1. Definition     
      2. Scope of the study 
        1. Research Objective         
    4. Assumption         
      1. Limitations   
    5. RESEARCH METHODOLOGY   
      1. Overview     
      2. Data Mining     
      3. Secondary Research     
      4. Primary Research   
        1. Primary Interviews and Information Gathering Process     
        2. Breakdown of Primary Respondents       
      5. Forecasting Model     
      6. Market Size
    6. Estimation   
      1. Bottom-Up Approach       
        1. Top-Down Approach           
      2. Data Triangulation     
      3. Validation   
    7. MARKET
    8. DYNAMICS   
      1. Overview     
      2. Drivers 
      3. Restraints     
      4. Opportunities 
    9. MARKET FACTOR ANALYSIS   
    10. Value chain Analysis     
      1. Porter's Five Forces Analysis 
        1. Bargaining Power of Suppliers         
        2. Bargaining Power of Buyers         
    11. Threat of New Entrants         
      1. Threat of Substitutes 
        1. Intensity of Rivalry     
      2. COVID-19 Impact Analysis   
    12. Market Impact Analysis         
      1. Regional Impact 
        1. Opportunity and Threat Analysis   
    13. LIQUEFIED NATURAL GAS LNG CARRIER MARKET, BY CARRIER CAPACITY (USD BILLION) 
      1. Small (less than 125,000 cubic meters)     
    14. Medium (125,000 to 175,000 cubic meters)     
      1. Large (over
    15. ,000 cubic meters)        
    16. LIQUEFIED NATURAL
    17. GAS LNG CARRIER MARKET, BY PROPULSION TYPE (USD BILLION)   
    18. Steam Turbine     
      1. Diesel Electric     
      2. Dual-Fuel     
      3. LNG-Fueled        
    19. LIQUEFIED NATURAL GAS LNG CARRIER MARKET, BY CONTAINMENT SYSTEM (USD BILLION) 
      1. Single Membrane     
      2. Double Membrane 
      3. Independent        
    20. LIQUEFIED
    21. NATURAL GAS LNG CARRIER MARKET, BY TRADE ROUTE (USD BILLION)   
    22. Inter-basin     
      1. Intra-basin     
    23. Short-distance        
    24. LIQUEFIED NATURAL GAS LNG
    25. CARRIER MARKET, BY REGIONAL (USD BILLION)   
      1. North America 
        1. US         
        2. Canada 
      2. Europe   
        1. Germany 
        2. UK         
        3. France         
        4. Russia   
        5. Italy         
    26. Spain         
      1. Rest of Europe   
      2. APAC   
        1. China 
        2. India         
        3. Japan         
        4. South Korea 
        5. Malaysia         
        6. Thailand         
        7. Indonesia 
        8. Rest of APAC       
      3. South America   
        1. Brazil   
        2. Mexico         
    27. Argentina         
      1. Rest of South America 
      2. MEA   
        1. GCC
    28. Countries         
      1. South Africa   
        1. Rest of MEA         
    29. COMPETITIVE LANDSCAPE   
      1. Overview     
      2. Competitive
    30. Analysis     
      1. Market share Analysis     
      2. Major Growth Strategy in the Liquefied Natural Gas LNG Carrier Market 
      3. Competitive Benchmarking     
    31. Leading Players in Terms of Number of Developments in the Liquefied Natural Gas
    32. LNG Carrier Market     
      1. Key developments and growth strategies 
        1. New Product Launch/Service Deployment       
        2. Merger & Acquisitions         
        3. Joint Ventures           
      2. Major
    33. Players Financial Matrix    
      1. Sales and Operating Income 
        1. Major Players R&D Expenditure. 2023 
    34. COMPANY PROFILES 
      1. GasLog   
        1. Financial Overview   
        2. Products Offered         
        3. Key Developments         
        4. SWOT Analysis 
        5. Key Strategies       
      2. Dorian LPG   
        1. Financial Overview 
        2. Products Offered       
        3. Key Developments         
    35. SWOT Analysis         
      1. Key Strategies 
      2. Golar LNG   
    36. Financial Overview         
      1. Products Offered 
        1. Key Developments       
        2. SWOT Analysis         
    37. Key Strategies           
      1. Mitsui O.S.K.
    38. Lines   
      1. Financial Overview         
        1. Products Offered         
        2. Key Developments 
        3. SWOT Analysis       
        4. Key Strategies           
    39. Kawasaki Kisen Kaisha   
      1. Financial Overview   
        1. Products Offered         
        2. Key Developments         
        3. SWOT Analysis 
        4. Key Strategies       
      2. Exmar   
        1. Financial Overview 
        2. Products Offered       
        3. Key Developments         
    40. SWOT Analysis         
      1. Key Strategies 
      2. Dynagas   
    41. Financial Overview         
      1. Products Offered 
        1. Key Developments       
        2. SWOT Analysis         
    42. Key Strategies           
      1. Hoegh LNG 
        1. Financial Overview         
    43. Products Offered         
      1. Key Developments 
        1. SWOT Analysis       
        2. Key Strategies           
    44. Flex LNG   
      1. Financial Overview       
        1. Products Offered         
    45. Key Developments         
      1. SWOT Analysis 
        1. Key Strategies       
      2. Nippon Yusen Kabushiki Kaisha   
    46. Financial Overview         
      1. Products Offered 
        1. Key Developments       
        2. SWOT Analysis         
    47. Key Strategies           
      1. Tsakos Energy
    48. Navigation   
      1. Financial Overview       
        1. Products Offered         
    49. Key Developments         
      1. SWOT Analysis 
        1. Key Strategies       
      2. MOL LNG Transport   
        1. Financial
    50. Overview         
      1. Products Offered 
        1. Key Developments       
        2. SWOT Analysis         
    51. Key Strategies           
      1. Maran Gas Maritime 
        1. Financial Overview         
    52. Products Offered         
      1. Key Developments 
        1. SWOT Analysis       
        2. Key Strategies           
      2. China LNG Shipping   
        1. Financial Overview 
        2. Products Offered       
        3. Key Developments         
    53. SWOT Analysis         
      1. Key Strategies 
      2. Teekay LNG   
    54. Financial Overview         
      1. Products Offered 
        1. Key Developments       
        2. SWOT Analysis         
    55. Key Strategies              
    56. APPENDIX 
      1. References     
      2. Related Reports 
    57. ASSUMPTIONS   
    58. MARKET SIZE ESTIMATES & FORECAST, BY CARRIER CAPACITY, 2025-2034 (USD BILLIONS) 
    59. ESTIMATES & FORECAST, BY PROPULSION TYPE, 2025-2034 (USD BILLIONS)   
    60. & FORECAST, BY CONTAINMENT SYSTEM, 2025-2034 (USD BILLIONS)   
    61. & FORECAST, BY TRADE ROUTE, 2025-2034 (USD BILLIONS)   
    62. NORTH AMERICA LIQUEFIED NATURAL GAS LNG CARRIER MARKET SIZE ESTIMATES & FORECAST,
    63. BY REGIONAL, 2025-2034 (USD BILLIONS)   
    64. GAS LNG CARRIER MARKET SIZE ESTIMATES & FORECAST, BY CARRIER CAPACITY, 2025-2034
    65. (USD BILLIONS)   
    66. SIZE ESTIMATES & FORECAST, BY PROPULSION TYPE, 2025-2034 (USD BILLIONS) 
    67. & FORECAST, BY CONTAINMENT SYSTEM, 2025-2034 (USD BILLIONS)   
    68. BY TRADE ROUTE, 2025-2034 (USD BILLIONS)   
    69. NATURAL GAS LNG CARRIER MARKET SIZE ESTIMATES & FORECAST, BY REGIONAL, 2025-2034
    70. (USD BILLIONS)   
    71. MARKET SIZE ESTIMATES & FORECAST, BY CARRIER CAPACITY, 2025-2034 (USD BILLIONS) 
    72. & FORECAST, BY PROPULSION TYPE, 2025-2034 (USD BILLIONS)   
    73. CANADA LIQUEFIED NATURAL GAS LNG CARRIER MARKET SIZE ESTIMATES & FORECAST,
    74. BY CONTAINMENT SYSTEM, 2025-2034 (USD BILLIONS)   
    75. LIQUEFIED NATURAL GAS LNG CARRIER MARKET SIZE ESTIMATES & FORECAST, BY TRADE
    76. ROUTE, 2025-2034 (USD BILLIONS)   
    77. GAS LNG CARRIER MARKET SIZE ESTIMATES & FORECAST, BY REGIONAL, 2025-2034 (USD
    78. BILLIONS)   
    79. SIZE ESTIMATES & FORECAST, BY CARRIER CAPACITY, 2025-2034 (USD BILLIONS) 
    80. & FORECAST, BY PROPULSION TYPE, 2025-2034 (USD BILLIONS)   
    81. EUROPE LIQUEFIED NATURAL GAS LNG CARRIER MARKET SIZE ESTIMATES & FORECAST,
    82. BY CONTAINMENT SYSTEM, 2025-2034 (USD BILLIONS)   
    83. LIQUEFIED NATURAL GAS LNG CARRIER MARKET SIZE ESTIMATES & FORECAST, BY TRADE
    84. ROUTE, 2025-2034 (USD BILLIONS)   
    85. GAS LNG CARRIER MARKET SIZE ESTIMATES & FORECAST, BY REGIONAL, 2025-2034 (USD
    86. BILLIONS)   
    87. MARKET SIZE ESTIMATES & FORECAST, BY CARRIER CAPACITY, 2025-2034 (USD BILLIONS) 
    88. & FORECAST, BY PROPULSION TYPE, 2025-2034 (USD BILLIONS)   
    89. GERMANY LIQUEFIED NATURAL GAS LNG CARRIER MARKET SIZE ESTIMATES & FORECAST,
    90. BY CONTAINMENT SYSTEM, 2025-2034 (USD BILLIONS)   
    91. LIQUEFIED NATURAL GAS LNG CARRIER MARKET SIZE ESTIMATES & FORECAST, BY TRADE
    92. ROUTE, 2025-2034 (USD BILLIONS)   
    93. GAS LNG CARRIER MARKET SIZE ESTIMATES & FORECAST, BY REGIONAL, 2025-2034 (USD
    94. BILLIONS)   
    95. SIZE ESTIMATES & FORECAST, BY CARRIER CAPACITY, 2025-2034 (USD BILLIONS) 
    96. & FORECAST, BY PROPULSION TYPE, 2025-2034 (USD BILLIONS)   
    97. UK LIQUEFIED NATURAL GAS LNG CARRIER MARKET SIZE ESTIMATES & FORECAST, BY
    98. CONTAINMENT SYSTEM, 2025-2034 (USD BILLIONS)   
    99. NATURAL GAS LNG CARRIER MARKET SIZE ESTIMATES & FORECAST, BY TRADE ROUTE, 2025-2034
    100. (USD BILLIONS)   
    101. MARKET SIZE ESTIMATES & FORECAST, BY REGIONAL, 2025-2034 (USD BILLIONS) 
    102. & FORECAST, BY CARRIER CAPACITY, 2025-2034 (USD BILLIONS)   
    103. FRANCE LIQUEFIED NATURAL GAS LNG CARRIER MARKET SIZE ESTIMATES & FORECAST,
    104. BY PROPULSION TYPE, 2025-2034 (USD BILLIONS)   
    105. LIQUEFIED NATURAL GAS LNG CARRIER MARKET SIZE ESTIMATES & FORECAST, BY CONTAINMENT
    106. SYSTEM, 2025-2034 (USD BILLIONS)   
    107. GAS LNG CARRIER MARKET SIZE ESTIMATES & FORECAST, BY TRADE ROUTE, 2025-2034
    108. (USD BILLIONS)   
    109. MARKET SIZE ESTIMATES & FORECAST, BY REGIONAL, 2025-2034 (USD BILLIONS) 
    110. & FORECAST, BY CARRIER CAPACITY, 2025-2034 (USD BILLIONS)   
    111. RUSSIA LIQUEFIED NATURAL GAS LNG CARRIER MARKET SIZE ESTIMATES & FORECAST,
    112. BY PROPULSION TYPE, 2025-2034 (USD BILLIONS)   
    113. LIQUEFIED NATURAL GAS LNG CARRIER MARKET SIZE ESTIMATES & FORECAST, BY CONTAINMENT
    114. SYSTEM, 2025-2034 (USD BILLIONS)   
    115. GAS LNG CARRIER MARKET SIZE ESTIMATES & FORECAST, BY TRADE ROUTE, 2025-2034
    116. (USD BILLIONS)   
    117. MARKET SIZE ESTIMATES & FORECAST, BY REGIONAL, 2025-2034 (USD BILLIONS) 
    118. & FORECAST, BY CARRIER CAPACITY, 2025-2034 (USD BILLIONS)   
    119. ITALY LIQUEFIED NATURAL GAS LNG CARRIER MARKET SIZE ESTIMATES & FORECAST,
    120. BY PROPULSION TYPE, 2025-2034 (USD BILLIONS)   
    121. NATURAL GAS LNG CARRIER MARKET SIZE ESTIMATES & FORECAST, BY CONTAINMENT SYSTEM,
    122. 2034 (USD BILLIONS)   
    123. LNG CARRIER MARKET SIZE ESTIMATES & FORECAST, BY TRADE ROUTE, 2025-2034 (USD
    124. BILLIONS)   
    125. SIZE ESTIMATES & FORECAST, BY REGIONAL, 2025-2034 (USD BILLIONS)   
    126. FORECAST, BY CARRIER CAPACITY, 2025-2034 (USD BILLIONS)   
    127. SPAIN LIQUEFIED NATURAL GAS LNG CARRIER MARKET SIZE ESTIMATES & FORECAST,
    128. BY PROPULSION TYPE, 2025-2034 (USD BILLIONS)   
    129. NATURAL GAS LNG CARRIER MARKET SIZE ESTIMATES & FORECAST, BY CONTAINMENT SYSTEM,
    130. 2034 (USD BILLIONS)   
    131. LNG CARRIER MARKET SIZE ESTIMATES & FORECAST, BY TRADE ROUTE, 2025-2034 (USD
    132. BILLIONS)   
    133. SIZE ESTIMATES & FORECAST, BY REGIONAL, 2025-2034 (USD BILLIONS)   
    134. & FORECAST, BY CARRIER CAPACITY, 2025-2034 (USD BILLIONS)   
    135. REST OF EUROPE LIQUEFIED NATURAL GAS LNG CARRIER MARKET SIZE ESTIMATES &
    136. FORECAST, BY PROPULSION TYPE, 2025-2034 (USD BILLIONS)   
    137. REST OF EUROPE LIQUEFIED NATURAL GAS LNG CARRIER MARKET SIZE ESTIMATES & FORECAST,
    138. BY CONTAINMENT SYSTEM, 2025-2034 (USD BILLIONS)   
    139. OF EUROPE LIQUEFIED NATURAL GAS LNG CARRIER MARKET SIZE ESTIMATES & FORECAST,
    140. BY TRADE ROUTE, 2025-2034 (USD BILLIONS)   
    141. LIQUEFIED NATURAL GAS LNG CARRIER MARKET SIZE ESTIMATES & FORECAST, BY REGIONAL,
    142. 2034 (USD BILLIONS)   
    143. LNG CARRIER MARKET SIZE ESTIMATES & FORECAST, BY CARRIER CAPACITY, 2025-2034
    144. (USD BILLIONS)   
    145. MARKET SIZE ESTIMATES & FORECAST, BY PROPULSION TYPE, 2025-2034 (USD BILLIONS) 
    146. & FORECAST, BY CONTAINMENT SYSTEM, 2025-2034 (USD BILLIONS)   
    147. BY TRADE ROUTE, 2025-2034 (USD BILLIONS)   
    148. NATURAL GAS LNG CARRIER MARKET SIZE ESTIMATES & FORECAST, BY REGIONAL, 2025-2034
    149. (USD BILLIONS)   
    150. MARKET SIZE ESTIMATES & FORECAST, BY CARRIER CAPACITY, 2025-2034 (USD BILLIONS) 
    151. & FORECAST, BY PROPULSION TYPE, 2025-2034 (USD BILLIONS)   
    152. CHINA LIQUEFIED NATURAL GAS LNG CARRIER MARKET SIZE ESTIMATES & FORECAST,
    153. BY CONTAINMENT SYSTEM, 2025-2034 (USD BILLIONS)   
    154. LIQUEFIED NATURAL GAS LNG CARRIER MARKET SIZE ESTIMATES & FORECAST, BY TRADE
    155. ROUTE, 2025-2034 (USD BILLIONS)   
    156. GAS LNG CARRIER MARKET SIZE ESTIMATES & FORECAST, BY REGIONAL, 2025-2034 (USD
    157. BILLIONS)   
    158. SIZE ESTIMATES & FORECAST, BY CARRIER CAPACITY, 2025-2034 (USD BILLIONS) 
    159. & FORECAST, BY PROPULSION TYPE, 2025-2034 (USD BILLIONS)   
    160. INDIA LIQUEFIED NATURAL GAS LNG CARRIER MARKET SIZE ESTIMATES & FORECAST,
    161. BY CONTAINMENT SYSTEM, 2025-2034 (USD BILLIONS)   
    162. LIQUEFIED NATURAL GAS LNG CARRIER MARKET SIZE ESTIMATES & FORECAST, BY TRADE
    163. ROUTE, 2025-2034 (USD BILLIONS)   
    164. GAS LNG CARRIER MARKET SIZE ESTIMATES & FORECAST, BY REGIONAL, 2025-2034 (USD
    165. BILLIONS)   
    166. SIZE ESTIMATES & FORECAST, BY CARRIER CAPACITY, 2025-2034 (USD BILLIONS) 
    167. & FORECAST, BY PROPULSION TYPE, 2025-2034 (USD BILLIONS)   
    168. JAPAN LIQUEFIED NATURAL GAS LNG CARRIER MARKET SIZE ESTIMATES & FORECAST,
    169. BY CONTAINMENT SYSTEM, 2025-2034 (USD BILLIONS)   
    170. LIQUEFIED NATURAL GAS LNG CARRIER MARKET SIZE ESTIMATES & FORECAST, BY TRADE
    171. ROUTE, 2025-2034 (USD BILLIONS)   
    172. GAS LNG CARRIER MARKET SIZE ESTIMATES & FORECAST, BY REGIONAL, 2025-2034 (USD
    173. BILLIONS)   
    174. MARKET SIZE ESTIMATES & FORECAST, BY CARRIER CAPACITY, 2025-2034 (USD BILLIONS) 
    175. ESTIMATES & FORECAST, BY PROPULSION TYPE, 2025-2034 (USD BILLIONS)   
    176. & FORECAST, BY CONTAINMENT SYSTEM, 2025-2034 (USD BILLIONS)   
    177. & FORECAST, BY TRADE ROUTE, 2025-2034 (USD BILLIONS)   
    178. SOUTH KOREA LIQUEFIED NATURAL GAS LNG CARRIER MARKET SIZE ESTIMATES & FORECAST,
    179. BY REGIONAL, 2025-2034 (USD BILLIONS)   
    180. NATURAL GAS LNG CARRIER MARKET SIZE ESTIMATES & FORECAST, BY CARRIER CAPACITY,
    181. 2034 (USD BILLIONS)   
    182. GAS LNG CARRIER MARKET SIZE ESTIMATES & FORECAST, BY PROPULSION TYPE, 2025-2034
    183. (USD BILLIONS)   
    184. MARKET SIZE ESTIMATES & FORECAST, BY CONTAINMENT SYSTEM, 2025-2034 (USD BILLIONS) 
    185. & FORECAST, BY TRADE ROUTE, 2025-2034 (USD BILLIONS)   
    186. MALAYSIA LIQUEFIED NATURAL GAS LNG CARRIER MARKET SIZE ESTIMATES & FORECAST,
    187. BY REGIONAL, 2025-2034 (USD BILLIONS)   
    188. NATURAL GAS LNG CARRIER MARKET SIZE ESTIMATES & FORECAST, BY CARRIER CAPACITY,
    189. 2034 (USD BILLIONS)   
    190. GAS LNG CARRIER MARKET SIZE ESTIMATES & FORECAST, BY PROPULSION TYPE, 2025-2034
    191. (USD BILLIONS)   
    192. MARKET SIZE ESTIMATES & FORECAST, BY CONTAINMENT SYSTEM, 2025-2034 (USD BILLIONS) 
    193. & FORECAST, BY TRADE ROUTE, 2025-2034 (USD BILLIONS)   
    194. THAILAND LIQUEFIED NATURAL GAS LNG CARRIER MARKET SIZE ESTIMATES & FORECAST,
    195. BY REGIONAL, 2025-2034 (USD BILLIONS)   
    196. NATURAL GAS LNG CARRIER MARKET SIZE ESTIMATES & FORECAST, BY CARRIER CAPACITY,
    197. 2034 (USD BILLIONS)   
    198. GAS LNG CARRIER MARKET SIZE ESTIMATES & FORECAST, BY PROPULSION TYPE, 2025-2034
    199. (USD BILLIONS)   
    200. MARKET SIZE ESTIMATES & FORECAST, BY CONTAINMENT SYSTEM, 2025-2034 (USD BILLIONS) 
    201. & FORECAST, BY TRADE ROUTE, 2025-2034 (USD BILLIONS)   
    202. INDONESIA LIQUEFIED NATURAL GAS LNG CARRIER MARKET SIZE ESTIMATES & FORECAST,
    203. BY REGIONAL, 2025-2034 (USD BILLIONS)   
    204. NATURAL GAS LNG CARRIER MARKET SIZE ESTIMATES & FORECAST, BY CARRIER CAPACITY,
    205. 2034 (USD BILLIONS)   
    206. GAS LNG CARRIER MARKET SIZE ESTIMATES & FORECAST, BY PROPULSION TYPE, 2025-2034
    207. (USD BILLIONS)   
    208. CARRIER MARKET SIZE ESTIMATES & FORECAST, BY CONTAINMENT SYSTEM, 2025-2034 (USD
    209. BILLIONS)   
    210. MARKET SIZE ESTIMATES & FORECAST, BY TRADE ROUTE, 2025-2034 (USD BILLIONS) 
    211. ESTIMATES & FORECAST, BY REGIONAL, 2025-2034 (USD BILLIONS)   
    212. & FORECAST, BY CARRIER CAPACITY, 2025-2034 (USD BILLIONS)   
    213. SOUTH AMERICA LIQUEFIED NATURAL GAS LNG CARRIER MARKET SIZE ESTIMATES &
    214. FORECAST, BY PROPULSION TYPE, 2025-2034 (USD BILLIONS)   
    215. SOUTH AMERICA LIQUEFIED NATURAL GAS LNG CARRIER MARKET SIZE ESTIMATES & FORECAST,
    216. BY CONTAINMENT SYSTEM, 2025-2034 (USD BILLIONS)   
    217. AMERICA LIQUEFIED NATURAL GAS LNG CARRIER MARKET SIZE ESTIMATES & FORECAST,
    218. BY TRADE ROUTE, 2025-2034 (USD BILLIONS)   
    219. LIQUEFIED NATURAL GAS LNG CARRIER MARKET SIZE ESTIMATES & FORECAST, BY REGIONAL,
    220. 2034 (USD BILLIONS)   
    221. LNG CARRIER MARKET SIZE ESTIMATES & FORECAST, BY CARRIER CAPACITY, 2025-2034
    222. (USD BILLIONS)   
    223. MARKET SIZE ESTIMATES & FORECAST, BY PROPULSION TYPE, 2025-2034 (USD BILLIONS) 
    224. & FORECAST, BY CONTAINMENT SYSTEM, 2025-2034 (USD BILLIONS)   
    225. FORECAST, BY TRADE ROUTE, 2025-2034 (USD BILLIONS)   
    226. BRAZIL LIQUEFIED NATURAL GAS LNG CARRIER MARKET SIZE ESTIMATES & FORECAST, BY
    227. REGIONAL, 2025-2034 (USD BILLIONS)   
    228. NATURAL GAS LNG CARRIER MARKET SIZE ESTIMATES & FORECAST, BY CARRIER CAPACITY,
    229. 2034 (USD BILLIONS)   
    230. LNG CARRIER MARKET SIZE ESTIMATES & FORECAST, BY PROPULSION TYPE, 2025-2034
    231. (USD BILLIONS)   
    232. MARKET SIZE ESTIMATES & FORECAST, BY CONTAINMENT SYSTEM, 2025-2034 (USD BILLIONS) 
    233. & FORECAST, BY TRADE ROUTE, 2025-2034 (USD BILLIONS)   
    234. MEXICO LIQUEFIED NATURAL GAS LNG CARRIER MARKET SIZE ESTIMATES & FORECAST,
    235. BY REGIONAL, 2025-2034 (USD BILLIONS)   
    236. NATURAL GAS LNG CARRIER MARKET SIZE ESTIMATES & FORECAST, BY CARRIER CAPACITY,
    237. 2034 (USD BILLIONS)   
    238. GAS LNG CARRIER MARKET SIZE ESTIMATES & FORECAST, BY PROPULSION TYPE, 2025-2034
    239. (USD BILLIONS)   
    240. CARRIER MARKET SIZE ESTIMATES & FORECAST, BY CONTAINMENT SYSTEM, 2025-2034 (USD
    241. BILLIONS)   
    242. MARKET SIZE ESTIMATES & FORECAST, BY TRADE ROUTE, 2025-2034 (USD BILLIONS) 
    243. & FORECAST, BY REGIONAL, 2025-2034 (USD BILLIONS)   
    244. REST OF SOUTH AMERICA LIQUEFIED NATURAL GAS LNG CARRIER MARKET SIZE ESTIMATES &
    245. FORECAST, BY CARRIER CAPACITY, 2025-2034 (USD BILLIONS)   
    246. REST OF SOUTH AMERICA LIQUEFIED NATURAL GAS LNG CARRIER MARKET SIZE ESTIMATES
    247. & FORECAST, BY PROPULSION TYPE, 2025-2034 (USD BILLIONS)   
    248. REST OF SOUTH AMERICA LIQUEFIED NATURAL GAS LNG CARRIER MARKET SIZE ESTIMATES
    249. & FORECAST, BY CONTAINMENT SYSTEM, 2025-2034 (USD BILLIONS)   
    250. ESTIMATES & FORECAST, BY TRADE ROUTE, 2025-2034 (USD BILLIONS)   
    251. ESTIMATES & FORECAST, BY REGIONAL, 2025-2034 (USD BILLIONS)   
    252. BY CARRIER CAPACITY, 2025-2034 (USD BILLIONS)   
    253. NATURAL GAS LNG CARRIER MARKET SIZE ESTIMATES & FORECAST, BY PROPULSION TYPE,
    254. 2034 (USD BILLIONS)   
    255. LNG CARRIER MARKET SIZE ESTIMATES & FORECAST, BY CONTAINMENT SYSTEM, 2025-2034
    256. (USD BILLIONS)   
    257. MARKET SIZE ESTIMATES & FORECAST, BY TRADE ROUTE, 2025-2034 (USD BILLIONS) 
    258. & FORECAST, BY REGIONAL, 2025-2034 (USD BILLIONS)   
    259. GCC COUNTRIES LIQUEFIED NATURAL GAS LNG CARRIER MARKET SIZE ESTIMATES & FORECAST,
    260. BY CARRIER CAPACITY, 2025-2034 (USD BILLIONS)   
    261. LIQUEFIED NATURAL GAS LNG CARRIER MARKET SIZE ESTIMATES & FORECAST, BY PROPULSION
    262. TYPE, 2025-2034 (USD BILLIONS)   
    263. NATURAL GAS LNG CARRIER MARKET SIZE ESTIMATES & FORECAST, BY CONTAINMENT SYSTEM,
    264. 2034 (USD BILLIONS)   
    265. GAS LNG CARRIER MARKET SIZE ESTIMATES & FORECAST, BY TRADE ROUTE, 2025-2034
    266. (USD BILLIONS)   
    267. LNG CARRIER MARKET SIZE ESTIMATES & FORECAST, BY REGIONAL, 2025-2034 (USD BILLIONS) 
    268. ESTIMATES & FORECAST, BY CARRIER CAPACITY, 2025-2034 (USD BILLIONS)   
    269. & FORECAST, BY PROPULSION TYPE, 2025-2034 (USD BILLIONS)   
    270. SOUTH AFRICA LIQUEFIED NATURAL GAS LNG CARRIER MARKET SIZE ESTIMATES &
    271. FORECAST, BY CONTAINMENT SYSTEM, 2025-2034 (USD BILLIONS)   
    272. SOUTH AFRICA LIQUEFIED NATURAL GAS LNG CARRIER MARKET SIZE ESTIMATES &
    273. FORECAST, BY TRADE ROUTE, 2025-2034 (USD BILLIONS)   
    274. SOUTH AFRICA LIQUEFIED NATURAL GAS LNG CARRIER MARKET SIZE ESTIMATES & FORECAST,
    275. BY REGIONAL, 2025-2034 (USD BILLIONS)   
    276. NATURAL GAS LNG CARRIER MARKET SIZE ESTIMATES & FORECAST, BY CARRIER CAPACITY,
    277. 2034 (USD BILLIONS)   
    278. GAS LNG CARRIER MARKET SIZE ESTIMATES & FORECAST, BY PROPULSION TYPE, 2025-2034
    279. (USD BILLIONS)   
    280. CARRIER MARKET SIZE ESTIMATES & FORECAST, BY CONTAINMENT SYSTEM, 2025-2034 (USD
    281. BILLIONS)   
    282. MARKET SIZE ESTIMATES & FORECAST, BY TRADE ROUTE, 2025-2034 (USD BILLIONS) 
    283. ESTIMATES & FORECAST, BY REGIONAL, 2025-2034 (USD BILLIONS)   
    284. ACQUISITION/PARTNERSHIP   
    285. NATURAL GAS LNG CARRIER MARKET ANALYSIS 
    286. GAS LNG CARRIER MARKET ANALYSIS BY CARRIER CAPACITY 
    287. NATURAL GAS LNG CARRIER MARKET ANALYSIS BY PROPULSION TYPE 
    288. US LIQUEFIED NATURAL GAS LNG CARRIER MARKET ANALYSIS BY CONTAINMENT SYSTEM 
    289. CAPACITY 
    290. BY PROPULSION TYPE 
    291. MARKET ANALYSIS BY CONTAINMENT SYSTEM 
    292. GAS LNG CARRIER MARKET ANALYSIS BY TRADE ROUTE 
    293. NATURAL GAS LNG CARRIER MARKET ANALYSIS BY REGIONAL 
    294. LIQUEFIED NATURAL GAS LNG CARRIER MARKET ANALYSIS 
    295. LIQUEFIED NATURAL GAS LNG CARRIER MARKET ANALYSIS BY CARRIER CAPACITY 
    296. GERMANY LIQUEFIED NATURAL GAS LNG CARRIER MARKET ANALYSIS BY PROPULSION TYPE 
    297. SYSTEM 
    298. BY TRADE ROUTE 
    299. ANALYSIS BY REGIONAL 
    300. MARKET ANALYSIS BY CARRIER CAPACITY 
    301. LNG CARRIER MARKET ANALYSIS BY PROPULSION TYPE 
    302. NATURAL GAS LNG CARRIER MARKET ANALYSIS BY CONTAINMENT SYSTEM 
    303. UK LIQUEFIED NATURAL GAS LNG CARRIER MARKET ANALYSIS BY TRADE ROUTE 
    304. CAPACITY 
    305. BY PROPULSION TYPE 
    306. MARKET ANALYSIS BY CONTAINMENT SYSTEM 
    307. GAS LNG CARRIER MARKET ANALYSIS BY TRADE ROUTE 
    308. NATURAL GAS LNG CARRIER MARKET ANALYSIS BY REGIONAL 
    309. LIQUEFIED NATURAL GAS LNG CARRIER MARKET ANALYSIS BY CARRIER CAPACITY 
    310. RUSSIA LIQUEFIED NATURAL GAS LNG CARRIER MARKET ANALYSIS BY PROPULSION TYPE 
    311. SYSTEM 
    312. BY TRADE ROUTE 
    313. ANALYSIS BY REGIONAL 
    314. MARKET ANALYSIS BY CARRIER CAPACITY 
    315. GAS LNG CARRIER MARKET ANALYSIS BY PROPULSION TYPE 
    316. NATURAL GAS LNG CARRIER MARKET ANALYSIS BY CONTAINMENT SYSTEM 
    317. ITALY LIQUEFIED NATURAL GAS LNG CARRIER MARKET ANALYSIS BY TRADE ROUTE 
    318. CAPACITY 
    319. BY PROPULSION TYPE 
    320. MARKET ANALYSIS BY CONTAINMENT SYSTEM 
    321. GAS LNG CARRIER MARKET ANALYSIS BY TRADE ROUTE 
    322. NATURAL GAS LNG CARRIER MARKET ANALYSIS BY REGIONAL 
    323. EUROPE LIQUEFIED NATURAL GAS LNG CARRIER MARKET ANALYSIS BY CARRIER CAPACITY 
    324. PROPULSION TYPE 
    325. MARKET ANALYSIS BY CONTAINMENT SYSTEM 
    326. NATURAL GAS LNG CARRIER MARKET ANALYSIS BY TRADE ROUTE 
    327. OF EUROPE LIQUEFIED NATURAL GAS LNG CARRIER MARKET ANALYSIS BY REGIONAL 
    328. CHINA LIQUEFIED NATURAL GAS LNG CARRIER MARKET ANALYSIS BY CARRIER CAPACITY 
    329. TYPE 
    330. BY CONTAINMENT SYSTEM 
    331. MARKET ANALYSIS BY TRADE ROUTE 
    332. LNG CARRIER MARKET ANALYSIS BY REGIONAL 
    333. GAS LNG CARRIER MARKET ANALYSIS BY CARRIER CAPACITY 
    334. LIQUEFIED NATURAL GAS LNG CARRIER MARKET ANALYSIS BY PROPULSION TYPE 
    335. INDIA LIQUEFIED NATURAL GAS LNG CARRIER MARKET ANALYSIS BY CONTAINMENT SYSTEM 
    336. CAPACITY 
    337. BY PROPULSION TYPE 
    338. MARKET ANALYSIS BY CONTAINMENT SYSTEM 
    339. GAS LNG CARRIER MARKET ANALYSIS BY TRADE ROUTE 
    340. NATURAL GAS LNG CARRIER MARKET ANALYSIS BY REGIONAL 
    341. KOREA LIQUEFIED NATURAL GAS LNG CARRIER MARKET ANALYSIS BY CARRIER CAPACITY 
    342. TYPE 
    343. ANALYSIS BY CONTAINMENT SYSTEM 
    344. GAS LNG CARRIER MARKET ANALYSIS BY TRADE ROUTE 
    345. LIQUEFIED NATURAL GAS LNG CARRIER MARKET ANALYSIS BY REGIONAL 
    346. MALAYSIA LIQUEFIED NATURAL GAS LNG CARRIER MARKET ANALYSIS BY CARRIER CAPACITY 
    347. TYPE 
    348. BY CONTAINMENT SYSTEM 
    349. MARKET ANALYSIS BY TRADE ROUTE 
    350. GAS LNG CARRIER MARKET ANALYSIS BY REGIONAL 
    351. NATURAL GAS LNG CARRIER MARKET ANALYSIS BY CARRIER CAPACITY 
    352. THAILAND LIQUEFIED NATURAL GAS LNG CARRIER MARKET ANALYSIS BY PROPULSION TYPE 
    353. SYSTEM 
    354. BY TRADE ROUTE 
    355. MARKET ANALYSIS BY REGIONAL 
    356. LNG CARRIER MARKET ANALYSIS BY CARRIER CAPACITY 
    357. LIQUEFIED NATURAL GAS LNG CARRIER MARKET ANALYSIS BY PROPULSION TYPE 
    358. INDONESIA LIQUEFIED NATURAL GAS LNG CARRIER MARKET ANALYSIS BY CONTAINMENT SYSTEM 
    359. ROUTE 
    360. BY REGIONAL 
    361. MARKET ANALYSIS BY CARRIER CAPACITY 
    362. NATURAL GAS LNG CARRIER MARKET ANALYSIS BY PROPULSION TYPE 
    363. REST OF APAC LIQUEFIED NATURAL GAS LNG CARRIER MARKET ANALYSIS BY CONTAINMENT SYSTEM 
    364. ROUTE 
    365. ANALYSIS BY REGIONAL 
    366. CARRIER MARKET ANALYSIS 
    367. MARKET ANALYSIS BY CARRIER CAPACITY 
    368. GAS LNG CARRIER MARKET ANALYSIS BY PROPULSION TYPE 
    369. LIQUEFIED NATURAL GAS LNG CARRIER MARKET ANALYSIS BY CONTAINMENT SYSTEM 
    370. CAPACITY 
    371. BY PROPULSION TYPE 
    372. MARKET ANALYSIS BY CONTAINMENT SYSTEM 
    373. GAS LNG CARRIER MARKET ANALYSIS BY TRADE ROUTE 
    374. NATURAL GAS LNG CARRIER MARKET ANALYSIS BY REGIONAL 
    375. LIQUEFIED NATURAL GAS LNG CARRIER MARKET ANALYSIS BY CARRIER CAPACITY 
    376. ARGENTINA LIQUEFIED NATURAL GAS LNG CARRIER MARKET ANALYSIS BY PROPULSION TYPE 
    377. SYSTEM 
    378. ANALYSIS BY TRADE ROUTE 
    379. CARRIER MARKET ANALYSIS BY REGIONAL 
    380. LIQUEFIED NATURAL GAS LNG CARRIER MARKET ANALYSIS BY CARRIER CAPACITY 
    381. REST OF SOUTH AMERICA LIQUEFIED NATURAL GAS LNG CARRIER MARKET ANALYSIS BY
    382. PROPULSION TYPE 
    383. LNG CARRIER MARKET ANALYSIS BY CONTAINMENT SYSTEM 
    384. SOUTH AMERICA LIQUEFIED NATURAL GAS LNG CARRIER MARKET ANALYSIS BY TRADE ROUTE 
    385. BY REGIONAL 
    386. ANALYSIS 
    387. MARKET ANALYSIS BY CARRIER CAPACITY 
    388. NATURAL GAS LNG CARRIER MARKET ANALYSIS BY PROPULSION TYPE 
    389. GCC COUNTRIES LIQUEFIED NATURAL GAS LNG CARRIER MARKET ANALYSIS BY CONTAINMENT SYSTEM 
    390. TRADE ROUTE 
    391. MARKET ANALYSIS BY REGIONAL 
    392. GAS LNG CARRIER MARKET ANALYSIS BY CARRIER CAPACITY 
    393. AFRICA LIQUEFIED NATURAL GAS LNG CARRIER MARKET ANALYSIS BY PROPULSION TYPE 
    394. CONTAINMENT SYSTEM 
    395. CARRIER MARKET ANALYSIS BY TRADE ROUTE 
    396. NATURAL GAS LNG CARRIER MARKET ANALYSIS BY REGIONAL 
    397. OF MEA LIQUEFIED NATURAL GAS LNG CARRIER MARKET ANALYSIS BY CARRIER CAPACITY 
    398. TYPE 
    399. ANALYSIS BY CONTAINMENT SYSTEM 
    400. GAS LNG CARRIER MARKET ANALYSIS BY TRADE ROUTE 
    401. LIQUEFIED NATURAL GAS LNG CARRIER MARKET ANALYSIS BY REGIONAL 
    402. KEY BUYING CRITERIA OF LIQUEFIED NATURAL GAS LNG CARRIER MARKET 
    403. RESEARCH PROCESS OF MRFR 
    404. GAS LNG CARRIER MARKET 
    405. NATURAL GAS LNG CARRIER MARKET 
    406. LIQUEFIED NATURAL GAS LNG CARRIER MARKET 
    407. LIQUEFIED NATURAL GAS LNG CARRIER MARKET 
    408. GAS LNG CARRIER MARKET, BY CARRIER CAPACITY, 2024 (% SHARE) 
    409. LIQUEFIED NATURAL GAS LNG CARRIER MARKET, BY CARRIER CAPACITY, 2025-2034 (USD Billions) 
    410. (% SHARE) 
    411. TYPE, 2025-2034 (USD Billions) 
    412. CARRIER MARKET, BY CONTAINMENT SYSTEM, 2024 (% SHARE) 
    413. NATURAL GAS LNG CARRIER MARKET, BY CONTAINMENT SYSTEM, 2025-2034 (USD Billions) 
    414. SHARE) 
    415. ROUTE, 2025-2034 (USD Billions) 
    416. CARRIER MARKET, BY REGIONAL, 2024 (% SHARE) 
    417. GAS LNG CARRIER MARKET, BY REGIONAL, 2025-2034 (USD Billions) 
    418. BENCHMARKING OF MAJOR COMPETITORS 

    Liquefied Natural Gas LNG Carrier Market Segmentation


    • Liquefied Natural Gas LNG Carrier Market By Carrier Capacity (USD Billion, 2019-2032)

      • Small (less than 125,000 cubic meters)
      • Medium (125,000 to 175,000 cubic meters)
      • Large (over 175,000 cubic meters)


    • Liquefied Natural Gas LNG Carrier Market By Propulsion Type (USD Billion, 2019-2032)

      • Steam Turbine
      • Diesel Electric
      • Dual-Fuel
      • LNG-Fueled


    • Liquefied Natural Gas LNG Carrier Market By Containment System (USD Billion, 2019-2032)

      • Single Membrane
      • Double Membrane
      • Independent


    • Liquefied Natural Gas LNG Carrier Market By Trade Route (USD Billion, 2019-2032)

      • Inter-basin
      • Intra-basin
      • Short-distance


    • Liquefied Natural Gas LNG Carrier Market By Regional (USD Billion, 2019-2032)

      • North America
      • Europe
      • South America
      • Asia Pacific
      • Middle East and Africa


    Liquefied Natural Gas LNG Carrier Market Regional Outlook (USD Billion, 2019-2032)


    • North America Outlook (USD Billion, 2019-2032)

      • North America Liquefied Natural Gas LNG Carrier Market by Carrier Capacity Type

        • Small (less than 125,000 cubic meters)
        • Medium (125,000 to 175,000 cubic meters)
        • Large (over 175,000 cubic meters)
      • North America Liquefied Natural Gas LNG Carrier Market by Propulsion Type

        • Steam Turbine
        • Diesel Electric
        • Dual-Fuel
        • LNG-Fueled
      • North America Liquefied Natural Gas LNG Carrier Market by Containment System Type

        • Single Membrane
        • Double Membrane
        • Independent
      • North America Liquefied Natural Gas LNG Carrier Market by Trade Route Type

        • Inter-basin
        • Intra-basin
        • Short-distance
      • North America Liquefied Natural Gas LNG Carrier Market by Regional Type

        • US
        • Canada
      • US Outlook (USD Billion, 2019-2032)
      • US Liquefied Natural Gas LNG Carrier Market by Carrier Capacity Type

        • Small (less than 125,000 cubic meters)
        • Medium (125,000 to 175,000 cubic meters)
        • Large (over 175,000 cubic meters)
      • US Liquefied Natural Gas LNG Carrier Market by Propulsion Type

        • Steam Turbine
        • Diesel Electric
        • Dual-Fuel
        • LNG-Fueled
      • US Liquefied Natural Gas LNG Carrier Market by Containment System Type

        • Single Membrane
        • Double Membrane
        • Independent
      • US Liquefied Natural Gas LNG Carrier Market by Trade Route Type

        • Inter-basin
        • Intra-basin
        • Short-distance
      • CANADA Outlook (USD Billion, 2019-2032)
      • CANADA Liquefied Natural Gas LNG Carrier Market by Carrier Capacity Type

        • Small (less than 125,000 cubic meters)
        • Medium (125,000 to 175,000 cubic meters)
        • Large (over 175,000 cubic meters)
      • CANADA Liquefied Natural Gas LNG Carrier Market by Propulsion Type

        • Steam Turbine
        • Diesel Electric
        • Dual-Fuel
        • LNG-Fueled
      • CANADA Liquefied Natural Gas LNG Carrier Market by Containment System Type

        • Single Membrane
        • Double Membrane
        • Independent
      • CANADA Liquefied Natural Gas LNG Carrier Market by Trade Route Type

        • Inter-basin
        • Intra-basin
        • Short-distance
    • Europe Outlook (USD Billion, 2019-2032)

      • Europe Liquefied Natural Gas LNG Carrier Market by Carrier Capacity Type

        • Small (less than 125,000 cubic meters)
        • Medium (125,000 to 175,000 cubic meters)
        • Large (over 175,000 cubic meters)
      • Europe Liquefied Natural Gas LNG Carrier Market by Propulsion Type

        • Steam Turbine
        • Diesel Electric
        • Dual-Fuel
        • LNG-Fueled
      • Europe Liquefied Natural Gas LNG Carrier Market by Containment System Type

        • Single Membrane
        • Double Membrane
        • Independent
      • Europe Liquefied Natural Gas LNG Carrier Market by Trade Route Type

        • Inter-basin
        • Intra-basin
        • Short-distance
      • Europe Liquefied Natural Gas LNG Carrier Market by Regional Type

        • Germany
        • UK
        • France
        • Russia
        • Italy
        • Spain
        • Rest of Europe
      • GERMANY Outlook (USD Billion, 2019-2032)
      • GERMANY Liquefied Natural Gas LNG Carrier Market by Carrier Capacity Type

        • Small (less than 125,000 cubic meters)
        • Medium (125,000 to 175,000 cubic meters)
        • Large (over 175,000 cubic meters)
      • GERMANY Liquefied Natural Gas LNG Carrier Market by Propulsion Type

        • Steam Turbine
        • Diesel Electric
        • Dual-Fuel
        • LNG-Fueled
      • GERMANY Liquefied Natural Gas LNG Carrier Market by Containment System Type

        • Single Membrane
        • Double Membrane
        • Independent
      • GERMANY Liquefied Natural Gas LNG Carrier Market by Trade Route Type

        • Inter-basin
        • Intra-basin
        • Short-distance
      • UK Outlook (USD Billion, 2019-2032)
      • UK Liquefied Natural Gas LNG Carrier Market by Carrier Capacity Type

        • Small (less than 125,000 cubic meters)
        • Medium (125,000 to 175,000 cubic meters)
        • Large (over 175,000 cubic meters)
      • UK Liquefied Natural Gas LNG Carrier Market by Propulsion Type

        • Steam Turbine
        • Diesel Electric
        • Dual-Fuel
        • LNG-Fueled
      • UK Liquefied Natural Gas LNG Carrier Market by Containment System Type

        • Single Membrane
        • Double Membrane
        • Independent
      • UK Liquefied Natural Gas LNG Carrier Market by Trade Route Type

        • Inter-basin
        • Intra-basin
        • Short-distance
      • FRANCE Outlook (USD Billion, 2019-2032)
      • FRANCE Liquefied Natural Gas LNG Carrier Market by Carrier Capacity Type

        • Small (less than 125,000 cubic meters)
        • Medium (125,000 to 175,000 cubic meters)
        • Large (over 175,000 cubic meters)
      • FRANCE Liquefied Natural Gas LNG Carrier Market by Propulsion Type

        • Steam Turbine
        • Diesel Electric
        • Dual-Fuel
        • LNG-Fueled
      • FRANCE Liquefied Natural Gas LNG Carrier Market by Containment System Type

        • Single Membrane
        • Double Membrane
        • Independent
      • FRANCE Liquefied Natural Gas LNG Carrier Market by Trade Route Type

        • Inter-basin
        • Intra-basin
        • Short-distance
      • RUSSIA Outlook (USD Billion, 2019-2032)
      • RUSSIA Liquefied Natural Gas LNG Carrier Market by Carrier Capacity Type

        • Small (less than 125,000 cubic meters)
        • Medium (125,000 to 175,000 cubic meters)
        • Large (over 175,000 cubic meters)
      • RUSSIA Liquefied Natural Gas LNG Carrier Market by Propulsion Type

        • Steam Turbine
        • Diesel Electric
        • Dual-Fuel
        • LNG-Fueled
      • RUSSIA Liquefied Natural Gas LNG Carrier Market by Containment System Type

        • Single Membrane
        • Double Membrane
        • Independent
      • RUSSIA Liquefied Natural Gas LNG Carrier Market by Trade Route Type

        • Inter-basin
        • Intra-basin
        • Short-distance
      • ITALY Outlook (USD Billion, 2019-2032)
      • ITALY Liquefied Natural Gas LNG Carrier Market by Carrier Capacity Type

        • Small (less than 125,000 cubic meters)
        • Medium (125,000 to 175,000 cubic meters)
        • Large (over 175,000 cubic meters)
      • ITALY Liquefied Natural Gas LNG Carrier Market by Propulsion Type

        • Steam Turbine
        • Diesel Electric
        • Dual-Fuel
        • LNG-Fueled
      • ITALY Liquefied Natural Gas LNG Carrier Market by Containment System Type

        • Single Membrane
        • Double Membrane
        • Independent
      • ITALY Liquefied Natural Gas LNG Carrier Market by Trade Route Type

        • Inter-basin
        • Intra-basin
        • Short-distance
      • SPAIN Outlook (USD Billion, 2019-2032)
      • SPAIN Liquefied Natural Gas LNG Carrier Market by Carrier Capacity Type

        • Small (less than 125,000 cubic meters)
        • Medium (125,000 to 175,000 cubic meters)
        • Large (over 175,000 cubic meters)
      • SPAIN Liquefied Natural Gas LNG Carrier Market by Propulsion Type

        • Steam Turbine
        • Diesel Electric
        • Dual-Fuel
        • LNG-Fueled
      • SPAIN Liquefied Natural Gas LNG Carrier Market by Containment System Type

        • Single Membrane
        • Double Membrane
        • Independent
      • SPAIN Liquefied Natural Gas LNG Carrier Market by Trade Route Type

        • Inter-basin
        • Intra-basin
        • Short-distance
      • REST OF EUROPE Outlook (USD Billion, 2019-2032)
      • REST OF EUROPE Liquefied Natural Gas LNG Carrier Market by Carrier Capacity Type

        • Small (less than 125,000 cubic meters)
        • Medium (125,000 to 175,000 cubic meters)
        • Large (over 175,000 cubic meters)
      • REST OF EUROPE Liquefied Natural Gas LNG Carrier Market by Propulsion Type

        • Steam Turbine
        • Diesel Electric
        • Dual-Fuel
        • LNG-Fueled
      • REST OF EUROPE Liquefied Natural Gas LNG Carrier Market by Containment System Type

        • Single Membrane
        • Double Membrane
        • Independent
      • REST OF EUROPE Liquefied Natural Gas LNG Carrier Market by Trade Route Type

        • Inter-basin
        • Intra-basin
        • Short-distance
    • APAC Outlook (USD Billion, 2019-2032)

      • APAC Liquefied Natural Gas LNG Carrier Market by Carrier Capacity Type

        • Small (less than 125,000 cubic meters)
        • Medium (125,000 to 175,000 cubic meters)
        • Large (over 175,000 cubic meters)
      • APAC Liquefied Natural Gas LNG Carrier Market by Propulsion Type

        • Steam Turbine
        • Diesel Electric
        • Dual-Fuel
        • LNG-Fueled
      • APAC Liquefied Natural Gas LNG Carrier Market by Containment System Type

        • Single Membrane
        • Double Membrane
        • Independent
      • APAC Liquefied Natural Gas LNG Carrier Market by Trade Route Type

        • Inter-basin
        • Intra-basin
        • Short-distance
      • APAC Liquefied Natural Gas LNG Carrier Market by Regional Type

        • China
        • India
        • Japan
        • South Korea
        • Malaysia
        • Thailand
        • Indonesia
        • Rest of APAC
      • CHINA Outlook (USD Billion, 2019-2032)
      • CHINA Liquefied Natural Gas LNG Carrier Market by Carrier Capacity Type

        • Small (less than 125,000 cubic meters)
        • Medium (125,000 to 175,000 cubic meters)
        • Large (over 175,000 cubic meters)
      • CHINA Liquefied Natural Gas LNG Carrier Market by Propulsion Type

        • Steam Turbine
        • Diesel Electric
        • Dual-Fuel
        • LNG-Fueled
      • CHINA Liquefied Natural Gas LNG Carrier Market by Containment System Type

        • Single Membrane
        • Double Membrane
        • Independent
      • CHINA Liquefied Natural Gas LNG Carrier Market by Trade Route Type

        • Inter-basin
        • Intra-basin
        • Short-distance
      • INDIA Outlook (USD Billion, 2019-2032)
      • INDIA Liquefied Natural Gas LNG Carrier Market by Carrier Capacity Type

        • Small (less than 125,000 cubic meters)
        • Medium (125,000 to 175,000 cubic meters)
        • Large (over 175,000 cubic meters)
      • INDIA Liquefied Natural Gas LNG Carrier Market by Propulsion Type

        • Steam Turbine
        • Diesel Electric
        • Dual-Fuel
        • LNG-Fueled
      • INDIA Liquefied Natural Gas LNG Carrier Market by Containment System Type

        • Single Membrane
        • Double Membrane
        • Independent
      • INDIA Liquefied Natural Gas LNG Carrier Market by Trade Route Type

        • Inter-basin
        • Intra-basin
        • Short-distance
      • JAPAN Outlook (USD Billion, 2019-2032)
      • JAPAN Liquefied Natural Gas LNG Carrier Market by Carrier Capacity Type

        • Small (less than 125,000 cubic meters)
        • Medium (125,000 to 175,000 cubic meters)
        • Large (over 175,000 cubic meters)
      • JAPAN Liquefied Natural Gas LNG Carrier Market by Propulsion Type

        • Steam Turbine
        • Diesel Electric
        • Dual-Fuel
        • LNG-Fueled
      • JAPAN Liquefied Natural Gas LNG Carrier Market by Containment System Type

        • Single Membrane
        • Double Membrane
        • Independent
      • JAPAN Liquefied Natural Gas LNG Carrier Market by Trade Route Type

        • Inter-basin
        • Intra-basin
        • Short-distance
      • SOUTH KOREA Outlook (USD Billion, 2019-2032)
      • SOUTH KOREA Liquefied Natural Gas LNG Carrier Market by Carrier Capacity Type

        • Small (less than 125,000 cubic meters)
        • Medium (125,000 to 175,000 cubic meters)
        • Large (over 175,000 cubic meters)
      • SOUTH KOREA Liquefied Natural Gas LNG Carrier Market by Propulsion Type

        • Steam Turbine
        • Diesel Electric
        • Dual-Fuel
        • LNG-Fueled
      • SOUTH KOREA Liquefied Natural Gas LNG Carrier Market by Containment System Type

        • Single Membrane
        • Double Membrane
        • Independent
      • SOUTH KOREA Liquefied Natural Gas LNG Carrier Market by Trade Route Type

        • Inter-basin
        • Intra-basin
        • Short-distance
      • MALAYSIA Outlook (USD Billion, 2019-2032)
      • MALAYSIA Liquefied Natural Gas LNG Carrier Market by Carrier Capacity Type

        • Small (less than 125,000 cubic meters)
        • Medium (125,000 to 175,000 cubic meters)
        • Large (over 175,000 cubic meters)
      • MALAYSIA Liquefied Natural Gas LNG Carrier Market by Propulsion Type

        • Steam Turbine
        • Diesel Electric
        • Dual-Fuel
        • LNG-Fueled
      • MALAYSIA Liquefied Natural Gas LNG Carrier Market by Containment System Type

        • Single Membrane
        • Double Membrane
        • Independent
      • MALAYSIA Liquefied Natural Gas LNG Carrier Market by Trade Route Type

        • Inter-basin
        • Intra-basin
        • Short-distance
      • THAILAND Outlook (USD Billion, 2019-2032)
      • THAILAND Liquefied Natural Gas LNG Carrier Market by Carrier Capacity Type

        • Small (less than 125,000 cubic meters)
        • Medium (125,000 to 175,000 cubic meters)
        • Large (over 175,000 cubic meters)
      • THAILAND Liquefied Natural Gas LNG Carrier Market by Propulsion Type

        • Steam Turbine
        • Diesel Electric
        • Dual-Fuel
        • LNG-Fueled
      • THAILAND Liquefied Natural Gas LNG Carrier Market by Containment System Type

        • Single Membrane
        • Double Membrane
        • Independent
      • THAILAND Liquefied Natural Gas LNG Carrier Market by Trade Route Type

        • Inter-basin
        • Intra-basin
        • Short-distance
      • INDONESIA Outlook (USD Billion, 2019-2032)
      • INDONESIA Liquefied Natural Gas LNG Carrier Market by Carrier Capacity Type

        • Small (less than 125,000 cubic meters)
        • Medium (125,000 to 175,000 cubic meters)
        • Large (over 175,000 cubic meters)
      • INDONESIA Liquefied Natural Gas LNG Carrier Market by Propulsion Type

        • Steam Turbine
        • Diesel Electric
        • Dual-Fuel
        • LNG-Fueled
      • INDONESIA Liquefied Natural Gas LNG Carrier Market by Containment System Type

        • Single Membrane
        • Double Membrane
        • Independent
      • INDONESIA Liquefied Natural Gas LNG Carrier Market by Trade Route Type

        • Inter-basin
        • Intra-basin
        • Short-distance
      • REST OF APAC Outlook (USD Billion, 2019-2032)
      • REST OF APAC Liquefied Natural Gas LNG Carrier Market by Carrier Capacity Type

        • Small (less than 125,000 cubic meters)
        • Medium (125,000 to 175,000 cubic meters)
        • Large (over 175,000 cubic meters)
      • REST OF APAC Liquefied Natural Gas LNG Carrier Market by Propulsion Type

        • Steam Turbine
        • Diesel Electric
        • Dual-Fuel
        • LNG-Fueled
      • REST OF APAC Liquefied Natural Gas LNG Carrier Market by Containment System Type

        • Single Membrane
        • Double Membrane
        • Independent
      • REST OF APAC Liquefied Natural Gas LNG Carrier Market by Trade Route Type

        • Inter-basin
        • Intra-basin
        • Short-distance
    • South America Outlook (USD Billion, 2019-2032)

      • South America Liquefied Natural Gas LNG Carrier Market by Carrier Capacity Type

        • Small (less than 125,000 cubic meters)
        • Medium (125,000 to 175,000 cubic meters)
        • Large (over 175,000 cubic meters)
      • South America Liquefied Natural Gas LNG Carrier Market by Propulsion Type

        • Steam Turbine
        • Diesel Electric
        • Dual-Fuel
        • LNG-Fueled
      • South America Liquefied Natural Gas LNG Carrier Market by Containment System Type

        • Single Membrane
        • Double Membrane
        • Independent
      • South America Liquefied Natural Gas LNG Carrier Market by Trade Route Type

        • Inter-basin
        • Intra-basin
        • Short-distance
      • South America Liquefied Natural Gas LNG Carrier Market by Regional Type

        • Brazil
        • Mexico
        • Argentina
        • Rest of South America
      • BRAZIL Outlook (USD Billion, 2019-2032)
      • BRAZIL Liquefied Natural Gas LNG Carrier Market by Carrier Capacity Type

        • Small (less than 125,000 cubic meters)
        • Medium (125,000 to 175,000 cubic meters)
        • Large (over 175,000 cubic meters)
      • BRAZIL Liquefied Natural Gas LNG Carrier Market by Propulsion Type

        • Steam Turbine
        • Diesel Electric
        • Dual-Fuel
        • LNG-Fueled
      • BRAZIL Liquefied Natural Gas LNG Carrier Market by Containment System Type

        • Single Membrane
        • Double Membrane
        • Independent
      • BRAZIL Liquefied Natural Gas LNG Carrier Market by Trade Route Type

        • Inter-basin
        • Intra-basin
        • Short-distance
      • MEXICO Outlook (USD Billion, 2019-2032)
      • MEXICO Liquefied Natural Gas LNG Carrier Market by Carrier Capacity Type

        • Small (less than 125,000 cubic meters)
        • Medium (125,000 to 175,000 cubic meters)
        • Large (over 175,000 cubic meters)
      • MEXICO Liquefied Natural Gas LNG Carrier Market by Propulsion Type

        • Steam Turbine
        • Diesel Electric
        • Dual-Fuel
        • LNG-Fueled
      • MEXICO Liquefied Natural Gas LNG Carrier Market by Containment System Type

        • Single Membrane
        • Double Membrane
        • Independent
      • MEXICO Liquefied Natural Gas LNG Carrier Market by Trade Route Type

        • Inter-basin
        • Intra-basin
        • Short-distance
      • ARGENTINA Outlook (USD Billion, 2019-2032)
      • ARGENTINA Liquefied Natural Gas LNG Carrier Market by Carrier Capacity Type

        • Small (less than 125,000 cubic meters)
        • Medium (125,000 to 175,000 cubic meters)
        • Large (over 175,000 cubic meters)
      • ARGENTINA Liquefied Natural Gas LNG Carrier Market by Propulsion Type

        • Steam Turbine
        • Diesel Electric
        • Dual-Fuel
        • LNG-Fueled
      • ARGENTINA Liquefied Natural Gas LNG Carrier Market by Containment System Type

        • Single Membrane
        • Double Membrane
        • Independent
      • ARGENTINA Liquefied Natural Gas LNG Carrier Market by Trade Route Type

        • Inter-basin
        • Intra-basin
        • Short-distance
      • REST OF SOUTH AMERICA Outlook (USD Billion, 2019-2032)
      • REST OF SOUTH AMERICA Liquefied Natural Gas LNG Carrier Market by Carrier Capacity Type

        • Small (less than 125,000 cubic meters)
        • Medium (125,000 to 175,000 cubic meters)
        • Large (over 175,000 cubic meters)
      • REST OF SOUTH AMERICA Liquefied Natural Gas LNG Carrier Market by Propulsion Type

        • Steam Turbine
        • Diesel Electric
        • Dual-Fuel
        • LNG-Fueled
      • REST OF SOUTH AMERICA Liquefied Natural Gas LNG Carrier Market by Containment System Type

        • Single Membrane
        • Double Membrane
        • Independent
      • REST OF SOUTH AMERICA Liquefied Natural Gas LNG Carrier Market by Trade Route Type

        • Inter-basin
        • Intra-basin
        • Short-distance
    • MEA Outlook (USD Billion, 2019-2032)

      • MEA Liquefied Natural Gas LNG Carrier Market by Carrier Capacity Type

        • Small (less than 125,000 cubic meters)
        • Medium (125,000 to 175,000 cubic meters)
        • Large (over 175,000 cubic meters)
      • MEA Liquefied Natural Gas LNG Carrier Market by Propulsion Type

        • Steam Turbine
        • Diesel Electric
        • Dual-Fuel
        • LNG-Fueled
      • MEA Liquefied Natural Gas LNG Carrier Market by Containment System Type

        • Single Membrane
        • Double Membrane
        • Independent
      • MEA Liquefied Natural Gas LNG Carrier Market by Trade Route Type

        • Inter-basin
        • Intra-basin
        • Short-distance
      • MEA Liquefied Natural Gas LNG Carrier Market by Regional Type

        • GCC Countries
        • South Africa
        • Rest of MEA
      • GCC COUNTRIES Outlook (USD Billion, 2019-2032)
      • GCC COUNTRIES Liquefied Natural Gas LNG Carrier Market by Carrier Capacity Type

        • Small (less than 125,000 cubic meters)
        • Medium (125,000 to 175,000 cubic meters)
        • Large (over 175,000 cubic meters)
      • GCC COUNTRIES Liquefied Natural Gas LNG Carrier Market by Propulsion Type

        • Steam Turbine
        • Diesel Electric
        • Dual-Fuel
        • LNG-Fueled
      • GCC COUNTRIES Liquefied Natural Gas LNG Carrier Market by Containment System Type

        • Single Membrane
        • Double Membrane
        • Independent
      • GCC COUNTRIES Liquefied Natural Gas LNG Carrier Market by Trade Route Type

        • Inter-basin
        • Intra-basin
        • Short-distance
      • SOUTH AFRICA Outlook (USD Billion, 2019-2032)
      • SOUTH AFRICA Liquefied Natural Gas LNG Carrier Market by Carrier Capacity Type

        • Small (less than 125,000 cubic meters)
        • Medium (125,000 to 175,000 cubic meters)
        • Large (over 175,000 cubic meters)
      • SOUTH AFRICA Liquefied Natural Gas LNG Carrier Market by Propulsion Type

        • Steam Turbine
        • Diesel Electric
        • Dual-Fuel
        • LNG-Fueled
      • SOUTH AFRICA Liquefied Natural Gas LNG Carrier Market by Containment System Type

        • Single Membrane
        • Double Membrane
        • Independent
      • SOUTH AFRICA Liquefied Natural Gas LNG Carrier Market by Trade Route Type

        • Inter-basin
        • Intra-basin
        • Short-distance
      • REST OF MEA Outlook (USD Billion, 2019-2032)
      • REST OF MEA Liquefied Natural Gas LNG Carrier Market by Carrier Capacity Type

        • Small (less than 125,000 cubic meters)
        • Medium (125,000 to 175,000 cubic meters)
        • Large (over 175,000 cubic meters)
      • REST OF MEA Liquefied Natural Gas LNG Carrier Market by Propulsion Type

        • Steam Turbine
        • Diesel Electric
        • Dual-Fuel
        • LNG-Fueled
      • REST OF MEA Liquefied Natural Gas LNG Carrier Market by Containment System Type

        • Single Membrane
        • Double Membrane
        • Independent
      • REST OF MEA Liquefied Natural Gas LNG Carrier Market by Trade Route Type

        • Inter-basin
        • Intra-basin
        • Short-distance


    Report Infographic
    Free Sample Request

    Kindly complete the form below to receive a free sample of this Report

    Customer Strories

    “I am very pleased with how market segments have been defined in a relevant way for my purposes (such as "Portable Freezers & refrigerators" and "last-mile"). In general the report is well structured. Thanks very much for your efforts.”

    Victoria Milne Founder
    Case Study

    Chemicals and Materials