• Cat-intel
  • MedIntelliX
  • Resources
  • About Us
  • Request Free Sample ×

    Kindly complete the form below to receive a free sample of this Report

    Leading companies partner with us for data-driven Insights

    clients tt-cursor

    Floating Liquefied Natural Gas Terminals Market

    ID: MRFR/E&P/36900-HCR
    100 Pages
    Chitranshi Jaiswal
    September 2025

    Floating Liquefied Natural Gas Terminals Market Research Report By Terminal Type (Floating Storage and Regasification Unit, Floating Storage Unit, Floating Liquefied Natural Gas Terminal), By Application (Regasification, Storage, Export), By End Use (Power Generation, Industrial, Commercial), By Ownership (Private, Public, Joint Venture) and By Regional (North America, Europe, South America, Asia Pacific, Middle East and Africa) - Forecast to 2034

    Share:
    Download PDF ×

    We do not share your information with anyone. However, we may send you emails based on your report interest from time to time. You may contact us at any time to opt-out.

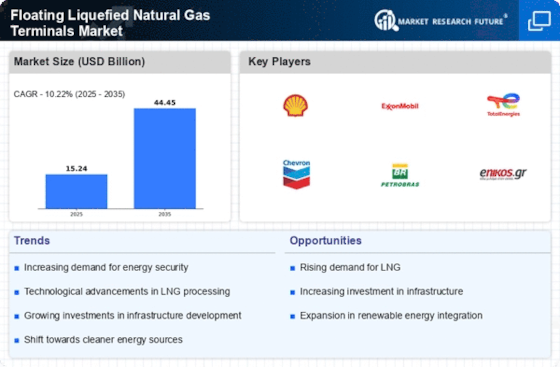
    Floating Liquefied Natural Gas Terminals Market Research Report — Global Forecast till 2034 Infographic
    Purchase Options
    $ 4,950.0
    $ 5,950.0
    $ 7,250.0
    Table of Contents

    Floating Liquefied Natural Gas Terminals Market Summary

    The Global Floating Liquefied Natural Gas Terminals Market is projected to grow from 15.2 USD Billion in 2024 to 44.5 USD Billion by 2035.

    Key Market Trends & Highlights

    Floating Liquefied Natural Gas Terminals Key Trends and Highlights

    • The market is expected to experience a compound annual growth rate (CAGR) of 10.22 percent from 2025 to 2035.
    • By 2035, the market valuation is anticipated to reach 44.5 USD Billion, indicating robust growth potential.
    • In 2024, the market is valued at 15.2 USD Billion, reflecting a strong foundation for future expansion.
    • Growing adoption of floating liquefied natural gas terminals due to increasing energy demand is a major market driver.

    Market Size & Forecast

    2024 Market Size 15.2 (USD Billion)
    2035 Market Size 44.5 (USD Billion)
    CAGR (2025-2035) 10.22%

    Major Players

    Woodside Petroleum, Seaspan Ship Management, Europacific Partners, Korea Gas Corporation, Eni, GAIL, Chevron, ExxonMobil, Petrobras, TotalEnergies, Cameron LNG, Qatargas, Shell, Mitsui O.S.K. Lines

    Floating Liquefied Natural Gas Terminals Market Trends

    The market has a lot of gaps and potentials, especially in areas where gas processing and distribution facilities are lacking. It is conceivable that as countries strive to broaden their energy portfolio and minimize their dependency on oil and coal, floating liquefied natural gas terminals technology will confront many opportunities in these markets. Floating terminal’s design and technology enhancements will also probably extend the brand new capabilities to the operators which would be in the form of decreased costs with increased efficiency. This would give companies with a mindset to innovate likely a competitive advantage.

    Recent times have seen an increasing trend towards modular and smaller scale floating liquefied natural gas terminals owing to the fact that they have low capital expenditure requirements and can be deployed faster than the traditional ones.

    The expansion of floating liquefied natural gas terminals is poised to enhance energy security and diversify supply sources, reflecting a strategic shift in global energy infrastructure.

    U.S. Energy Information Administration (EIA)

    Floating Liquefied Natural Gas Terminals Market Drivers

    Market Growth Projections

    The Global Floating Liquefied Natural Gas Terminals Market Industry is projected to experience substantial growth over the coming years. With a market value of 15.2 USD Billion in 2024, it is anticipated to reach 44.5 USD Billion by 2035, reflecting a robust CAGR of 10.22% from 2025 to 2035. This growth trajectory underscores the increasing importance of floating LNG terminals in global energy strategies, as countries seek to enhance energy security and transition to cleaner fuel sources. The market dynamics suggest a promising future for floating LNG technologies.

    Rising Demand for Natural Gas

    The Global Floating Liquefied Natural Gas Terminals Market Industry is experiencing a surge in demand for natural gas, driven by its cleaner-burning properties compared to coal and oil. As countries strive to reduce carbon emissions, natural gas is increasingly viewed as a transitional fuel. In 2024, the market is projected to reach 15.2 USD Billion, reflecting the growing reliance on liquefied natural gas (LNG) for energy security. This trend is particularly evident in emerging economies, where infrastructure development is underway to support LNG imports, thereby enhancing energy diversification and sustainability.

    Increasing Energy Security Concerns

    Increasing energy security concerns are driving the Global Floating Liquefied Natural Gas Terminals Market Industry. Geopolitical tensions and supply chain vulnerabilities have prompted countries to diversify their energy sources. Floating LNG terminals offer a flexible solution, allowing nations to import LNG from various suppliers, thereby reducing dependence on a single source. This diversification strategy is particularly relevant in regions with unstable energy supplies. As nations prioritize energy resilience, the demand for floating LNG terminals is expected to rise, contributing to the overall growth of the market.

    Strategic Investments and Partnerships

    Strategic investments and partnerships are crucial drivers in the Global Floating Liquefied Natural Gas Terminals Market Industry. Major energy companies are increasingly collaborating with governments and private entities to develop floating LNG projects. These partnerships facilitate access to capital and technology, enabling the construction of new terminals in strategic locations. Such initiatives are essential for meeting the rising global demand for LNG, which is expected to grow at a CAGR of 10.22% from 2025 to 2035. This collaborative approach enhances the overall efficiency and sustainability of LNG supply chains.

    Regulatory Support and Policy Frameworks

    Regulatory support and favorable policy frameworks are vital for the Global Floating Liquefied Natural Gas Terminals Market Industry. Governments worldwide are implementing policies that promote the use of LNG as a cleaner energy source. Incentives such as tax breaks and subsidies for LNG infrastructure development are encouraging investments in floating terminals. This supportive environment is likely to accelerate the growth of the market, as countries seek to meet international climate commitments while ensuring energy security. The alignment of regulatory frameworks with market needs is essential for fostering a robust LNG ecosystem.

    Technological Advancements in LNG Technology

    Technological innovations are playing a pivotal role in the Global Floating Liquefied Natural Gas Terminals Market Industry. Enhanced floating LNG technologies, such as improved regasification processes and more efficient storage solutions, are being developed to optimize operations. These advancements not only increase the efficiency of LNG terminals but also reduce operational costs. As a result, the market is expected to grow significantly, with projections indicating a rise to 44.5 USD Billion by 2035. This growth is likely to attract investments and foster competition among key players in the industry.

    Market Segment Insights

    Floating Liquefied Natural Gas Terminals Market Segment Insights

    Floating Liquefied Natural Gas Terminals Market Terminal Type Insights

    The Floating Liquefied Natural Gas Terminals Market, with its valuation reaching 12.54 USD Billion in 2023, showcases a robust growth trajectory within the Terminal Type segment. This segment is divided into three primary areas: Floating Storage and Regasification Units, Floating Storage Units, and Floating Liquefied Natural Gas Terminals, each demonstrating unique contributions to the overall market. Notably, the Floating Storage and Regasification Unit leads with a significant valuation of 4.87 USD Billion in 2023, highlighting its essential role in the efficient conversion of LNG back to gas, which is particularly critical for meeting increasing energy demands globally.

    Following closely, the Floating Storage Unit, valued at 3.54 USD Billion, plays a vital role in providing necessary temporary storage solutions for LNG, ensuring supply stability and flexibility in distribution.

    The Floating Liquefied Natural Gas Terminal, with a valuation of 4.13 USD Billion, provides the crucial infrastructure necessary for the liquefaction process and offers operational benefits by reducing the need for onshore facilities. Growth drivers for this segment include increasing demand for cleaner energy sources, rising investments in LNG infrastructure, and advancements in floating regasification technologies. Simultaneously, market challenges such as high initial capital investments, regulatory hurdles, and environmental concerns could impact the pace of growth.

    The market is expected to expand significantly, projecting a combined valuation of 30.1 USD Billion by 2032, reflecting the growing importance of LNG in global energy consumption. The Floating Storage and Regasification Unit is projected to maintain its dominance due to this increasing reliance on LNG in energy strategies, underscoring its essential nature in the energy transition process. Furthermore, overall, the Floating Liquefied Natural Gas Terminals Market data indicates a consistent upward trend across all terminal types, with each contributing to a sustainable energy future.

    The value assigned to each segment adjusts according to market demand pressures and regulatory incentives, highlighting the dynamic nature of the industry and its responsiveness to global energy shifts. As the sector matures, opportunities for innovation and improvement within these terminal types arise, driven by technological advancements and increasing acceptance of LNG as a transition fuel. In such a context, the Floating Liquefied Natural Gas Terminals Market statistics suggest a balanced growth among all three types, ensuring each type meets the diverse requirements of the evolving energy landscape.

    Floating Liquefied Natural Gas Terminals Market Terminal Type Insights

    Source: Primary Research, Secondary Research, Market Research Future Database and Analyst Review

    Floating Liquefied Natural Gas Terminals Market Application Insights

    The Floating Liquefied Natural Gas Terminals Market, valued at 12.54 USD billion in 2023, emphasizes the significance of the Application segment, which includes various key functionalities such as Regasification, Storage, and Export. Regasification plays a crucial role in converting liquefied natural gas back into gas form, supporting the demand for energy in various regions. Storage facilities are pivotal for managing supply and demand fluctuations, allowing for a steady flow of liquefied natural gas, particularly in regions experiencing high gas consumption.

    Meanwhile, the Export function drives global trade, enabling countries with abundant natural gas resources to monetize their assets effectively. The market's growth trajectory is supported by increasing energy needs, environmental regulations favoring cleaner fuel sources, and advancements in technology enhancing operational efficiency across these applications. As the industry continues to adapt, the segmentation within the Floating Liquefied Natural Gas Terminals Market reflects an evolving landscape that is increasingly responsive to both market demands and global energy trends.

    Floating Liquefied Natural Gas Terminals Market End Use Insights

    The Floating Liquefied Natural Gas Terminals Market is expected to experience substantial growth across various end-use categories, with the overall market valued at 12.54 billion USD in 2023. This market segmentation reflects a diverse range of applications that are critical to the global energy landscape. Power generation stands out as a major portion of the market due to the increasing demand for clean energy alternatives and the shift toward natural gas as a preferred fuel source, significantly reducing carbon emissions.

    The industrial sector is also pivotal, utilizing liquefied natural gas for manufacturing processes and as a fuel source for various operations, enhancing efficiency and sustainability.

    Additionally, the commercial segment plays an essential role as businesses increasingly adopt liquefied natural gas for heating and powering equipment, driven by the advantages of reduced operational costs and lower environmental impact. The overall trajectory of the Floating Liquefied Natural Gas Terminals Market indicates increasing investments and innovations in infrastructure to cater to these segments, presenting numerous growth opportunities while addressing challenges such as regulatory hurdles and supply chain constraints. Market growth will likely continue to gain momentum through 2032, with significant advancements expected in technology and infrastructure.

    Floating Liquefied Natural Gas Terminals Market Ownership Insights

    The Floating Liquefied Natural Gas Terminals Market, valued at 12.54 USD billion in 2023, showcases diverse ownership structures that impact its revenue generation and operational dynamics. This market is segmented into Private, Public, and Joint Venture ownership models, each playing a crucial role in shaping the industry's landscape. The Private segment often holds a majority stake, allowing companies to have greater control over operations and investment strategies, which can drive innovation and efficiency. The Public ownership segment typically benefits from governmental support and regulatory frameworks, ensuring stable operations and potentially lower risks.

    Joint Ventures facilitate collaboration between different entities, enabling shared resources and expertise, which is increasingly significant in a market that thrives on technological advancements and cost-sharing strategies. As the market continues to evolve, the interplay of these ownership types will address challenges such as regulatory hurdles and competition while also seizing opportunities presented by the growing demand for cleaner energy solutions. Understanding the dynamics within these ownership structures is essential to grasping the broader trends affecting the Floating Liquefied Natural Gas Terminals Market statistics and its future growth trajectory.

    Regional Insights

    The Floating Liquefied Natural Gas Terminals Market exhibits considerable growth across various regional segments. In 2023, North America was valued at 3.0 USD Billion and is projected to reach 7.5 USD Billion by 2032, reflecting its significant contribution to the market growth. Europe follows with a valuation of 2.7 USD Billion in 2023, expected to rise to 6.5 USD Billion by 2032, underscoring its importance as a major player in the industry.

    The Asia-Pacific (APAC) region dominates with the highest valuation of 4.0 USD Billion in 2023 and is anticipated to grow to 9.0 USD Billion by 2032, driven by rising energy demands and favorable policies.

    In South America, the market is valued at 1.0 USD Billion in 2023 and is expected to reach 2.5 USD Billion by 2032, presenting opportunities for expansion in the energy sector. Meanwhile, the Middle East and Africa (MEA) segment stands at 1.84 USD Billion in 2023, aiming for 4.7 USD Billion by 2032. Each region's growth is propelled by the demand for cleaner energy sources, but North America and APAC hold a significant share due to their robust infrastructure and technological advancements in Floating Liquefied Natural Gas Terminals Market setups.

    Floating Liquefied Natural Gas Terminals Market Regional Insights

    Source: Primary Research, Secondary Research, Market Research Future Database and Analyst Review

    Key Players and Competitive Insights

    The Floating Liquefied Natural Gas Terminals Market is characterized by a competitive landscape that is continually evolving due to growing energy demands and a shift toward cleaner fuel sources. The market showcases a blend of established players and emerging companies, each vying for market share through technological advancements, operational efficiencies, and strategic partnerships. As the demand for liquefied natural gas increases globally, companies are focusing on enhancing their service offerings and expanding their terminal capabilities to meet the diverse needs of various regions.

    The competitive dynamics are further influenced by regulatory frameworks, investment trends, and geopolitical factors that affect supply chains and logistics. In such a fast-paced environment, companies are differentiating themselves based on technological innovations, cost-effectiveness, and the ability to respond quickly to market changes.

    Woodside Petroleum holds a significant position within the Floating Liquefied Natural Gas Terminals Market, recognized for its strong operational capabilities and commitment to innovation. The company has established itself as a leader in developing floating LNG solutions, which enhances its competitive advantage in addressing the growing global energy demands. Woodside Petroleum's extensive experience in project management and execution has enabled it to efficiently develop and implement floating terminals that cater to various market requirements. Furthermore, its strategic focus on maintaining high safety and environmental standards positions Woodside Petroleum favorably within the sector.

    The company also has a solid portfolio of technical expertise and partnerships, allowing it to capitalize on emerging opportunities and strengthen its market presence across different regions.

    Seaspan Ship Management plays a vital role in the Floating Liquefied Natural Gas Terminals Market by providing essential maritime services and facilitating the efficient operation of floating LNG facilities. The organization is known for its strong commitment to operational excellence and safety, making it a reliable partner for companies looking to optimize their LNG terminal operations. Seaspan Ship Management’s expertise in ship management and fleet operations ensures that floating terminals are effectively integrated with supply chains, thereby maintaining consistent and reliable LNG supply to stakeholders.

    Additionally, the company’s ability to adapt to evolving market demands and regulatory landscapes positions it competitively within the rising global transition toward cleaner energy. With its focus on maintaining high levels of performance and reliability, Seaspan Ship Management contributes significantly to the overall efficiency and effectiveness of floating liquefied natural gas terminals in diverse geographical markets.

    Key Companies in the Floating Liquefied Natural Gas Terminals Market market include

    Industry Developments

    • Q4 2024: Germany to have two more floating LNG import terminals in operation by winter – operator State-owned Deutsche Energy Terminal announced that two additional floating LNG import terminals are due to go into operation in Wilhelmshaven and Stade before winter 2024, expanding Germany’s floating LNG infrastructure in response to energy security needs.
    • Q4 2024: US Liquid Natural Gas Infrastructure Booms Amidst Uncertain Demand On December 13, 2024, Venture Global LNG commenced commercial production at a new liquefied natural gas facility, marking a significant addition to U.S. LNG export infrastructure.

    Future Outlook

    Floating Liquefied Natural Gas Terminals Market Future Outlook

    The Floating Liquefied Natural Gas Terminals Market is projected to grow at a 10.22% CAGR from 2024 to 2035, driven by increasing energy demand, technological advancements, and environmental regulations.

    New opportunities lie in:

    • Invest in advanced floating terminal technologies for enhanced efficiency and reduced emissions.
    • Explore partnerships with emerging markets to expand LNG supply chains and infrastructure.
    • Develop innovative financing models to support large-scale floating LNG projects.

    By 2035, the market is expected to achieve substantial growth, positioning itself as a cornerstone of global energy infrastructure.

    Market Segmentation

    Floating Liquefied Natural Gas Terminals Market End Use Outlook

    • Power Generation
    • Industrial
    • Commercial

    Floating Liquefied Natural Gas Terminals Market Regional Outlook

    • North America
    • Europe
    • South America
    • Asia Pacific
    • Middle East and Africa

    Floating Liquefied Natural Gas Terminals Market Ownership Outlook

    • Private
    • Public
    • Joint Venture

    Floating Liquefied Natural Gas Terminals Market Application Outlook

    • Regasification
    • Storage
    • Export

    Floating Liquefied Natural Gas Terminals Market Terminal Type Outlook

    • Floating Storage and Regasification Unit
    • Floating Storage Unit
    • Floating Liquefied Natural Gas Terminal

    Report Scope

    Report Attribute/Metric Details
    Market Size 2024  15.24 (USD Billion)
    Market Size 2025  16.80 (USD Billion)
    Market Size 2034  40.33 (USD Billion)
    Compound Annual Growth Rate (CAGR)  10.22% (2025 - 2034)
    Report Coverage Revenue Forecast, Competitive Landscape, Growth Factors, and Trends
    Base Year 2024
    Market Forecast Period 2025 - 2034
    Historical Data 2019 - 2023
    Market Forecast Units USD Billion
    Key Companies Profiled Woodside Petroleum, Seaspan Ship Management, Europacific Partners, Korea Gas Corporation, Eni, GAIL, Chevron, ExxonMobil, Petrobras, TotalEnergies, Cameron LNG, Qatargas, Shell, Mitsui O.S.K. Lines
    Segments Covered Terminal Type, Application, End Use, Ownership, Regional
    Key Market Opportunities Increased demand for clean energy, Expansion of offshore gas production, Technological advancements in FLNG systems, Strategic partnerships and collaborations, Investment in emerging markets
    Key Market Dynamics Increasing LNG demand, Technological advancements, Cost-effective solutions, Environmental regulations, Strategic partnerships
    Countries Covered North America, Europe, APAC, South America, MEA

    Market Highlights

    Author
    Chitranshi Jaiswal
    Research Analyst Level I

    In her 3 years of experience in the market research field, she has handled critical cross-domain projects. She has an in-depth knowledge of market estimation & analysis, problem-solving, primary as well as secondary research, and team management.She holds an engineering degree and is an MBA professional from a well-known university, capable of evaluating the market and competitive conditions. An exceptional strategist with excellent communication skills and a passion for delivering cutting-edge & practical insights for the market. Proficient in multi-tasking, and can successfully deal with competing demands, while maintaining complete confidentiality. Generated business through active client and project development, networking, and high-quality responses. Her knowledge and skills have helped in making solid business decisions, securing funding from investors, and avoiding business failures.

    Leave a Comment

    FAQs

    What is the expected market size of the Floating Liquefied Natural Gas Terminals Market in 2034?

    The market is expected to be valued at 40.33 USD Billion in 2034.

    What is the projected CAGR for the Floating Liquefied Natural Gas Terminals Market from 2025 to 2034?

    The expected CAGR for the market is 10.22% from 2025 to 2034.

    Which region is anticipated to be the largest market for Floating Liquefied Natural Gas Terminals in 2032?

    North America is anticipated to be the largest market, valued at 7.5 USD Billion in 2032.

    What will be the market value for Floating Storage and Regasification Units in 2032?

    The market value for Floating Storage and Regasification Units is projected to reach 12.06 USD Billion in 2032.

    Who are the key players in the Floating Liquefied Natural Gas Terminals Market?

    Major players include Woodside Petroleum, ExxonMobil, Chevron, Shell, and TotalEnergies.

    What is the anticipated market value for the Floating Storage Unit segment in 2032?

    The Floating Storage Unit segment is expected to be valued at 8.85 USD Billion in 2032.

    What is the expected market size for the Middle East and Africa region in 2032?

    The expected market size for the Middle East and Africa region is 4.7 USD Billion in 2032.

    What are the estimated values for the Floating Liquefied Natural Gas Terminals Market in Europe for 2023 and 2032?

    In 2023, the market is valued at 2.7 USD Billion and is expected to reach 6.5 USD Billion by 2032.

    How much is the market for Floating Liquefied Natural Gas Terminals valued in South America in 2032?

    The market for Floating Liquefied Natural Gas Terminals in South America is anticipated to be 2.5 USD Billion in 2032.

    What are some growth drivers for the Floating Liquefied Natural Gas Terminals Market?

    Key growth drivers include rising energy demand and increased investments in cleaner energy technologies.

    1. EXECUTIVE SUMMARY
    2. Market Overview
      1. Key Findings
      2. Market Segmentation
    3. Competitive Landscape
      1. Challenges and Opportunities
      2. Future Outlook
    4. MARKET INTRODUCTION
      1. Definition
      2. Scope of the study
        1. Research Objective
        2. Assumption
        3. Limitations
    5. RESEARCH METHODOLOGY
      1. Overview
    6. Data Mining
      1. Secondary Research
      2. Primary Research
    7. Primary Interviews and Information Gathering Process
      1. Breakdown of Primary
    8. Respondents
      1. Forecasting Model
      2. Market Size Estimation
    9. Bottom-Up Approach
      1. Top-Down Approach
      2. Data Triangulation
      3. Validation
    10. MARKET DYNAMICS
      1. Overview
      2. Drivers
      3. Restraints
      4. Opportunities
    11. MARKET FACTOR ANALYSIS
      1. Value chain Analysis
      2. Porter's Five Forces
    12. Analysis
      1. Bargaining Power of Suppliers
        1. Bargaining Power
    13. of Buyers
      1. Threat of New Entrants
        1. Threat of Substitutes
        2. Intensity of Rivalry
      2. COVID-19 Impact Analysis
    14. Market Impact Analysis
      1. Regional Impact
        1. Opportunity and
    15. Threat Analysis
    16. FLOATING LIQUEFIED NATURAL GAS TERMINALS
    17. MARKET, BY TERMINAL TYPE (USD BILLION)
      1. Floating Storage and Regasification
    18. Unit
      1. Floating Storage Unit
      2. Floating Liquefied Natural Gas
    19. Terminal
    20. FLOATING LIQUEFIED NATURAL GAS TERMINALS MARKET, BY APPLICATION
    21. (USD BILLION)
      1. Regasification
      2. Storage
      3. Export
    22. FLOATING LIQUEFIED NATURAL GAS TERMINALS MARKET, BY END USE (USD BILLION)
      1. Power Generation
      2. Industrial
      3. Commercial
    23. FLOATING
    24. LIQUEFIED NATURAL GAS TERMINALS MARKET, BY OWNERSHIP (USD BILLION)
      1. Private
      2. Public
      3. Joint Venture
    25. FLOATING LIQUEFIED NATURAL
    26. GAS TERMINALS MARKET, BY REGIONAL (USD BILLION)
      1. North America
    27. US
      1. Canada
      2. Europe
        1. Germany
        2. UK
        3. France
        4. Russia
        5. Italy
        6. Spain
        7. Rest of Europe
      3. APAC
        1. China
    28. India
      1. Japan
        1. South Korea
        2. Malaysia
    29. Thailand
      1. Indonesia
        1. Rest of APAC
      2. South America
        1. Brazil
        2. Mexico
        3. Argentina
    30. Rest of South America
      1. MEA
        1. GCC Countries
    31. South Africa
      1. Rest of MEA
    32. COMPETITIVE LANDSCAPE
      1. Overview
      2. Competitive Analysis
      3. Market share Analysis
      4. Major Growth Strategy in the Floating Liquefied Natural Gas Terminals
    33. Market
      1. Competitive Benchmarking
      2. Leading Players in Terms
    34. of Number of Developments in the Floating Liquefied Natural Gas Terminals Market
      1. Key developments and growth strategies
        1. New Product Launch/Service
    35. Deployment
      1. Merger & Acquisitions
        1. Joint Ventures
      2. Major Players Financial Matrix
        1. Sales and Operating Income
        2. Major Players R&D Expenditure. 2023
    36. COMPANY PROFILES
      1. Woodside Petroleum
        1. Financial Overview
        2. Products
    37. Offered
      1. Key Developments
        1. SWOT Analysis
    38. Key Strategies
      1. Seaspan Ship Management
        1. Financial Overview
        2. Products Offered
        3. Key Developments
        4. SWOT
    39. Analysis
      1. Key Strategies
      2. Europacific Partners
    40. Financial Overview
      1. Products Offered
        1. Key Developments
        2. SWOT Analysis
        3. Key Strategies
      2. Korea Gas Corporation
        1. Financial Overview
        2. Products Offered
        3. Key
    41. Developments
      1. SWOT Analysis
        1. Key Strategies
    42. Eni
      1. Financial Overview
        1. Products Offered
    43. Key Developments
      1. SWOT Analysis
        1. Key Strategies
    44. GAIL
      1. Financial Overview
        1. Products Offered
    45. Key Developments
      1. SWOT Analysis
        1. Key Strategies
    46. Chevron
      1. Financial Overview
        1. Products Offered
    47. Key Developments
      1. SWOT Analysis
        1. Key Strategies
    48. ExxonMobil
      1. Financial Overview
        1. Products Offered
    49. Key Developments
      1. SWOT Analysis
        1. Key Strategies
    50. Petrobras
      1. Financial Overview
        1. Products Offered
    51. Key Developments
      1. SWOT Analysis
        1. Key Strategies
    52. TotalEnergies
      1. Financial Overview
        1. Products Offered
        2. Key Developments
        3. SWOT Analysis
        4. Key
    53. Strategies
      1. Cameron LNG
        1. Financial Overview
    54. Products Offered
      1. Key Developments
        1. SWOT Analysis
        2. Key Strategies
      2. Qatargas
        1. Financial Overview
        2. Products Offered
        3. Key Developments
        4. SWOT
    55. Analysis
      1. Key Strategies
      2. Shell
        1. Financial
    56. Overview
      1. Products Offered
        1. Key Developments
    57. SWOT Analysis
      1. Key Strategies
      2. Mitsui O.S.K. Lines
        1. Financial Overview
        2. Products Offered
        3. Key
    58. Developments
      1. SWOT Analysis
        1. Key Strategies
      2. References
      3. Related Reports
    59. NATURAL GAS TERMINALS MARKET SIZE ESTIMATES & FORECAST, BY TERMINAL TYPE, 2019-2032
    60. (USD BILLIONS)
    61. MARKET SIZE ESTIMATES & FORECAST, BY APPLICATION, 2019-2032 (USD BILLIONS)
    62. & FORECAST, BY END USE, 2019-2032 (USD BILLIONS)
    63. FLOATING LIQUEFIED NATURAL GAS TERMINALS MARKET SIZE ESTIMATES & FORECAST, BY
    64. OWNERSHIP, 2019-2032 (USD BILLIONS)
    65. NATURAL GAS TERMINALS MARKET SIZE ESTIMATES & FORECAST, BY REGIONAL, 2019-2032
    66. (USD BILLIONS)
    67. SIZE ESTIMATES & FORECAST, BY TERMINAL TYPE, 2019-2032 (USD BILLIONS)
    68. US FLOATING LIQUEFIED NATURAL GAS TERMINALS MARKET SIZE ESTIMATES & FORECAST,
    69. BY APPLICATION, 2019-2032 (USD BILLIONS)
    70. GAS TERMINALS MARKET SIZE ESTIMATES & FORECAST, BY END USE, 2019-2032 (USD BILLIONS)
    71. & FORECAST, BY OWNERSHIP, 2019-2032 (USD BILLIONS)
    72. LIQUEFIED NATURAL GAS TERMINALS MARKET SIZE ESTIMATES & FORECAST, BY REGIONAL,
    73. 2032 (USD BILLIONS)
    74. MARKET SIZE ESTIMATES & FORECAST, BY TERMINAL TYPE, 2019-2032 (USD BILLIONS)
    75. & FORECAST, BY APPLICATION, 2019-2032 (USD BILLIONS)
    76. FLOATING LIQUEFIED NATURAL GAS TERMINALS MARKET SIZE ESTIMATES & FORECAST, BY
    77. END USE, 2019-2032 (USD BILLIONS)
    78. GAS TERMINALS MARKET SIZE ESTIMATES & FORECAST, BY OWNERSHIP, 2019-2032 (USD
    79. BILLIONS)
    80. SIZE ESTIMATES & FORECAST, BY REGIONAL, 2019-2032 (USD BILLIONS)
    81. EUROPE FLOATING LIQUEFIED NATURAL GAS TERMINALS MARKET SIZE ESTIMATES &
    82. FORECAST, BY TERMINAL TYPE, 2019-2032 (USD BILLIONS)
    83. LIQUEFIED NATURAL GAS TERMINALS MARKET SIZE ESTIMATES & FORECAST, BY APPLICATION,
    84. 2032 (USD BILLIONS)
    85. MARKET SIZE ESTIMATES & FORECAST, BY END USE, 2019-2032 (USD BILLIONS)
    86. EUROPE FLOATING LIQUEFIED NATURAL GAS TERMINALS MARKET SIZE ESTIMATES &
    87. FORECAST, BY OWNERSHIP, 2019-2032 (USD BILLIONS)
    88. LIQUEFIED NATURAL GAS TERMINALS MARKET SIZE ESTIMATES & FORECAST, BY REGIONAL,
    89. 2032 (USD BILLIONS)
    90. TERMINALS MARKET SIZE ESTIMATES & FORECAST, BY TERMINAL TYPE, 2019-2032 (USD
    91. BILLIONS)
    92. SIZE ESTIMATES & FORECAST, BY APPLICATION, 2019-2032 (USD BILLIONS)
    93. GERMANY FLOATING LIQUEFIED NATURAL GAS TERMINALS MARKET SIZE ESTIMATES &
    94. FORECAST, BY END USE, 2019-2032 (USD BILLIONS)
    95. LIQUEFIED NATURAL GAS TERMINALS MARKET SIZE ESTIMATES & FORECAST, BY OWNERSHIP,
    96. 2032 (USD BILLIONS)
    97. TERMINALS MARKET SIZE ESTIMATES & FORECAST, BY REGIONAL, 2019-2032 (USD BILLIONS)
    98. & FORECAST, BY TERMINAL TYPE, 2019-2032 (USD BILLIONS)
    99. LIQUEFIED NATURAL GAS TERMINALS MARKET SIZE ESTIMATES & FORECAST, BY APPLICATION,
    100. 2032 (USD BILLIONS)
    101. MARKET SIZE ESTIMATES & FORECAST, BY END USE, 2019-2032 (USD BILLIONS)
    102. UK FLOATING LIQUEFIED NATURAL GAS TERMINALS MARKET SIZE ESTIMATES & FORECAST,
    103. BY OWNERSHIP, 2019-2032 (USD BILLIONS)
    104. GAS TERMINALS MARKET SIZE ESTIMATES & FORECAST, BY REGIONAL, 2019-2032 (USD
    105. BILLIONS)
    106. SIZE ESTIMATES & FORECAST, BY TERMINAL TYPE, 2019-2032 (USD BILLIONS)
    107. FRANCE FLOATING LIQUEFIED NATURAL GAS TERMINALS MARKET SIZE ESTIMATES &
    108. FORECAST, BY APPLICATION, 2019-2032 (USD BILLIONS)
    109. LIQUEFIED NATURAL GAS TERMINALS MARKET SIZE ESTIMATES & FORECAST, BY END USE,
    110. 2032 (USD BILLIONS)
    111. MARKET SIZE ESTIMATES & FORECAST, BY OWNERSHIP, 2019-2032 (USD BILLIONS)
    112. & FORECAST, BY REGIONAL, 2019-2032 (USD BILLIONS)
    113. LIQUEFIED NATURAL GAS TERMINALS MARKET SIZE ESTIMATES & FORECAST, BY TERMINAL
    114. TYPE, 2019-2032 (USD BILLIONS)
    115. GAS TERMINALS MARKET SIZE ESTIMATES & FORECAST, BY APPLICATION, 2019-2032 (USD
    116. BILLIONS)
    117. SIZE ESTIMATES & FORECAST, BY END USE, 2019-2032 (USD BILLIONS)
    118. RUSSIA FLOATING LIQUEFIED NATURAL GAS TERMINALS MARKET SIZE ESTIMATES &
    119. FORECAST, BY OWNERSHIP, 2019-2032 (USD BILLIONS)
    120. LIQUEFIED NATURAL GAS TERMINALS MARKET SIZE ESTIMATES & FORECAST, BY REGIONAL,
    121. 2032 (USD BILLIONS)
    122. MARKET SIZE ESTIMATES & FORECAST, BY TERMINAL TYPE, 2019-2032 (USD BILLIONS)
    123. & FORECAST, BY APPLICATION, 2019-2032 (USD BILLIONS)
    124. LIQUEFIED NATURAL GAS TERMINALS MARKET SIZE ESTIMATES & FORECAST, BY END USE,
    125. 2032 (USD BILLIONS)
    126. MARKET SIZE ESTIMATES & FORECAST, BY OWNERSHIP, 2019-2032 (USD BILLIONS)
    127. & FORECAST, BY REGIONAL, 2019-2032 (USD BILLIONS)
    128. LIQUEFIED NATURAL GAS TERMINALS MARKET SIZE ESTIMATES & FORECAST, BY TERMINAL
    129. TYPE, 2019-2032 (USD BILLIONS)
    130. GAS TERMINALS MARKET SIZE ESTIMATES & FORECAST, BY APPLICATION, 2019-2032 (USD
    131. BILLIONS)
    132. SIZE ESTIMATES & FORECAST, BY END USE, 2019-2032 (USD BILLIONS)
    133. SPAIN FLOATING LIQUEFIED NATURAL GAS TERMINALS MARKET SIZE ESTIMATES & FORECAST,
    134. BY OWNERSHIP, 2019-2032 (USD BILLIONS)
    135. NATURAL GAS TERMINALS MARKET SIZE ESTIMATES & FORECAST, BY REGIONAL, 2019-2032
    136. (USD BILLIONS)
    137. MARKET SIZE ESTIMATES & FORECAST, BY TERMINAL TYPE, 2019-2032 (USD BILLIONS)
    138. ESTIMATES & FORECAST, BY APPLICATION, 2019-2032 (USD BILLIONS)
    139. REST OF EUROPE FLOATING LIQUEFIED NATURAL GAS TERMINALS MARKET SIZE ESTIMATES &
    140. FORECAST, BY END USE, 2019-2032 (USD BILLIONS)
    141. LIQUEFIED NATURAL GAS TERMINALS MARKET SIZE ESTIMATES & FORECAST, BY OWNERSHIP,
    142. 2032 (USD BILLIONS)
    143. GAS TERMINALS MARKET SIZE ESTIMATES & FORECAST, BY REGIONAL, 2019-2032 (USD
    144. BILLIONS)
    145. ESTIMATES & FORECAST, BY TERMINAL TYPE, 2019-2032 (USD BILLIONS)
    146. APAC FLOATING LIQUEFIED NATURAL GAS TERMINALS MARKET SIZE ESTIMATES & FORECAST,
    147. BY APPLICATION, 2019-2032 (USD BILLIONS)
    148. NATURAL GAS TERMINALS MARKET SIZE ESTIMATES & FORECAST, BY END USE, 2019-2032
    149. (USD BILLIONS)
    150. SIZE ESTIMATES & FORECAST, BY OWNERSHIP, 2019-2032 (USD BILLIONS)
    151. APAC FLOATING LIQUEFIED NATURAL GAS TERMINALS MARKET SIZE ESTIMATES & FORECAST,
    152. BY REGIONAL, 2019-2032 (USD BILLIONS)
    153. GAS TERMINALS MARKET SIZE ESTIMATES & FORECAST, BY TERMINAL TYPE, 2019-2032
    154. (USD BILLIONS)
    155. SIZE ESTIMATES & FORECAST, BY APPLICATION, 2019-2032 (USD BILLIONS)
    156. CHINA FLOATING LIQUEFIED NATURAL GAS TERMINALS MARKET SIZE ESTIMATES & FORECAST,
    157. BY END USE, 2019-2032 (USD BILLIONS)
    158. GAS TERMINALS MARKET SIZE ESTIMATES & FORECAST, BY OWNERSHIP, 2019-2032 (USD
    159. BILLIONS)
    160. SIZE ESTIMATES & FORECAST, BY REGIONAL, 2019-2032 (USD BILLIONS)
    161. INDIA FLOATING LIQUEFIED NATURAL GAS TERMINALS MARKET SIZE ESTIMATES & FORECAST,
    162. BY TERMINAL TYPE, 2019-2032 (USD BILLIONS)
    163. NATURAL GAS TERMINALS MARKET SIZE ESTIMATES & FORECAST, BY APPLICATION, 2019-2032
    164. (USD BILLIONS)
    165. SIZE ESTIMATES & FORECAST, BY END USE, 2019-2032 (USD BILLIONS)
    166. INDIA FLOATING LIQUEFIED NATURAL GAS TERMINALS MARKET SIZE ESTIMATES & FORECAST,
    167. BY OWNERSHIP, 2019-2032 (USD BILLIONS)
    168. NATURAL GAS TERMINALS MARKET SIZE ESTIMATES & FORECAST, BY REGIONAL, 2019-2032
    169. (USD BILLIONS)
    170. SIZE ESTIMATES & FORECAST, BY TERMINAL TYPE, 2019-2032 (USD BILLIONS)
    171. JAPAN FLOATING LIQUEFIED NATURAL GAS TERMINALS MARKET SIZE ESTIMATES & FORECAST,
    172. BY APPLICATION, 2019-2032 (USD BILLIONS)
    173. NATURAL GAS TERMINALS MARKET SIZE ESTIMATES & FORECAST, BY END USE, 2019-2032
    174. (USD BILLIONS)
    175. SIZE ESTIMATES & FORECAST, BY OWNERSHIP, 2019-2032 (USD BILLIONS)
    176. JAPAN FLOATING LIQUEFIED NATURAL GAS TERMINALS MARKET SIZE ESTIMATES & FORECAST,
    177. BY REGIONAL, 2019-2032 (USD BILLIONS)
    178. NATURAL GAS TERMINALS MARKET SIZE ESTIMATES & FORECAST, BY TERMINAL TYPE, 2019-2032
    179. (USD BILLIONS)
    180. MARKET SIZE ESTIMATES & FORECAST, BY APPLICATION, 2019-2032 (USD BILLIONS)
    181. & FORECAST, BY END USE, 2019-2032 (USD BILLIONS)
    182. FLOATING LIQUEFIED NATURAL GAS TERMINALS MARKET SIZE ESTIMATES & FORECAST, BY
    183. OWNERSHIP, 2019-2032 (USD BILLIONS)
    184. NATURAL GAS TERMINALS MARKET SIZE ESTIMATES & FORECAST, BY REGIONAL, 2019-2032
    185. (USD BILLIONS)
    186. MARKET SIZE ESTIMATES & FORECAST, BY TERMINAL TYPE, 2019-2032 (USD BILLIONS)
    187. & FORECAST, BY APPLICATION, 2019-2032 (USD BILLIONS)
    188. FLOATING LIQUEFIED NATURAL GAS TERMINALS MARKET SIZE ESTIMATES & FORECAST, BY
    189. END USE, 2019-2032 (USD BILLIONS)
    190. GAS TERMINALS MARKET SIZE ESTIMATES & FORECAST, BY OWNERSHIP, 2019-2032 (USD
    191. BILLIONS)
    192. SIZE ESTIMATES & FORECAST, BY REGIONAL, 2019-2032 (USD BILLIONS)
    193. THAILAND FLOATING LIQUEFIED NATURAL GAS TERMINALS MARKET SIZE ESTIMATES &
    194. FORECAST, BY TERMINAL TYPE, 2019-2032 (USD BILLIONS)
    195. LIQUEFIED NATURAL GAS TERMINALS MARKET SIZE ESTIMATES & FORECAST, BY APPLICATION,
    196. 2032 (USD BILLIONS)
    197. TERMINALS MARKET SIZE ESTIMATES & FORECAST, BY END USE, 2019-2032 (USD BILLIONS)
    198. & FORECAST, BY OWNERSHIP, 2019-2032 (USD BILLIONS)
    199. FLOATING LIQUEFIED NATURAL GAS TERMINALS MARKET SIZE ESTIMATES & FORECAST, BY
    200. REGIONAL, 2019-2032 (USD BILLIONS)
    201. NATURAL GAS TERMINALS MARKET SIZE ESTIMATES & FORECAST, BY TERMINAL TYPE, 2019-2032
    202. (USD BILLIONS)
    203. MARKET SIZE ESTIMATES & FORECAST, BY APPLICATION, 2019-2032 (USD BILLIONS)
    204. & FORECAST, BY END USE, 2019-2032 (USD BILLIONS)
    205. LIQUEFIED NATURAL GAS TERMINALS MARKET SIZE ESTIMATES & FORECAST, BY OWNERSHIP,
    206. 2032 (USD BILLIONS)
    207. TERMINALS MARKET SIZE ESTIMATES & FORECAST, BY REGIONAL, 2019-2032 (USD BILLIONS)
    208. ESTIMATES & FORECAST, BY TERMINAL TYPE, 2019-2032 (USD BILLIONS)
    209. REST OF APAC FLOATING LIQUEFIED NATURAL GAS TERMINALS MARKET SIZE ESTIMATES
    210. & FORECAST, BY APPLICATION, 2019-2032 (USD BILLIONS)
    211. APAC FLOATING LIQUEFIED NATURAL GAS TERMINALS MARKET SIZE ESTIMATES & FORECAST,
    212. BY END USE, 2019-2032 (USD BILLIONS)
    213. NATURAL GAS TERMINALS MARKET SIZE ESTIMATES & FORECAST, BY OWNERSHIP, 2019-2032
    214. (USD BILLIONS)
    215. MARKET SIZE ESTIMATES & FORECAST, BY REGIONAL, 2019-2032 (USD BILLIONS)
    216. ESTIMATES & FORECAST, BY TERMINAL TYPE, 2019-2032 (USD BILLIONS)
    217. SOUTH AMERICA FLOATING LIQUEFIED NATURAL GAS TERMINALS MARKET SIZE ESTIMATES
    218. & FORECAST, BY APPLICATION, 2019-2032 (USD BILLIONS)
    219. AMERICA FLOATING LIQUEFIED NATURAL GAS TERMINALS MARKET SIZE ESTIMATES & FORECAST,
    220. BY END USE, 2019-2032 (USD BILLIONS)
    221. NATURAL GAS TERMINALS MARKET SIZE ESTIMATES & FORECAST, BY OWNERSHIP, 2019-2032
    222. (USD BILLIONS)
    223. MARKET SIZE ESTIMATES & FORECAST, BY REGIONAL, 2019-2032 (USD BILLIONS)
    224. & FORECAST, BY TERMINAL TYPE, 2019-2032 (USD BILLIONS)
    225. FLOATING LIQUEFIED NATURAL GAS TERMINALS MARKET SIZE ESTIMATES & FORECAST, BY
    226. APPLICATION, 2019-2032 (USD BILLIONS)
    227. NATURAL GAS TERMINALS MARKET SIZE ESTIMATES & FORECAST, BY END USE, 2019-2032
    228. (USD BILLIONS)
    229. MARKET SIZE ESTIMATES & FORECAST, BY OWNERSHIP, 2019-2032 (USD BILLIONS)
    230. & FORECAST, BY REGIONAL, 2019-2032 (USD BILLIONS)
    231. LIQUEFIED NATURAL GAS TERMINALS MARKET SIZE ESTIMATES & FORECAST, BY TERMINAL
    232. TYPE, 2019-2032 (USD BILLIONS)
    233. GAS TERMINALS MARKET SIZE ESTIMATES & FORECAST, BY APPLICATION, 2019-2032 (USD
    234. BILLIONS)
    235. SIZE ESTIMATES & FORECAST, BY END USE, 2019-2032 (USD BILLIONS)
    236. MEXICO FLOATING LIQUEFIED NATURAL GAS TERMINALS MARKET SIZE ESTIMATES &
    237. FORECAST, BY OWNERSHIP, 2019-2032 (USD BILLIONS)
    238. LIQUEFIED NATURAL GAS TERMINALS MARKET SIZE ESTIMATES & FORECAST, BY REGIONAL,
    239. 2032 (USD BILLIONS)
    240. TERMINALS MARKET SIZE ESTIMATES & FORECAST, BY TERMINAL TYPE, 2019-2032 (USD
    241. BILLIONS)
    242. SIZE ESTIMATES & FORECAST, BY APPLICATION, 2019-2032 (USD BILLIONS)
    243. ARGENTINA FLOATING LIQUEFIED NATURAL GAS TERMINALS MARKET SIZE ESTIMATES &
    244. FORECAST, BY END USE, 2019-2032 (USD BILLIONS)
    245. LIQUEFIED NATURAL GAS TERMINALS MARKET SIZE ESTIMATES & FORECAST, BY OWNERSHIP,
    246. 2032 (USD BILLIONS)
    247. TERMINALS MARKET SIZE ESTIMATES & FORECAST, BY REGIONAL, 2019-2032 (USD BILLIONS)
    248. MARKET SIZE ESTIMATES & FORECAST, BY TERMINAL TYPE, 2019-2032 (USD BILLIONS)
    249. MARKET SIZE ESTIMATES & FORECAST, BY APPLICATION, 2019-2032 (USD BILLIONS)
    250. SIZE ESTIMATES & FORECAST, BY END USE, 2019-2032 (USD BILLIONS)
    251. REST OF SOUTH AMERICA FLOATING LIQUEFIED NATURAL GAS TERMINALS MARKET SIZE
    252. ESTIMATES & FORECAST, BY OWNERSHIP, 2019-2032 (USD BILLIONS)
    253. REST OF SOUTH AMERICA FLOATING LIQUEFIED NATURAL GAS TERMINALS MARKET SIZE ESTIMATES
    254. & FORECAST, BY REGIONAL, 2019-2032 (USD BILLIONS)
    255. LIQUEFIED NATURAL GAS TERMINALS MARKET SIZE ESTIMATES & FORECAST, BY TERMINAL
    256. TYPE, 2019-2032 (USD BILLIONS)
    257. TERMINALS MARKET SIZE ESTIMATES & FORECAST, BY APPLICATION, 2019-2032 (USD BILLIONS)
    258. & FORECAST, BY END USE, 2019-2032 (USD BILLIONS)
    259. LIQUEFIED NATURAL GAS TERMINALS MARKET SIZE ESTIMATES & FORECAST, BY OWNERSHIP,
    260. 2032 (USD BILLIONS)
    261. MARKET SIZE ESTIMATES & FORECAST, BY REGIONAL, 2019-2032 (USD BILLIONS)
    262. ESTIMATES & FORECAST, BY TERMINAL TYPE, 2019-2032 (USD BILLIONS)
    263. GCC COUNTRIES FLOATING LIQUEFIED NATURAL GAS TERMINALS MARKET SIZE ESTIMATES
    264. & FORECAST, BY APPLICATION, 2019-2032 (USD BILLIONS)
    265. FLOATING LIQUEFIED NATURAL GAS TERMINALS MARKET SIZE ESTIMATES & FORECAST, BY
    266. END USE, 2019-2032 (USD BILLIONS)
    267. NATURAL GAS TERMINALS MARKET SIZE ESTIMATES & FORECAST, BY OWNERSHIP, 2019-2032
    268. (USD BILLIONS)
    269. MARKET SIZE ESTIMATES & FORECAST, BY REGIONAL, 2019-2032 (USD BILLIONS)
    270. & FORECAST, BY TERMINAL TYPE, 2019-2032 (USD BILLIONS)
    271. AFRICA FLOATING LIQUEFIED NATURAL GAS TERMINALS MARKET SIZE ESTIMATES & FORECAST,
    272. BY APPLICATION, 2019-2032 (USD BILLIONS)
    273. LIQUEFIED NATURAL GAS TERMINALS MARKET SIZE ESTIMATES & FORECAST, BY END USE,
    274. 2032 (USD BILLIONS)
    275. GAS TERMINALS MARKET SIZE ESTIMATES & FORECAST, BY OWNERSHIP, 2019-2032 (USD
    276. BILLIONS)
    277. MARKET SIZE ESTIMATES & FORECAST, BY REGIONAL, 2019-2032 (USD BILLIONS)
    278. & FORECAST, BY TERMINAL TYPE, 2019-2032 (USD BILLIONS)
    279. OF MEA FLOATING LIQUEFIED NATURAL GAS TERMINALS MARKET SIZE ESTIMATES & FORECAST,
    280. BY APPLICATION, 2019-2032 (USD BILLIONS)
    281. NATURAL GAS TERMINALS MARKET SIZE ESTIMATES & FORECAST, BY END USE, 2019-2032
    282. (USD BILLIONS)
    283. MARKET SIZE ESTIMATES & FORECAST, BY OWNERSHIP, 2019-2032 (USD BILLIONS)
    284. & FORECAST, BY REGIONAL, 2019-2032 (USD BILLIONS)
    285. DEVELOPMENT/APPROVAL
    286. LIQUEFIED NATURAL GAS TERMINALS MARKET ANALYSIS
    287. NATURAL GAS TERMINALS MARKET ANALYSIS BY TERMINAL TYPE
    288. LIQUEFIED NATURAL GAS TERMINALS MARKET ANALYSIS BY APPLICATION
    289. FLOATING LIQUEFIED NATURAL GAS TERMINALS MARKET ANALYSIS BY END USE
    290. US FLOATING LIQUEFIED NATURAL GAS TERMINALS MARKET ANALYSIS BY OWNERSHIP
    291. BY TERMINAL TYPE
    292. MARKET ANALYSIS BY APPLICATION
    293. GAS TERMINALS MARKET ANALYSIS BY END USE
    294. NATURAL GAS TERMINALS MARKET ANALYSIS BY OWNERSHIP
    295. LIQUEFIED NATURAL GAS TERMINALS MARKET ANALYSIS BY REGIONAL
    296. FLOATING LIQUEFIED NATURAL GAS TERMINALS MARKET ANALYSIS
    297. FLOATING LIQUEFIED NATURAL GAS TERMINALS MARKET ANALYSIS BY TERMINAL TYPE
    298. GERMANY FLOATING LIQUEFIED NATURAL GAS TERMINALS MARKET ANALYSIS BY APPLICATION
    299. BY END USE
    300. ANALYSIS BY OWNERSHIP
    301. MARKET ANALYSIS BY REGIONAL
    302. MARKET ANALYSIS BY TERMINAL TYPE
    303. GAS TERMINALS MARKET ANALYSIS BY APPLICATION
    304. NATURAL GAS TERMINALS MARKET ANALYSIS BY END USE
    305. NATURAL GAS TERMINALS MARKET ANALYSIS BY OWNERSHIP
    306. LIQUEFIED NATURAL GAS TERMINALS MARKET ANALYSIS BY REGIONAL
    307. FLOATING LIQUEFIED NATURAL GAS TERMINALS MARKET ANALYSIS BY TERMINAL TYPE
    308. FRANCE FLOATING LIQUEFIED NATURAL GAS TERMINALS MARKET ANALYSIS BY APPLICATION
    309. BY END USE
    310. ANALYSIS BY OWNERSHIP
    311. MARKET ANALYSIS BY REGIONAL
    312. TERMINALS MARKET ANALYSIS BY TERMINAL TYPE
    313. NATURAL GAS TERMINALS MARKET ANALYSIS BY APPLICATION
    314. LIQUEFIED NATURAL GAS TERMINALS MARKET ANALYSIS BY END USE
    315. FLOATING LIQUEFIED NATURAL GAS TERMINALS MARKET ANALYSIS BY OWNERSHIP
    316. RUSSIA FLOATING LIQUEFIED NATURAL GAS TERMINALS MARKET ANALYSIS BY REGIONAL
    317. BY TERMINAL TYPE
    318. MARKET ANALYSIS BY APPLICATION
    319. GAS TERMINALS MARKET ANALYSIS BY END USE
    320. NATURAL GAS TERMINALS MARKET ANALYSIS BY OWNERSHIP
    321. LIQUEFIED NATURAL GAS TERMINALS MARKET ANALYSIS BY REGIONAL
    322. FLOATING LIQUEFIED NATURAL GAS TERMINALS MARKET ANALYSIS BY TERMINAL TYPE
    323. SPAIN FLOATING LIQUEFIED NATURAL GAS TERMINALS MARKET ANALYSIS BY APPLICATION
    324. BY END USE
    325. ANALYSIS BY OWNERSHIP
    326. MARKET ANALYSIS BY REGIONAL
    327. GAS TERMINALS MARKET ANALYSIS BY TERMINAL TYPE
    328. LIQUEFIED NATURAL GAS TERMINALS MARKET ANALYSIS BY APPLICATION
    329. REST OF EUROPE FLOATING LIQUEFIED NATURAL GAS TERMINALS MARKET ANALYSIS BY END USE
    330. ANALYSIS BY OWNERSHIP
    331. GAS TERMINALS MARKET ANALYSIS BY REGIONAL
    332. NATURAL GAS TERMINALS MARKET ANALYSIS
    333. NATURAL GAS TERMINALS MARKET ANALYSIS BY TERMINAL TYPE
    334. LIQUEFIED NATURAL GAS TERMINALS MARKET ANALYSIS BY APPLICATION
    335. CHINA FLOATING LIQUEFIED NATURAL GAS TERMINALS MARKET ANALYSIS BY END USE
    336. CHINA FLOATING LIQUEFIED NATURAL GAS TERMINALS MARKET ANALYSIS BY OWNERSHIP
    337. BY REGIONAL
    338. ANALYSIS BY TERMINAL TYPE
    339. TERMINALS MARKET ANALYSIS BY APPLICATION
    340. NATURAL GAS TERMINALS MARKET ANALYSIS BY END USE
    341. LIQUEFIED NATURAL GAS TERMINALS MARKET ANALYSIS BY OWNERSHIP
    342. FLOATING LIQUEFIED NATURAL GAS TERMINALS MARKET ANALYSIS BY REGIONAL
    343. JAPAN FLOATING LIQUEFIED NATURAL GAS TERMINALS MARKET ANALYSIS BY TERMINAL TYPE
    344. BY APPLICATION
    345. ANALYSIS BY END USE
    346. MARKET ANALYSIS BY OWNERSHIP
    347. TERMINALS MARKET ANALYSIS BY REGIONAL
    348. NATURAL GAS TERMINALS MARKET ANALYSIS BY TERMINAL TYPE
    349. FLOATING LIQUEFIED NATURAL GAS TERMINALS MARKET ANALYSIS BY APPLICATION
    350. SOUTH KOREA FLOATING LIQUEFIED NATURAL GAS TERMINALS MARKET ANALYSIS BY END
    351. USE
    352. ANALYSIS BY OWNERSHIP
    353. TERMINALS MARKET ANALYSIS BY REGIONAL
    354. NATURAL GAS TERMINALS MARKET ANALYSIS BY TERMINAL TYPE
    355. FLOATING LIQUEFIED NATURAL GAS TERMINALS MARKET ANALYSIS BY APPLICATION
    356. MALAYSIA FLOATING LIQUEFIED NATURAL GAS TERMINALS MARKET ANALYSIS BY END USE
    357. BY OWNERSHIP
    358. MARKET ANALYSIS BY REGIONAL
    359. GAS TERMINALS MARKET ANALYSIS BY TERMINAL TYPE
    360. LIQUEFIED NATURAL GAS TERMINALS MARKET ANALYSIS BY APPLICATION
    361. THAILAND FLOATING LIQUEFIED NATURAL GAS TERMINALS MARKET ANALYSIS BY END USE
    362. OWNERSHIP
    363. ANALYSIS BY REGIONAL
    364. MARKET ANALYSIS BY TERMINAL TYPE
    365. GAS TERMINALS MARKET ANALYSIS BY APPLICATION
    366. LIQUEFIED NATURAL GAS TERMINALS MARKET ANALYSIS BY END USE
    367. FLOATING LIQUEFIED NATURAL GAS TERMINALS MARKET ANALYSIS BY OWNERSHIP
    368. INDONESIA FLOATING LIQUEFIED NATURAL GAS TERMINALS MARKET ANALYSIS BY REGIONAL
    369. BY TERMINAL TYPE
    370. MARKET ANALYSIS BY APPLICATION
    371. NATURAL GAS TERMINALS MARKET ANALYSIS BY END USE
    372. LIQUEFIED NATURAL GAS TERMINALS MARKET ANALYSIS BY OWNERSHIP
    373. OF APAC FLOATING LIQUEFIED NATURAL GAS TERMINALS MARKET ANALYSIS BY REGIONAL
    374. BY TERMINAL TYPE
    375. MARKET ANALYSIS BY APPLICATION
    376. GAS TERMINALS MARKET ANALYSIS BY END USE
    377. NATURAL GAS TERMINALS MARKET ANALYSIS BY OWNERSHIP
    378. LIQUEFIED NATURAL GAS TERMINALS MARKET ANALYSIS BY REGIONAL
    379. FLOATING LIQUEFIED NATURAL GAS TERMINALS MARKET ANALYSIS BY TERMINAL TYPE
    380. MEXICO FLOATING LIQUEFIED NATURAL GAS TERMINALS MARKET ANALYSIS BY APPLICATION
    381. BY END USE
    382. ANALYSIS BY OWNERSHIP
    383. MARKET ANALYSIS BY REGIONAL
    384. GAS TERMINALS MARKET ANALYSIS BY TERMINAL TYPE
    385. LIQUEFIED NATURAL GAS TERMINALS MARKET ANALYSIS BY APPLICATION
    386. ARGENTINA FLOATING LIQUEFIED NATURAL GAS TERMINALS MARKET ANALYSIS BY END USE
    387. BY OWNERSHIP
    388. MARKET ANALYSIS BY REGIONAL
    389. NATURAL GAS TERMINALS MARKET ANALYSIS BY TERMINAL TYPE
    390. SOUTH AMERICA FLOATING LIQUEFIED NATURAL GAS TERMINALS MARKET ANALYSIS BY APPLICATION
    391. MARKET ANALYSIS BY END USE
    392. NATURAL GAS TERMINALS MARKET ANALYSIS BY OWNERSHIP
    393. AMERICA FLOATING LIQUEFIED NATURAL GAS TERMINALS MARKET ANALYSIS BY REGIONAL
    394. GCC COUNTRIES FLOATING LIQUEFIED NATURAL GAS TERMINALS MARKET ANALYSIS BY TERMINAL
    395. TYPE
    396. ANALYSIS BY APPLICATION
    397. GAS TERMINALS MARKET ANALYSIS BY END USE
    398. LIQUEFIED NATURAL GAS TERMINALS MARKET ANALYSIS BY OWNERSHIP
    399. COUNTRIES FLOATING LIQUEFIED NATURAL GAS TERMINALS MARKET ANALYSIS BY REGIONAL
    400. BY TERMINAL TYPE
    401. MARKET ANALYSIS BY APPLICATION
    402. NATURAL GAS TERMINALS MARKET ANALYSIS BY END USE
    403. FLOATING LIQUEFIED NATURAL GAS TERMINALS MARKET ANALYSIS BY OWNERSHIP
    404. SOUTH AFRICA FLOATING LIQUEFIED NATURAL GAS TERMINALS MARKET ANALYSIS BY REGIONAL
    405. BY TERMINAL TYPE
    406. MARKET ANALYSIS BY APPLICATION
    407. NATURAL GAS TERMINALS MARKET ANALYSIS BY END USE
    408. LIQUEFIED NATURAL GAS TERMINALS MARKET ANALYSIS BY OWNERSHIP
    409. OF MEA FLOATING LIQUEFIED NATURAL GAS TERMINALS MARKET ANALYSIS BY REGIONAL
    410. LIQUEFIED NATURAL GAS TERMINALS MARKET
    411. FLOATING LIQUEFIED NATURAL GAS TERMINALS MARKET
    412. ANALYSIS: FLOATING LIQUEFIED NATURAL GAS TERMINALS MARKET
    413. / VALUE CHAIN: FLOATING LIQUEFIED NATURAL GAS TERMINALS MARKET
    414. FLOATING LIQUEFIED NATURAL GAS TERMINALS MARKET, BY TERMINAL TYPE, 2024 (% SHARE)
    415. TO 2032 (USD Billions)
    416. MARKET, BY APPLICATION, 2024 (% SHARE)
    417. GAS TERMINALS MARKET, BY APPLICATION, 2019 TO 2032 (USD Billions)
    418. FLOATING LIQUEFIED NATURAL GAS TERMINALS MARKET, BY END USE, 2024 (% SHARE)
    419. TO 2032 (USD Billions)
    420. MARKET, BY OWNERSHIP, 2024 (% SHARE)
    421. GAS TERMINALS MARKET, BY OWNERSHIP, 2019 TO 2032 (USD Billions)
    422. FLOATING LIQUEFIED NATURAL GAS TERMINALS MARKET, BY REGIONAL, 2024 (% SHARE)
    423. TO 2032 (USD Billions)

    Floating Liquefied Natural Gas Terminals Market Segmentation

    • Floating Liquefied Natural Gas Terminals Market By Terminal Type (USD Billion, 2019-2032)
      • Floating Storage and Regasification Unit
      • Floating Storage Unit
      • Floating Liquefied Natural Gas Terminal


    • Floating Liquefied Natural Gas Terminals Market By Application (USD Billion, 2019-2032)
      • Regasification
      • Storage
      • Export


    • Floating Liquefied Natural Gas Terminals Market By End Use (USD Billion, 2019-2032)
      • Power Generation
      • Industrial
      • Commercial


    • Floating Liquefied Natural Gas Terminals Market By Ownership (USD Billion, 2019-2032)
      • Private
      • Public
      • Joint Venture


    • Floating Liquefied Natural Gas Terminals Market By Regional (USD Billion, 2019-2032)
      • North America
      • Europe
      • South America
      • Asia Pacific
      • Middle East and Africa


    Floating Liquefied Natural Gas Terminals Market Regional Outlook (USD Billion, 2019-2032)


    • North America Outlook (USD Billion, 2019-2032)
      • North America Floating Liquefied Natural Gas Terminals Market by Terminal Type
        • Floating Storage and Regasification Unit
        • Floating Storage Unit
        • Floating Liquefied Natural Gas Terminal
      • North America Floating Liquefied Natural Gas Terminals Market by Application Type
        • Regasification
        • Storage
        • Export
      • North America Floating Liquefied Natural Gas Terminals Market by End Use Type
        • Power Generation
        • Industrial
        • Commercial
      • North America Floating Liquefied Natural Gas Terminals Market by Ownership Type
        • Private
        • Public
        • Joint Venture
      • North America Floating Liquefied Natural Gas Terminals Market by Regional Type
        • US
        • Canada
      • US Outlook (USD Billion, 2019-2032)
      • US Floating Liquefied Natural Gas Terminals Market by Terminal Type
        • Floating Storage and Regasification Unit
        • Floating Storage Unit
        • Floating Liquefied Natural Gas Terminal
      • US Floating Liquefied Natural Gas Terminals Market by Application Type
        • Regasification
        • Storage
        • Export
      • US Floating Liquefied Natural Gas Terminals Market by End Use Type
        • Power Generation
        • Industrial
        • Commercial
      • US Floating Liquefied Natural Gas Terminals Market by Ownership Type
        • Private
        • Public
        • Joint Venture
      • CANADA Outlook (USD Billion, 2019-2032)
      • CANADA Floating Liquefied Natural Gas Terminals Market by Terminal Type
        • Floating Storage and Regasification Unit
        • Floating Storage Unit
        • Floating Liquefied Natural Gas Terminal
      • CANADA Floating Liquefied Natural Gas Terminals Market by Application Type
        • Regasification
        • Storage
        • Export
      • CANADA Floating Liquefied Natural Gas Terminals Market by End Use Type
        • Power Generation
        • Industrial
        • Commercial
      • CANADA Floating Liquefied Natural Gas Terminals Market by Ownership Type
        • Private
        • Public
        • Joint Venture
      • Europe Outlook (USD Billion, 2019-2032)
        • Europe Floating Liquefied Natural Gas Terminals Market by Terminal Type
          • Floating Storage and Regasification Unit
          • Floating Storage Unit
          • Floating Liquefied Natural Gas Terminal
        • Europe Floating Liquefied Natural Gas Terminals Market by Application Type
          • Regasification
          • Storage
          • Export
        • Europe Floating Liquefied Natural Gas Terminals Market by End Use Type
          • Power Generation
          • Industrial
          • Commercial
        • Europe Floating Liquefied Natural Gas Terminals Market by Ownership Type
          • Private
          • Public
          • Joint Venture
        • Europe Floating Liquefied Natural Gas Terminals Market by Regional Type
          • Germany
          • UK
          • France
          • Russia
          • Italy
          • Spain
          • Rest of Europe
        • GERMANY Outlook (USD Billion, 2019-2032)
        • GERMANY Floating Liquefied Natural Gas Terminals Market by Terminal Type
          • Floating Storage and Regasification Unit
          • Floating Storage Unit
          • Floating Liquefied Natural Gas Terminal
        • GERMANY Floating Liquefied Natural Gas Terminals Market by Application Type
          • Regasification
          • Storage
          • Export
        • GERMANY Floating Liquefied Natural Gas Terminals Market by End Use Type
          • Power Generation
          • Industrial
          • Commercial
        • GERMANY Floating Liquefied Natural Gas Terminals Market by Ownership Type
          • Private
          • Public
          • Joint Venture
        • UK Outlook (USD Billion, 2019-2032)
        • UK Floating Liquefied Natural Gas Terminals Market by Terminal Type
          • Floating Storage and Regasification Unit
          • Floating Storage Unit
          • Floating Liquefied Natural Gas Terminal
        • UK Floating Liquefied Natural Gas Terminals Market by Application Type
          • Regasification
          • Storage
          • Export
        • UK Floating Liquefied Natural Gas Terminals Market by End Use Type
          • Power Generation
          • Industrial
          • Commercial
        • UK Floating Liquefied Natural Gas Terminals Market by Ownership Type
          • Private
          • Public
          • Joint Venture
        • FRANCE Outlook (USD Billion, 2019-2032)
        • FRANCE Floating Liquefied Natural Gas Terminals Market by Terminal Type
          • Floating Storage and Regasification Unit
          • Floating Storage Unit
          • Floating Liquefied Natural Gas Terminal
        • FRANCE Floating Liquefied Natural Gas Terminals Market by Application Type
          • Regasification
          • Storage
          • Export
        • FRANCE Floating Liquefied Natural Gas Terminals Market by End Use Type
          • Power Generation
          • Industrial
          • Commercial
        • FRANCE Floating Liquefied Natural Gas Terminals Market by Ownership Type
          • Private
          • Public
          • Joint Venture
        • RUSSIA Outlook (USD Billion, 2019-2032)
        • RUSSIA Floating Liquefied Natural Gas Terminals Market by Terminal Type
          • Floating Storage and Regasification Unit
          • Floating Storage Unit
          • Floating Liquefied Natural Gas Terminal
        • RUSSIA Floating Liquefied Natural Gas Terminals Market by Application Type
          • Regasification
          • Storage
          • Export
        • RUSSIA Floating Liquefied Natural Gas Terminals Market by End Use Type
          • Power Generation
          • Industrial
          • Commercial
        • RUSSIA Floating Liquefied Natural Gas Terminals Market by Ownership Type
          • Private
          • Public
          • Joint Venture
        • ITALY Outlook (USD Billion, 2019-2032)
        • ITALY Floating Liquefied Natural Gas Terminals Market by Terminal Type
          • Floating Storage and Regasification Unit
          • Floating Storage Unit
          • Floating Liquefied Natural Gas Terminal
        • ITALY Floating Liquefied Natural Gas Terminals Market by Application Type
          • Regasification
          • Storage
          • Export
        • ITALY Floating Liquefied Natural Gas Terminals Market by End Use Type
          • Power Generation
          • Industrial
          • Commercial
        • ITALY Floating Liquefied Natural Gas Terminals Market by Ownership Type
          • Private
          • Public
          • Joint Venture
        • SPAIN Outlook (USD Billion, 2019-2032)
        • SPAIN Floating Liquefied Natural Gas Terminals Market by Terminal Type
          • Floating Storage and Regasification Unit
          • Floating Storage Unit
          • Floating Liquefied Natural Gas Terminal
        • SPAIN Floating Liquefied Natural Gas Terminals Market by Application Type
          • Regasification
          • Storage
          • Export
        • SPAIN Floating Liquefied Natural Gas Terminals Market by End Use Type
          • Power Generation
          • Industrial
          • Commercial
        • SPAIN Floating Liquefied Natural Gas Terminals Market by Ownership Type
          • Private
          • Public
          • Joint Venture
        • REST OF EUROPE Outlook (USD Billion, 2019-2032)
        • REST OF EUROPE Floating Liquefied Natural Gas Terminals Market by Terminal Type
          • Floating Storage and Regasification Unit
          • Floating Storage Unit
          • Floating Liquefied Natural Gas Terminal
        • REST OF EUROPE Floating Liquefied Natural Gas Terminals Market by Application Type
          • Regasification
          • Storage
          • Export
        • REST OF EUROPE Floating Liquefied Natural Gas Terminals Market by End Use Type
          • Power Generation
          • Industrial
          • Commercial
        • REST OF EUROPE Floating Liquefied Natural Gas Terminals Market by Ownership Type
          • Private
          • Public
          • Joint Venture
        • APAC Outlook (USD Billion, 2019-2032)
          • APAC Floating Liquefied Natural Gas Terminals Market by Terminal Type
            • Floating Storage and Regasification Unit
            • Floating Storage Unit
            • Floating Liquefied Natural Gas Terminal
          • APAC Floating Liquefied Natural Gas Terminals Market by Application Type
            • Regasification
            • Storage
            • Export
          • APAC Floating Liquefied Natural Gas Terminals Market by End Use Type
            • Power Generation
            • Industrial
            • Commercial
          • APAC Floating Liquefied Natural Gas Terminals Market by Ownership Type
            • Private
            • Public
            • Joint Venture
          • APAC Floating Liquefied Natural Gas Terminals Market by Regional Type
            • China
            • India
            • Japan
            • South Korea
            • Malaysia
            • Thailand
            • Indonesia
            • Rest of APAC
          • CHINA Outlook (USD Billion, 2019-2032)
          • CHINA Floating Liquefied Natural Gas Terminals Market by Terminal Type
            • Floating Storage and Regasification Unit
            • Floating Storage Unit
            • Floating Liquefied Natural Gas Terminal
          • CHINA Floating Liquefied Natural Gas Terminals Market by Application Type
            • Regasification
            • Storage
            • Export
          • CHINA Floating Liquefied Natural Gas Terminals Market by End Use Type
            • Power Generation
            • Industrial
            • Commercial
          • CHINA Floating Liquefied Natural Gas Terminals Market by Ownership Type
            • Private
            • Public
            • Joint Venture
          • INDIA Outlook (USD Billion, 2019-2032)
          • INDIA Floating Liquefied Natural Gas Terminals Market by Terminal Type
            • Floating Storage and Regasification Unit
            • Floating Storage Unit
            • Floating Liquefied Natural Gas Terminal
          • INDIA Floating Liquefied Natural Gas Terminals Market by Application Type
            • Regasification
            • Storage
            • Export
          • INDIA Floating Liquefied Natural Gas Terminals Market by End Use Type
            • Power Generation
            • Industrial
            • Commercial
          • INDIA Floating Liquefied Natural Gas Terminals Market by Ownership Type
            • Private
            • Public
            • Joint Venture
          • JAPAN Outlook (USD Billion, 2019-2032)
          • JAPAN Floating Liquefied Natural Gas Terminals Market by Terminal Type
            • Floating Storage and Regasification Unit
            • Floating Storage Unit
            • Floating Liquefied Natural Gas Terminal
          • JAPAN Floating Liquefied Natural Gas Terminals Market by Application Type
            • Regasification
            • Storage
            • Export
          • JAPAN Floating Liquefied Natural Gas Terminals Market by End Use Type
            • Power Generation
            • Industrial
            • Commercial
          • JAPAN Floating Liquefied Natural Gas Terminals Market by Ownership Type
            • Private
            • Public
            • Joint Venture
          • SOUTH KOREA Outlook (USD Billion, 2019-2032)
          • SOUTH KOREA Floating Liquefied Natural Gas Terminals Market by Terminal Type
            • Floating Storage and Regasification Unit
            • Floating Storage Unit
            • Floating Liquefied Natural Gas Terminal
          • SOUTH KOREA Floating Liquefied Natural Gas Terminals Market by Application Type
            • Regasification
            • Storage
            • Export
          • SOUTH KOREA Floating Liquefied Natural Gas Terminals Market by End Use Type
            • Power Generation
            • Industrial
            • Commercial
          • SOUTH KOREA Floating Liquefied Natural Gas Terminals Market by Ownership Type
            • Private
            • Public
            • Joint Venture
          • MALAYSIA Outlook (USD Billion, 2019-2032)
          • MALAYSIA Floating Liquefied Natural Gas Terminals Market by Terminal Type
            • Floating Storage and Regasification Unit
            • Floating Storage Unit
            • Floating Liquefied Natural Gas Terminal
          • MALAYSIA Floating Liquefied Natural Gas Terminals Market by Application Type
            • Regasification
            • Storage
            • Export
          • MALAYSIA Floating Liquefied Natural Gas Terminals Market by End Use Type
            • Power Generation
            • Industrial
            • Commercial
          • MALAYSIA Floating Liquefied Natural Gas Terminals Market by Ownership Type
            • Private
            • Public
            • Joint Venture
          • THAILAND Outlook (USD Billion, 2019-2032)
          • THAILAND Floating Liquefied Natural Gas Terminals Market by Terminal Type
            • Floating Storage and Regasification Unit
            • Floating Storage Unit
            • Floating Liquefied Natural Gas Terminal
          • THAILAND Floating Liquefied Natural Gas Terminals Market by Application Type
            • Regasification
            • Storage
            • Export
          • THAILAND Floating Liquefied Natural Gas Terminals Market by End Use Type
            • Power Generation
            • Industrial
            • Commercial
          • THAILAND Floating Liquefied Natural Gas Terminals Market by Ownership Type
            • Private
            • Public
            • Joint Venture
          • INDONESIA Outlook (USD Billion, 2019-2032)
          • INDONESIA Floating Liquefied Natural Gas Terminals Market by Terminal Type
            • Floating Storage and Regasification Unit
            • Floating Storage Unit
            • Floating Liquefied Natural Gas Terminal
          • INDONESIA Floating Liquefied Natural Gas Terminals Market by Application Type
            • Regasification
            • Storage
            • Export
          • INDONESIA Floating Liquefied Natural Gas Terminals Market by End Use Type
            • Power Generation
            • Industrial
            • Commercial
          • INDONESIA Floating Liquefied Natural Gas Terminals Market by Ownership Type
            • Private
            • Public
            • Joint Venture
          • REST OF APAC Outlook (USD Billion, 2019-2032)
          • REST OF APAC Floating Liquefied Natural Gas Terminals Market by Terminal Type
            • Floating Storage and Regasification Unit
            • Floating Storage Unit
            • Floating Liquefied Natural Gas Terminal
          • REST OF APAC Floating Liquefied Natural Gas Terminals Market by Application Type
            • Regasification
            • Storage
            • Export
          • REST OF APAC Floating Liquefied Natural Gas Terminals Market by End Use Type
            • Power Generation
            • Industrial
            • Commercial
          • REST OF APAC Floating Liquefied Natural Gas Terminals Market by Ownership Type
            • Private
            • Public
            • Joint Venture
          • South America Outlook (USD Billion, 2019-2032)
            • South America Floating Liquefied Natural Gas Terminals Market by Terminal Type
              • Floating Storage and Regasification Unit
              • Floating Storage Unit
              • Floating Liquefied Natural Gas Terminal
            • South America Floating Liquefied Natural Gas Terminals Market by Application Type
              • Regasification
              • Storage
              • Export
            • South America Floating Liquefied Natural Gas Terminals Market by End Use Type
              • Power Generation
              • Industrial
              • Commercial
            • South America Floating Liquefied Natural Gas Terminals Market by Ownership Type
              • Private
              • Public
              • Joint Venture
            • South America Floating Liquefied Natural Gas Terminals Market by Regional Type
              • Brazil
              • Mexico
              • Argentina
              • Rest of South America
            • BRAZIL Outlook (USD Billion, 2019-2032)
            • BRAZIL Floating Liquefied Natural Gas Terminals Market by Terminal Type
              • Floating Storage and Regasification Unit
              • Floating Storage Unit
              • Floating Liquefied Natural Gas Terminal
            • BRAZIL Floating Liquefied Natural Gas Terminals Market by Application Type
              • Regasification
              • Storage
              • Export
            • BRAZIL Floating Liquefied Natural Gas Terminals Market by End Use Type
              • Power Generation
              • Industrial
              • Commercial
            • BRAZIL Floating Liquefied Natural Gas Terminals Market by Ownership Type
              • Private
              • Public
              • Joint Venture
            • MEXICO Outlook (USD Billion, 2019-2032)
            • MEXICO Floating Liquefied Natural Gas Terminals Market by Terminal Type
              • Floating Storage and Regasification Unit
              • Floating Storage Unit
              • Floating Liquefied Natural Gas Terminal
            • MEXICO Floating Liquefied Natural Gas Terminals Market by Application Type
              • Regasification
              • Storage
              • Export
            • MEXICO Floating Liquefied Natural Gas Terminals Market by End Use Type
              • Power Generation
              • Industrial
              • Commercial
            • MEXICO Floating Liquefied Natural Gas Terminals Market by Ownership Type
              • Private
              • Public
              • Joint Venture
            • ARGENTINA Outlook (USD Billion, 2019-2032)
            • ARGENTINA Floating Liquefied Natural Gas Terminals Market by Terminal Type
              • Floating Storage and Regasification Unit
              • Floating Storage Unit
              • Floating Liquefied Natural Gas Terminal
            • ARGENTINA Floating Liquefied Natural Gas Terminals Market by Application Type
              • Regasification
              • Storage
              • Export
            • ARGENTINA Floating Liquefied Natural Gas Terminals Market by End Use Type
              • Power Generation
              • Industrial
              • Commercial
            • ARGENTINA Floating Liquefied Natural Gas Terminals Market by Ownership Type
              • Private
              • Public
              • Joint Venture
            • REST OF SOUTH AMERICA Outlook (USD Billion, 2019-2032)
            • REST OF SOUTH AMERICA Floating Liquefied Natural Gas Terminals Market by Terminal Type
              • Floating Storage and Regasification Unit
              • Floating Storage Unit
              • Floating Liquefied Natural Gas Terminal
            • REST OF SOUTH AMERICA Floating Liquefied Natural Gas Terminals Market by Application Type
              • Regasification
              • Storage
              • Export
            • REST OF SOUTH AMERICA Floating Liquefied Natural Gas Terminals Market by End Use Type
              • Power Generation
              • Industrial
              • Commercial
            • REST OF SOUTH AMERICA Floating Liquefied Natural Gas Terminals Market by Ownership Type
              • Private
              • Public
              • Joint Venture
            • MEA Outlook (USD Billion, 2019-2032)
              • MEA Floating Liquefied Natural Gas Terminals Market by Terminal Type
                • Floating Storage and Regasification Unit
                • Floating Storage Unit
                • Floating Liquefied Natural Gas Terminal
              • MEA Floating Liquefied Natural Gas Terminals Market by Application Type
                • Regasification
                • Storage
                • Export
              • MEA Floating Liquefied Natural Gas Terminals Market by End Use Type
                • Power Generation
                • Industrial
                • Commercial
              • MEA Floating Liquefied Natural Gas Terminals Market by Ownership Type
                • Private
                • Public
                • Joint Venture
              • MEA Floating Liquefied Natural Gas Terminals Market by Regional Type
                • GCC Countries
                • South Africa
                • Rest of MEA
              • GCC COUNTRIES Outlook (USD Billion, 2019-2032)
              • GCC COUNTRIES Floating Liquefied Natural Gas Terminals Market by Terminal Type
                • Floating Storage and Regasification Unit
                • Floating Storage Unit
                • Floating Liquefied Natural Gas Terminal
              • GCC COUNTRIES Floating Liquefied Natural Gas Terminals Market by Application Type
                • Regasification
                • Storage
                • Export
              • GCC COUNTRIES Floating Liquefied Natural Gas Terminals Market by End Use Type
                • Power Generation
                • Industrial
                • Commercial
              • GCC COUNTRIES Floating Liquefied Natural Gas Terminals Market by Ownership Type
                • Private
                • Public
                • Joint Venture
              • SOUTH AFRICA Outlook (USD Billion, 2019-2032)
              • SOUTH AFRICA Floating Liquefied Natural Gas Terminals Market by Terminal Type
                • Floating Storage and Regasification Unit
                • Floating Storage Unit
                • Floating Liquefied Natural Gas Terminal
              • SOUTH AFRICA Floating Liquefied Natural Gas Terminals Market by Application Type
                • Regasification
                • Storage
                • Export
              • SOUTH AFRICA Floating Liquefied Natural Gas Terminals Market by End Use Type
                • Power Generation
                • Industrial
                • Commercial
              • SOUTH AFRICA Floating Liquefied Natural Gas Terminals Market by Ownership Type
                • Private
                • Public
                • Joint Venture
              • REST OF MEA Outlook (USD Billion, 2019-2032)
              • REST OF MEA Floating Liquefied Natural Gas Terminals Market by Terminal Type
                • Floating Storage and Regasification Unit
                • Floating Storage Unit
                • Floating Liquefied Natural Gas Terminal
              • REST OF MEA Floating Liquefied Natural Gas Terminals Market by Application Type
                • Regasification
                • Storage
                • Export
              • REST OF MEA Floating Liquefied Natural Gas Terminals Market by End Use Type
                • Power Generation
                • Industrial
                • Commercial
              • REST OF MEA Floating Liquefied Natural Gas Terminals Market by Ownership Type
                • Private
                • Public
                • Joint Venture
    Report Infographic
    Free Sample Request

    Kindly complete the form below to receive a free sample of this Report

    Customer Strories

    “I am very pleased with how market segments have been defined in a relevant way for my purposes (such as "Portable Freezers & refrigerators" and "last-mile"). In general the report is well structured. Thanks very much for your efforts.”

    Victoria Milne Founder
    Case Study

    Chemicals and Materials