• Cat-intel
  • MedIntelliX
  • Resources
  • About Us
  • Request Free Sample ×

    Kindly complete the form below to receive a free sample of this Report

    Leading companies partner with us for data-driven Insights

    clients tt-cursor

    Fuel Convenience Store POS Market

    ID: MRFR/ICT/8896-CR
    121 Pages
    Shubham Munde
    December 2021

    Fuel and Convenience Store PoS Market Research Report Information By Component (Solutions and Services), By Application (Operations Management, Cash Management, Inventory Management, Reporting & Analytics, and Others), By End-Use (Fuel Station and Convenience Stores), And By Region (North America, Europe, Asia-Pacific, And Rest Of The World) –Market Forecast Till 2034

    Share:
    Download PDF ×

    We do not share your information with anyone. However, we may send you emails based on your report interest from time to time. You may contact us at any time to opt-out.

    Fuel and Convenience Store PoS Market Research Report—Global Forecast till 2034 Infographic
    Purchase Options
    $ 4,950.0
    $ 5,950.0
    $ 7,250.0
    Table of Contents

    Fuel Convenience Store POS Market Summary

    As per Market Research Future Analysis, the Fuel and Convenience Store PoS Market is projected to grow significantly from USD 1.34 billion in 2025 to USD 7.63 billion by 2034, reflecting a robust compound annual growth rate (CAGR) of 21.30% during the forecast period. The market was valued at USD 1.10 billion in 2024, driven by the increasing adoption of cloud PoS solutions and the rising demand for PoS systems across fuel stations and convenience stores. Key trends include the integration of AI and data analytics, the rise of contactless payment solutions, and the development of mobile apps to enhance customer engagement and operational efficiency.

    Key Market Trends & Highlights

    The Fuel and Convenience Store PoS market is witnessing transformative trends driven by technology and consumer preferences.

    • Market size in 2025: USD 1.34 billion; projected to reach USD 7.63 billion by 2034.
    • CAGR of 21.30% during the forecast period (2025 - 2034).
    • Services segment dominated the market, providing essential support and maintenance for PoS systems.
    • Operations management category generated the most income, streamlining various operational tasks.

    Market Size & Forecast

    2024 Market Size USD 1.10 billion
    2025 Market Size USD 1.34 billion
    2034 Market Size USD 7.63 billion

    Major Players

    Key players include Fujitsu Ltd. (Japan), VeriFone Inc. (US), Diebold Nixdorf Incorporated (US), NCR Corporation (US), and LS Retail (Iceland).

    Fuel Convenience Store POS Market Trends

    Growing demand for cloud-based PoS systems is driving the market growth

    Market CAGR for fuel and convenience store PoS is driven by the increasing demand for cloud-based PoS systems. Cloud-based PoS systems offer numerous advantages over traditional on-premises methods, including scalability, flexibility, and cost-effectiveness. Fuel and convenience store operators recognize the benefits of cloud-based PoS systems in remote management, real-time data access, and seamless integration with other business operations. Cloud-based PoS systems allow fuel and convenience store operators to streamline processes by providing centralized control over multiple locations. It enables efficient inventory management, automated reporting, and synchronized pricing across all outlets.

    Moreover, cloud-based solutions facilitate the integration of loyalty programs, mobile payment options, and personalized customer experiences, enhancing customer satisfaction and retention.

    The COVID-19 pandemic has raised the adoption of contactless payment solutions and mobile apps in the fuel and convenience store industry. Fuel and convenience store operators increasingly integrate their PoS systems with contactless payment options, such as mobile wallets, QR codes, and near-field communication (NFC) technology, to ensure customer safety and comply with hygiene protocols. Contactless payment solutions offer convenience and speed, allowing customers to purchase without physical contact with the PoS terminal. They also provide enhanced security through encryption and tokenization, reducing the risk of payment fraud.

    By integrating with these payment options, fuel and convenience stores can offer their customers a seamless and hygienic checkout experience, leading to increased customer satisfaction and loyalty. The store operators are developing mobile apps that integrate with their PoS systems. These apps enable customers to place orders, make payments, and access personalized offers directly from their smartphones. By leveraging mobile apps, operators can enhance customer engagement, gather valuable customer data, and provide a more personalized shopping experience.

    Another significant trend in the fuel and convenience store PoS market is integrating artificial intelligence (AI) and data analytics. Fuel and convenience store operators are leveraging AI algorithms and data analytics tools to gain actionable insights from huge amounts of data generated by PoS systems. These insights help operators optimize inventory management, predict customer preferences, and improve operational efficiency. AI-powered PoS systems can analyze sales patterns, customer behavior, and market trends to generate personalized recommendations and targeted promotions. For example, by analyzing purchasing history and customer demographics, these systems can suggest relevant products or offer discounts tailored to individual customers.

    Moreover, AI algorithms can detect anomalies or suspicious transactions, helping operators identify and prevent fraudulent activities. Data analytics also plays a major role in fuel and convenience store operations, as it allows operators to optimize inventory levels, improve supply chain management, and reduce wastage. Operators can identify top-selling products by analyzing sales data, forecasting demand, and adjusting pricing strategies accordingly.

    The increasing demand for cloud-based PoS systems, the integration of AI and data analytics, and the adoption of contactless payment solutions and mobile apps are driving innovation and improving operational efficiency for fuel and convenience store operators. By staying abreast of these trends, industry players can seize opportunities, enhance customer experiences, driving the Fuel and Convenience Store PoS market revenue.

    The integration of advanced payment technologies in fuel and convenience store point-of-sale systems appears to enhance customer experience and operational efficiency, reflecting a broader trend towards digital transformation in retail.

    U.S. Department of Commerce

    Fuel Convenience Store POS Market Drivers

    Market Growth Projections

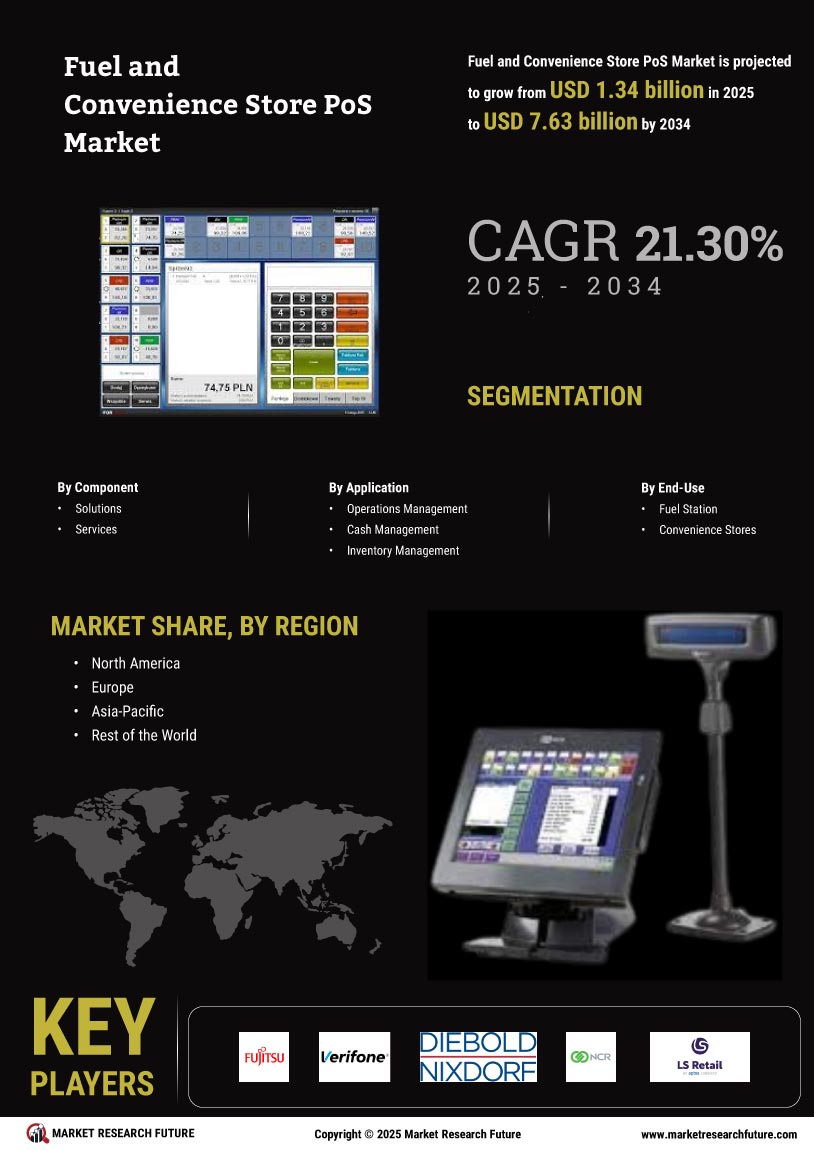
    The Global Fuel and Convenience Store PoS Market Industry is projected to experience substantial growth over the next decade. With a market valuation of 1.11 USD Billion in 2024, it is anticipated to reach 9.26 USD Billion by 2035. This growth trajectory reflects a compound annual growth rate of 21.28% from 2025 to 2035, indicating a robust demand for advanced PoS solutions. The increasing adoption of technology, coupled with changing consumer preferences, is likely to drive this expansion, positioning the market for significant advancements in the coming years.

    Technological Advancements

    The Global Fuel and Convenience Store PoS Market Industry is experiencing rapid technological advancements that enhance operational efficiency and customer experience. Innovations such as mobile payment systems, contactless transactions, and integrated inventory management systems are becoming increasingly prevalent. These technologies not only streamline transactions but also provide valuable data analytics for better decision-making. For instance, the adoption of advanced PoS systems is projected to contribute significantly to the market's growth, with a valuation of 1.11 USD Billion in 2024. As retailers embrace these technologies, they can expect improved customer satisfaction and loyalty, further driving market expansion.

    Rising Demand for Convenience

    Consumer preferences are shifting towards convenience, significantly impacting the Global Fuel and Convenience Store PoS Market Industry. As lifestyles become busier, customers increasingly seek quick and efficient shopping experiences. This trend is reflected in the growing number of convenience stores and fuel stations that offer a wide range of products and services under one roof. The market is expected to grow substantially, with projections indicating a rise to 9.26 USD Billion by 2035. This increasing demand for convenience drives retailers to invest in advanced PoS systems that facilitate faster transactions and enhance customer engagement.

    Integration of Loyalty Programs

    The integration of loyalty programs within the Global Fuel and Convenience Store PoS Market Industry is becoming a crucial driver of customer retention and sales growth. Retailers are leveraging PoS systems to implement personalized loyalty initiatives that reward frequent customers with discounts and promotions. This strategy not only encourages repeat business but also provides valuable insights into consumer behavior. As a result, the market is likely to witness a compound annual growth rate of 21.28% from 2025 to 2035. By fostering customer loyalty through innovative PoS solutions, retailers can enhance their competitive edge in a crowded marketplace.

    E-commerce and Omnichannel Strategies

    The rise of e-commerce and omnichannel retailing is reshaping the Global Fuel and Convenience Store PoS Market Industry. Retailers are increasingly adopting integrated PoS systems that facilitate seamless transactions across various channels, including online and in-store purchases. This approach allows businesses to meet the evolving expectations of consumers who seek flexibility and convenience in their shopping experiences. As the market adapts to these changes, it is anticipated that the integration of e-commerce capabilities will drive significant growth, contributing to the overall market expansion and enhancing customer satisfaction.

    Regulatory Compliance and Safety Standards

    Regulatory compliance and safety standards play a pivotal role in shaping the Global Fuel and Convenience Store PoS Market Industry. As governments worldwide implement stricter regulations regarding payment security and data protection, retailers are compelled to upgrade their PoS systems to ensure compliance. This necessity not only protects consumer data but also fosters trust and credibility in the marketplace. Consequently, the demand for compliant PoS solutions is expected to rise, driving market growth as retailers invest in technologies that meet these evolving regulatory requirements.

    Market Segment Insights

    Fuel and Convenience Store PoS Component Insights

    The Fuel and Convenience Store PoS market segmentation, based on components, includes solutions and services. The services segment dominated the market. It involves providing technical support, software updates, maintenance, and training for PoS systems. Service providers offer installation assistance, troubleshooting, and regular system maintenance to ensure smooth operations and minimize downtime.

    Fuel and Convenience Store PoS Application Insights

    The Fuel and Convenience Store PoS market segmentation, based on application, includes operations management, cash management, inventory management, reporting & analytics, and others. The operations management category generated the most income. It involves streamlining and automating various operational tasks, such as fuel pump management, price management, employee management, and customer relationship management. PoS systems with operations management capabilities help store owners optimize operations, reduce manual errors, and improve customer service.

    Fuel and Convenience Store PoS End-Use Insights

    The Fuel and Convenience Store PoS market segmentation, based on end use, includes fuel stations and convenience stores. The fuel stations segment dominated the market. PoS systems in fuel stations are designed to handle fuel pump integration, payment processing, and loyalty programs. These systems enable customers to make quick and secure transactions at the fuel pump, improving customer satisfaction and operational efficiency.

    Figure 2: Fuel and Convenience Store PoS Market, by End-Use, 2022 & 2032 (USD Billion)

    Source: Secondary Research, Primary Research, Market Research Future Database, and Analyst Review

    Get more detailed insights about Fuel and Convenience Store PoS Market Research Report—Global Forecast till 2034

    Regional Insights

    By region, the study provides market insights into North America, Europe, Asia-Pacific, and the Rest of the World. The North American Fuel and Convenience Store PoS market area will dominate this market due to the highly developed fuel retail industry with a large number of convenience stores and gas stations. Integration of mobile payment solutions, loyalty programs, and advanced analytics capabilities are key trends in the North American market. The presence of major PoS solution providers and the high adoption rate of new technologies make North America a leading region in this market.

    Further, the major countries studied in the market report are The US, Canada, German, France, the UK, Italy, Spain, China, Japan, India, Australia, South Korea, and Brazil.

    Figure 3: FUEL AND CONVENIENCE STORE POS MARKET SHARE BY REGION 2022 (USD Billion)

    FUEL AND CONVENIENCE STORE POS MARKET SHARE BY REGION 2022

    Source: Secondary Research, Primary Research, Market Research Future Database, and Analyst Review

    Europe Fuel and Convenience Store PoS market holds a significant market share due to the emergence of electric vehicle charging infrastructure and integration with PoS systems. The European market is witnessing a shift towards more secure payment options, such as Europay, Mastercard, and Visa compliance, to combat fraud and improve transaction security. Additionally, the increasing popularity of contactless payments and mobile wallets is driving the adoption of innovative PoS solutions in the region.

    Further, the German Fuel and Convenience Store PoS market had the largest market share, and the UK Fuel and Convenience Store PoS market was the fastest-growing market in the European region.

    The Asia-Pacific Fuel and Convenience Store PoS Market is expected to grow significantly from 2023 to 2032. It is due to the expanding urbanization, rising disposable incomes, and changing consumer preferences. The market in this region is characterized by a mix of traditional and modern retail formats, presenting unique challenges and opportunities. In countries, the adoption of digital payment methods is growing significantly, leading to increased demand for advanced PoS systems that support these payment options. Moreover, the integration of PoS solutions with loyalty programs, personalized marketing, and e-commerce platforms is gaining traction in Asia.

    Furthermore, China’s Fuel and Convenience Store PoS market had the largest market share, and the Indian Fuel and Convenience Store PoS market was the fastest-growing market in the Asia-Pacific region.

    Key Players and Competitive Insights

    Leading market players are investing heavily in research and development to expand their product lines, which will help the Fuel and Convenience Store PoS market grow even more. Market participants are also undertaking various strategies to spread their footprint, with important market developments including product launches, contractual agreements, mergers and acquisitions, higher investments, and collaboration with other organizations. To expand and survive in a more competitive and rising market climate, the Fuel and Convenience Store PoS industry must offer cost-effective items.

    Manufacturing locally to minimize operational costs is one of the key business tactics used by manufacturers in the Fuel and Convenience Store PoS industry to benefit clients and increase the market sector. In recent years, the Fuel and Convenience Store PoS industry has offered some of the most significant medical advantages. Major players in the Fuel and Convenience Store PoS market, including Fujitsu Ltd. (Japan), VeriFone Inc. (US), Diebold Nixdorf Incorporated (US), NCR Corporation (US), LS Retail (Iceland), and others, are attempting to increase market demand by investing in research and development operations.

    Charles Diebold and Heinz Nixdorf's, Diebold Nixdorf, founded in 1859, located in Hudson, Ohio, United States, is an American international technology company that specializes and develops in the sale, manufacture, installation, and service of transaction systems such as ATMs and currency processing systems. In January 2020, Dielbold Nixdorf announced BEETLE A1150, an all-in-one POS system that combines the latest technology and reliability with a space-saving design.

    Pinnacle Industries Ltd., also known as PIL, was founded in 1996, is located in Pune, Maharashtra, India, and is an Indian motor vehicle and interior manufacturing company. It designs and develops seating and interior products for commercial vehicles. In March 2020, The Pinnacle Corporation offered retailers its Affiniti Cloud Mobile Ordering solution, which helps customers and employees practice social distancing.

    Key Companies in the Fuel Convenience Store POS Market market include

    Industry Developments

    March 2023: Dover Fueling Solutions launched DX PowerTM to incorporate EV Chargers into the Prizma Ecosystem.

    October 2022: Posiflex exhibited best-in-class POS hardware and self-service technologies at GITEX 2022, enabling a smarter world of transactions.

    Future Outlook

    Fuel Convenience Store POS Market Future Outlook

    The Global Fuel and Convenience Store PoS Market is projected to grow at a 21.28% CAGR from 2024 to 2035, driven by technological advancements, increased consumer demand, and enhanced payment solutions.

    New opportunities lie in:

    • Implement AI-driven analytics for personalized customer experiences.
    • Expand mobile payment integration to enhance transaction efficiency.
    • Develop eco-friendly PoS systems to attract sustainability-focused consumers.

    By 2035, the market is expected to exhibit robust growth, positioning itself as a leader in retail technology.

    Market Segmentation

    Outlook

    • Operations Management
    • Cash Management
    • Inventory Management
    • Reporting & Analytics
    • Others

    Fuel and Convenience Store PoS End-Use Outlook

    • Fuel Station
    • Convenience Stores

    Fuel and Convenience Store PoS Regional Outlook

    • US
    • Canada

    Fuel and Convenience Store PoS Component Outlook

    • Solutions
    • Services

    Fuel and Convenience Store PoS Application Outlook

    • Operations Management
    • Cash Management
    • Inventory Management
    • Reporting & Analytics
    • Others

    Report Scope

    Report Attribute/Metric Details
    Market Size 2024 1.10 (USD Billion)
    Market Size 2025 1.34 (USD Billion)
    Market Size 2034 7.63 (USD Billion)
    Compound Annual Growth Rate (CAGR) 21.30% (2025 - 2034)
    Report Coverage Revenue Forecast, Competitive Landscape, Growth Factors, and Trends
    Base Year 2024
    Market Forecast Period 2025 - 2034
    Historical Data 2019 - 2023
    Market Forecast Units USD Billion
    Segments Covered Component, Application, End-Use, and Region
    Geographies Covered North America, Europe, Asia Pacific, and the Rest of the World
    Countries Covered The US, Canada, German, France, UK, Italy, Spain, China, Japan, India, Australia, South Korea, and Brazil
    Key Companies Profiled Fujitsu Ltd. (Japan), VeriFone Inc. (US), Diebold Nixdorf Incorporated (US), NCR Corporation (US), and LS Retail (Iceland).
    Key Market Opportunities Increase in adoption of AI and machine learning in developing solutions for PoS.
    Key Market Dynamics Increase in demand for PoS for efficient management across fuel stations and stores.

    Market Highlights

    Author
    Shubham Munde
    Research Analyst Level II

    With a technical background in information technology & semiconductors, Shubham has 4.5+ years of experience in market research and analytics with the tasks of data mining, analysis, and project execution. He is the POC for our clients, for their consulting projects running under the ICT/Semiconductor domain. Shubham holds a Bachelor’s in Information and Technology and a Master of Business Administration (MBA). Shubham has executed over 150 research projects for our clients under the brand name Market Research Future in the last 2 years. His core skill is building the research respondent relation for gathering the primary information from industry and market estimation for niche markets. He is having expertise in conducting secondary & primary research, market estimations, market projections, competitive analysis, analysing current market trends and market dynamics, deep-dive analysis on market scenarios, consumer behaviour, technological impact analysis, consulting, analytics, etc. He has worked on fortune 500 companies' syndicate and consulting projects along with several government projects. He has worked on the projects of top tech brands such as IBM, Google, Microsoft, AWS, Meta, Oracle, Cisco Systems, Samsung, Accenture, VMware, Schneider Electric, Dell, HP, Ericsson, and so many others. He has worked on Metaverse, Web 3.0, Zero-Trust security, cyber-security, blockchain, quantum computing, robotics, 5G technology, High-Performance computing, data centers, AI, automation, IT equipment, sensors, semiconductors, consumer electronics and so many tech domain projects.

    Leave a Comment

    FAQs

    How much is the Fuel and Convenience Store PoS market?

    The Fuel and Convenience Store PoS market size was valued at USD 1.10 Billion in 2024.

    What is the growth rate of the Fuel and Convenience Store PoS market?

    The market is projected to grow at a CAGR of 21.30% during the forecast period, 2025-2034.

    Which region held the largest Fuel and Convenience Store PoS market share?

    North America had the largest share of the market.

    Who are the key players in the Fuel and Convenience Store PoS market?

    The key players in the market are Fujitsu Ltd. (Japan), VeriFone Inc. (US), Diebold Nixdorf Incorporated (US), NCR Corporation (US), and LS Retail (Iceland).

    Which component led the Fuel and Convenience Store PoS market?

    The services category dominated the market in 2023.

    Which application had the largest Fuel and Convenience Store PoS market share?

    The operations management had the largest share in the market.

    Which end-use had the largest Fuel and Convenience Store PoS market share?

    The fuel station had the largest share of the market.

    1. 'TABLE OF CONTENTS
    2. Executive
    3. Summary
    4. Market Introduction
    5. Definition
    6. Scope of the Study
    7. Market Structure
    8. Research Methodology
    9. Market Dynamics
    10. Introduction
    11. Drivers
    12. Increase demand for POS for efficient management across fuel stations and convenience
    13. stores
    14. Increasing adoption of cloud POS and mPOS solutions
      1. Driver Impact Analysis
      2. Restraints
        1. data security concerns
        2. Restraint Impact Analysis
      3. Opportunities
        1. Adoption of AI and Machine
    15. learning in developing solutions for POS
      1. Challenge
        1. Lack of infrastructure for cloud-based pos systems
      2. Impact Analysis of
    16. COVID Pandemic
    17. Impact on Market Demand
      1. Impact on Installations due to Lockdown
        1. Closure of Various Points of Sales
        2. Consumer Sentiments
        3. Impact on Pricing
    18. Market Factor Analysis
      1. Value Chain Analysis
        1. POINT OF SALE (POS)
    19. SOFTWARE PROVIDERS
    20. POINT OF SALE (POS) SERVICE PROVIDERS
      1. END USERS
      2. PORTER’S FIVE FORCES MODEL
        1. THREAT OF NEW ENTRANTS
        2. BARGAINING POWER OF SUPPLIERS
        3. THREAT OF SUBSTITUTES
        4. Bargaining Power
    21. of Buyers
    22. Competitive Rivalry
    23. GLOBAL FUEL AND CONVENIENCE STORE PoS MARKET, BY COMPONENT
      1. OVERVIEW
        1. Global FUEL AND CONVENIENCE STORE PoS MARKET,
    24. BY COMPONENT, 2018–2027 (USD million)
      1. SOLUTIONs
        1. Global FUEL AND CONVENIENCE STORE PoS MARKET,
    25. BY SOLUTIONs, 2018–2027 (USD million)
      1. Fixed/Traditional/Legacy PoS
        1. Cloud PoS
        2. Mobile PoS
      2. Services
        1. Global FUEL AND CONVENIENCE
    26. STORE PoS MARKET, BY services, 2018–2027 (USD million)
      1. Managed Services
        1. Professional Services
    27. GLOBAL FUEL AND CONVENIENCE STORE PoS MARKET, BY
    28. application
    29. OVERVIEW
    30. Global FUEL AND CONVENIENCE STORE PoS MARKET, BY application, 2018–2027 (USD
    31. million)
    32. Operations Management
    33. Cash Management
    34. Inventory Management
    35. Reporting & Analytics
      1. Others
    36. GLOBAL FUEL AND CONVENIENCE STORE PoS MARKET, BY End Use
      1. OVERVIEW
        1. Global FUEL AND
    37. CONVENIENCE STORE PoS MARKET, BY End Use, 2018–2027 (USD million)
      1. Fuel Station
      2. Convenience Stores
    38. Global FUEL AND CONVENIENCE
    39. STORE PoS MARKET, BY Region
      1. OVERVIEW
        1. Global FUEL AND CONVENIENCE STORE PoS MARKET, by Region, 2018
    40. VS 2027 (USD MILLION)
    41. Global FUEL AND CONVENIENCE STORE PoS MARKET, BY Region, 2018–2027 (USD million)
      1. North america
        1. North america:
    42. FUEL AND CONVENIENCE STORE PoS MARKET, BY Country, 2018–2027 (USD MILLION)
      1. NORTH AMERICA:
    43. FUEL AND CONVENIENCE STORE PoS MARKET, BY COMPONENT, 2018–2027 (USD million)
      1. NORTH AMERICA:
    44. FUEL AND CONVENIENCE STORE PoS MARKET, BY services, 2018–2027 (USD million)
      1. NORTH AMERICA:
    45. FUEL AND CONVENIENCE STORE PoS MARKET, BY SOLUTIONs, 2018–2027 (USD million)
      1. NORTH AMERICA:
    46. FUEL AND CONVENIENCE STORE PoS MARKET, BY application, 2018–2027 (USD million)
      1. NORTH AMERICA:
    47. FUEL AND CONVENIENCE STORE PoS MARKET, BY End Use, 2018–2027 (USD million)
      1. US
        1. US: FUEL AND CONVENIENCE
    48. STORE PoS MARKET, BY COMPONENT, 2018–2027 (USD million)
      1. US: FUEL AND CONVENIENCE
    49. STORE PoS MARKET, BY services, 2018–2027 (USD million)
      1. US: FUEL AND CONVENIENCE STORE PoS MARKET,
    50. BY solution, 2018–2027 (USD million)
      1. US: FUEL AND CONVENIENCE STORE PoS MARKET,
    51. BY application, 2018–2027 (USD million)
      1. US: FUEL AND CONVENIENCE STORE PoS MARKET,
    52. BY End Use, 2018–2027 (USD million)
      1. canada
        1. CANADA: FUEL AND CONVENIENCE STORE PoS MARKET,
    53. BY COMPONENT, 2018–2027 (USD million)
      1. CANADA: FUEL AND CONVENIENCE STORE PoS MARKET,
    54. BY services, 2018–2027 (USD million)
      1. CANADA: FUEL AND CONVENIENCE STORE PoS MARKET,
    55. BY solution, 2018–2027 (USD million)
      1. CANADA: FUEL AND CONVENIENCE STORE PoS MARKET,
    56. BY application, 2018–2027 (USD million)
      1. CANADA: FUEL AND CONVENIENCE STORE PoS MARKET,
    57. BY End Use, 2018–2027 (USD million)
      1. Mexico
        1. MEXICO: FUEL AND CONVENIENCE STORE PoS MARKET,
    58. BY COMPONENT, 2018–2027 (USD million)
      1. MEXICO: FUEL AND CONVENIENCE STORE PoS MARKET,
    59. BY services, 2018–2027 (USD million)
      1. MEXICO: FUEL AND CONVENIENCE STORE PoS MARKET,
    60. BY solutions, 2018–2027 (USD million)
      1. MEXICO: FUEL AND CONVENIENCE STORE PoS MARKET,
    61. BY application, 2018–2027 (USD million)
      1. MEXICO: FUEL AND CONVENIENCE STORE PoS MARKET,
    62. BY End Use, 2018–2027 (USD million)
      1. EUROPE
        1. EUROPE: FUEL AND CONVENIENCE STORE PoS MARKET,
    63. BY Country, 2018–2027 (USD MILLION)
      1. EUROPE: FUEL AND CONVENIENCE STORE PoS MARKET,
    64. BY COMPONENT, 2018–2027 (USD million)
      1. EUROPE: FUEL AND CONVENIENCE STORE PoS MARKET,
    65. BY services, 2018–2027 (USD million)
      1. EUROPE: FUEL AND CONVENIENCE STORE PoS MARKET,
    66. BY Solutions, 2018–2027 (USD million)
      1. EUROPE: FUEL AND CONVENIENCE STORE PoS MARKET,
    67. BY application, 2018–2027 (USD million)
      1. EUROPE: FUEL AND CONVENIENCE STORE PoS MARKET,
    68. BY End Use, 2018–2027 (USD million)
      1. GERMANY
        1. GERMANY: FUEL AND CONVENIENCE STORE PoS MARKET,
    69. BY COMPONENT, 2018–2027 (USD million)
      1. GERMANY: FUEL AND CONVENIENCE STORE PoS MARKET,
    70. BY services, 2018–2027 (USD million)
      1. GERMANY: FUEL AND CONVENIENCE STORE PoS MARKET,
    71. BY solutions, 2018–2027 (USD million)
      1. GERMANY: FUEL AND CONVENIENCE STORE PoS MARKET,
    72. BY application, 2018–2027 (USD million)
      1. GERMANY: FUEL AND CONVENIENCE STORE PoS MARKET,
    73. BY End Use, 2018–2027 (USD million)
      1. italy
        1. ITALY: FUEL AND CONVENIENCE STORE PoS MARKET,
    74. BY COMPONENT, 2018–2027 (USD million)
      1. ITALY: FUEL AND CONVENIENCE STORE PoS MARKET,
    75. BY services, 2018–2027 (USD million)
      1. ITALY: FUEL AND CONVENIENCE STORE PoS MARKET,
    76. BY solutions, 2018–2027 (USD million)
      1. ITALY: FUEL AND CONVENIENCE STORE PoS MARKET,
    77. BY application, 2018–2027 (USD million)
      1. ITALY: F UEL AND CONVENIENCE STORE PoS MARKET,
    78. BY End Use, 2018–2027 (USD million)
      1. FRANCE
        1. FRANCE: FUEL AND CONVENIENCE STORE PoS MARKET,
    79. BY COMPONENT, 2018–2027 (USD million)
      1. FRANCE: FUEL AND CONVENIENCE STORE PoS MARKET,
    80. BY services, 2018–2027 (USD million)
      1. FRANCE: FUEL AND CONVENIENCE STORE PoS MARKET,
    81. BY solutions, 2018–2027 (USD million)
      1. FRANCE: FUEL AND CONVENIENCE STORE PoS MARKET,
    82. BY application, 2018–2027 (USD million)
      1. FRANCE: FUEL AND CONVENIENCE STORE PoS MARKET,
    83. BY End Use, 2018–2027 (USD million)
      1. UK
        1. UK: FUEL AND CONVENIENCE STORE PoS MARKET, BY COMPONENT,
    84. –2027 (USD million)
      1. UK: FUEL AND CONVENIENCE STORE PoS MARKET, BY services, 2018–2027
    85. (USD million)
    86. UK: FUEL AND CONVENIENCE STORE PoS MARKET, BY solutions, 2018–2027 (USD million)
      1. UK: FUEL AND
    87. CONVENIENCE STORE PoS MARKET, BY application, 2018–2027 (USD million)
      1. UK: FUEL AND
    88. CONVENIENCE STORE PoS MARKET, BY End Use, 2018–2027 (USD million)
      1. SPAIN
        1. SPAIN: FUEL
    89. AND CONVENIENCE STORE PoS MARKET, BY COMPONENT, 2018–2027 (USD million)
      1. SPAIN: FUEL
    90. AND CONVENIENCE STORE PoS MARKET, BY services, 2018–2027 (USD million)
      1. SPAIN: FUEL
    91. AND CONVENIENCE STORE PoS MARKET, BY solutions, 2018–2027 (USD million)
      1. SPAIN: FUEL
    92. AND CONVENIENCE STORE PoS MARKET, BY application, 2018–2027 (USD million)
      1. SPAIN: FUEL
    93. AND CONVENIENCE STORE PoS MARKET, BY End Use, 2018–2027 (USD million)
      1. REST OF EUROPE
        1. REST OF EUROPE:
    94. FUEL AND CONVENIENCE STORE PoS MARKET, BY COMPONENT, 2018–2027 (USD million)
      1. REST OF EUROPE:
    95. FUEL AND CONVENIENCE STORE PoS MARKET, BY services, 2018–2027 (USD million)
      1. REST OF EUROPE:
    96. FUEL AND CONVENIENCE STORE PoS MARKET, BY solutions, 2018–2027 (USD million)
      1. REST OF EUROPE:
    97. FUEL AND CONVENIENCE STORE PoS MARKET, BY application, 2018–2027 (USD million)
      1. REST OF EUROPE:
    98. FUEL AND CONVENIENCE STORE PoS MARKET, BY End Use, 2018–2027 (USD million)
      1. Benelux
        1. BENELUX: FUEL
    99. AND CONVENIENCE STORE PoS MARKET, BY COMPONENT, 2018–2027 (USD million)
      1. BENELUX: FUEL
    100. AND CONVENIENCE STORE PoS MARKET, BY services, 2018–2027 (USD million)
      1. BENELUX: FUEL
    101. AND CONVENIENCE STORE PoS MARKET, BY solutions, 2018–2027 (USD million)
      1. BENELUX: FUEL
    102. AND CONVENIENCE STORE PoS MARKET, BY application, 2018–2027 (USD million)
      1. BENELUX: FUEL
    103. AND CONVENIENCE STORE PoS MARKET, BY End Use, 2018–2027 (USD million)
      1. NORWAY
        1. NORWAY: FUEL
    104. AND CONVENIENCE STORE PoS MARKET, BY COMPONENT, 2018–2027 (USD million)
      1. NORWAY: FUEL
    105. AND CONVENIENCE STORE PoS MARKET, BY services, 2018–2027 (USD million)
      1. NORWAY: FUEL
    106. AND CONVENIENCE STORE PoS MARKET, BY solutions, 2018–2027 (USD million)
      1. NORWAY: FUEL
    107. AND CONVENIENCE STORE PoS MARKET, BY application, 2018–2027 (USD million)
      1. NORWAY: FUEL
    108. AND CONVENIENCE STORE PoS MARKET, BY End Use, 2018–2027 (USD million)
      1. ASIA-PACIFIC
        1. ASIA-PACIFIC: FUEL
    109. AND CONVENIENCE STORE PoS MARKET, BY Country, 2018–2027 (USD MILLION)
      1. ASIA-PACIFIC: FUEL
    110. AND CONVENIENCE STORE PoS MARKET, BY COMPONENT, 2018–2027 (USD million)
      1. ASIA-PACIFIC: FUEL
    111. AND CONVENIENCE STORE PoS MARKET, BY services, 2018–2027 (USD million)
      1. ASIA-PACIFIC: FUEL
    112. AND CONVENIENCE STORE PoS MARKET, BY solutions, 2018–2027 (USD million)
      1. ASIA-PACIFIC: FUEL
    113. AND CONVENIENCE STORE PoS MARKET, BY application, 2018–2027 (USD million)
      1. ASIA-PACIFIC: FUEL
    114. AND CONVENIENCE STORE PoS MARKET, BY End Use, 2018–2027 (USD million)
      1. CHINA
        1. CHINA: FUEL AND
    115. CONVENIENCE STORE PoS MARKET, BY COMPONENT, 2018–2027 (USD million)
      1. CHINA: FUEL AND
    116. CONVENIENCE STORE PoS MARKET, BY services, 2018–2027 (USD million)
      1. CHINA: FUEL AND
    117. CONVENIENCE STORE PoS MARKET, BY solutions, 2018–2027 (USD million)
      1. CHINA: FUEL AND
    118. CONVENIENCE STORE PoS MARKET, BY application, 2018–2027 (USD million)
      1. CHINA: FUEL AND
    119. CONVENIENCE STORE PoS MARKET, BY End Use, 2018–2027 (USD million)
      1. INDIA
        1. INDIA: FUEL AND
    120. CONVENIENCE STORE PoS MARKET, BY COMPONENT, 2018–2027 (USD million)
      1. INDIA: FUEL AND
    121. CONVENIENCE STORE PoS MARKET, BY services, 2018–2027 (USD million)
      1. INDIA: FUEL AND
    122. CONVENIENCE STORE PoS MARKET, BY solutions, 2018–2027 (USD million)
      1. INDIA: FUEL AND
    123. CONVENIENCE STORE PoS MARKET, BY application, 2018–2027 (USD million)
      1. INDIA: FUEL AND
    124. CONVENIENCE STORE PoS MARKET, BY End Use, 2018–2027 (USD million)
      1. JAPAN
        1. JAPAN: FUEL AND
    125. CONVENIENCE STORE PoS MARKET, BY COMPONENT, 2018–2027 (USD million)
      1. JAPAN: FUEL AND
    126. CONVENIENCE STORE PoS MARKET, BY services, 2018–2027 (USD million)
      1. JAPAN: FUEL AND
    127. CONVENIENCE STORE PoS MARKET, BY solutions, 2018–2027 (USD million)
      1. JAPAN: FUEL AND
    128. CONVENIENCE STORE PoS MARKET, BY application, 2018–2027 (USD million)
      1. JAPAN: FUEL AND
    129. CONVENIENCE STORE PoS MARKET, BY End Use, 2018–2027 (USD million)
      1. AUSTRALIA
        1. AUSTRALIA: FUEL
    130. AND CONVENIENCE STORE PoS MARKET, BY COMPONENT, 2018–2027 (USD million)
      1. AUSTRALIA: FUEL
    131. AND CONVENIENCE STORE PoS MARKET, BY services, 2018–2027 (USD million)
      1. AUSTRALIA: FUEL
    132. AND CONVENIENCE STORE PoS MARKET, BY solutions, 2018–2027 (USD million)
      1. AUSTRALIA: FUEL
    133. AND CONVENIENCE STORE PoS MARKET, BY application, 2018–2027 (USD million)
      1. AUSTRALIA: FUEL
    134. AND CONVENIENCE STORE PoS MARKET, BY End Use, 2018–2027 (USD million)
      1. south korea
        1. SOUTH KOREA:
    135. FUEL AND CONVENIENCE STORE PoS MARKET, BY COMPONENT, 2018–2027 (USD million)
      1. SOUTH KOREA:
    136. FUEL AND CONVENIENCE STORE PoS MARKET, BY services, 2018–2027 (USD million)
      1. SOUTH KOREA:
    137. FUEL AND CONVENIENCE STORE PoS MARKET, BY solutions, 2018–2027 (USD million)
      1. SOUTH KOREA:
    138. FUEL AND CONVENIENCE STORE PoS MARKET, BY application, 2018–2027 (USD million)
      1. SOUTH KOREA:
    139. FUEL AND CONVENIENCE STORE PoS MARKET, BY End Use, 2018–2027 (USD million)
      1. SINGAPORE
        1. SINGAPORE: FUEL
    140. AND CONVENIENCE STORE PoS MARKET, BY COMPONENT, 2018–2027 (USD million)
      1. SINGAPORE: FUEL
    141. AND CONVENIENCE STORE PoS MARKET, BY services, 2018–2027 (USD million)
      1. SINGAPORE: FUEL
    142. AND CONVENIENCE STORE PoS MARKET, BY solutions, 2018–2027 (USD million)
      1. SINGAPORE: FUEL
    143. AND CONVENIENCE STORE PoS MARKET, BY application, 2018–2027 (USD million)
      1. SINGAPORE: FUEL
    144. AND CONVENIENCE STORE PoS MARKET, BY End Use, 2018–2027 (USD million)
      1. REST OF ASIA-PACIFIC
        1. REST OF ASIA-PACIFIC:
    145. FUEL AND CONVENIENCE STORE PoS MARKET, BY COMPONENT, 2018–2027 (USD million)
      1. REST OF ASIA-PACIFIC:
    146. FUEL AND CONVENIENCE STORE PoS MARKET, BY services, 2018–2027 (USD million)
      1. REST OF ASIA-PACIFIC:
    147. FUEL AND CONVENIENCE STORE PoS MARKET, BY solutions, 2018–2027 (USD million)
      1. REST OF ASIA-PACIFIC:
    148. FUEL AND CONVENIENCE STORE PoS MARKET, BY application, 2018–2027 (USD million)
      1. REST OF ASIA-PACIFIC:
    149. FUEL AND CONVENIENCE STORE PoS MARKET, BY End Use, 2018–2027 (USD million)
      1. MALAYSIA
        1. MALAYSIA: FUEL
    150. AND CONVENIENCE STORE PoS MARKET, BY COMPONENT, 2018–2027 (USD million)
      1. MALAYSIA: FUEL
    151. AND CONVENIENCE STORE PoS MARKET, BY services, 2018–2027 (USD million)
      1. MALAYSIA: FUEL
    152. AND CONVENIENCE STORE PoS MARKET, BY solutions, 2018–2027 (USD million)
      1. MALAYSIA: FUEL
    153. AND CONVENIENCE STORE PoS MARKET, BY application, 2018–2027 (USD million)
      1. MALAYSIA: FUEL
    154. AND CONVENIENCE STORE PoS MARKET, BY End Use, 2018–2027 (USD million)
      1. INDONESIA
        1. INDONESIA: FUEL
    155. AND CONVENIENCE STORE PoS MARKET, BY COMPONENT, 2018–2027 (USD million)
      1. INDONESIA: FUEL
    156. AND CONVENIENCE STORE PoS MARKET, BY services, 2018–2027 (USD million)
      1. INDONESIA: FUEL
    157. AND CONVENIENCE STORE PoS MARKET, BY solutions, 2018–2027 (USD million)
      1. INDONESIA: FUEL
    158. AND CONVENIENCE STORE PoS MARKET, BY application, 2018–2027 (USD million)
      1. INDONESIA: FUEL
    159. AND CONVENIENCE STORE PoS MARKET, BY End Use, 2018–2027 (USD million)
      1. Philippines
        1. PHILIPPINES:
    160. FUEL AND CONVENIENCE STORE PoS MARKET, BY COMPONENT, 2018–2027 (USD million)
      1. PHILIPPINES:
    161. FUEL AND CONVENIENCE STORE PoS MARKET, BY services, 2018–2027 (USD million)
      1. PHILIPPINES:
    162. FUEL AND CONVENIENCE STORE PoS MARKET, BY solutions, 2018–2027 (USD million)
      1. PHILIPPINES:
    163. FUEL AND CONVENIENCE STORE PoS MARKET, BY application, 2018–2027 (USD million)
      1. PHILIPPINES:
    164. FUEL AND CONVENIENCE STORE PoS MARKET, BY End Use, 2018–2027 (USD million)
      1. MIDDLE EAST &
    165. AFRICA
    166. middle east & africa: FUEL AND CONVENIENCE STORE PoS MARKET, BY country, 2018–2027
    167. (USD MILLION)
    168. MIDDLE EAST & AFRICA: FUEL AND CONVENIENCE STORE PoS MARKET, BY COMPONENT, 2018–2027
    169. (USD million)
    170. MIDDLE EAST & AFRICA: FUEL AND CONVENIENCE STORE PoS MARKET, BY services, 2018–2027
    171. (USD million)
    172. MIDDLE EAST & AFRICA: FUEL AND CONVENIENCE STORE PoS MARKET, BY solutions, 2018–2027
    173. (USD million)
    174. MIDDLE EAST & AFRICA: FUEL AND CONVENIENCE STORE PoS MARKET, BY application,
    175. –2027 (USD million)
      1. MIDDLE EAST & AFRICA: FUEL AND CONVENIENCE STORE PoS MARKET,
    176. BY End Use, 2018–2027 (USD million)
      1. Saudi Arabia
        1. SAUDI ARABIA: FUEL AND CONVENIENCE STORE
    177. PoS MARKET, BY COMPONENT, 2018–2027 (USD million)
      1. SAUDI ARABIA: FUEL AND CONVENIENCE STORE
    178. PoS MARKET, BY services, 2018–2027 (USD million)
      1. SAUDI ARABIA: FUEL AND CONVENIENCE STORE
    179. PoS MARKET, BY solutions, 2018–2027 (USD million)
      1. SAUDI ARABIA: FUEL AND CONVENIENCE STORE
    180. PoS MARKET, BY application, 2018–2027 (USD million)
      1. SAUDI ARABIA: FUEL AND CONVENIENCE STORE
    181. PoS MARKET, BY End Use, 2018–2027 (USD million)
      1. Rest of Middle East & Africa
        1. REST OF MIDDLE
    182. EAST & AFRICA: FUEL AND CONVENIENCE STORE PoS MARKET, BY COMPONENT, 2018–2027
    183. (USD million)
    184. REST OF MIDDLE EAST & AFRICA: FUEL AND CONVENIENCE STORE PoS MARKET, BY services,
    185. –2027 (USD million)
      1. REST OF MIDDLE EAST & AFRICA: FUEL AND CONVENIENCE STORE
    186. PoS'

    Fuel and Convenience Store PoS Market Segmentation

    Fuel and Convenience Store PoS Component Outlook (USD Billion, 2018-2032)

    • Solutions
    • Services

    Fuel and Convenience Store PoS Application Outlook (USD Billion, 2018-2032)

    • Operations Management
    • Cash Management
    • Inventory Management
    • Reporting & Analytics
    • Others

    Fuel and Convenience Store PoS End-User Outlook (USD Billion, 2018-2032)

    • Fuel Station
    • Convenience Stores

    Fuel and Convenience Store PoS Regional Outlook (USD Billion, 2018-2032)

    • North America Outlook (USD Billion, 2018-2032)

      • North America Fuel and Convenience Store PoS by Component
        • Solutions
        • Services
      • North America Fuel and Convenience Store PoS by Application
        • Operations Management
        • Cash Management
        • Inventory Management
        • Reporting & Analytics
        • Others
      • North America Fuel and Convenience Store PoS by End-User
    • Fuel Station
    • Convenience Stores
      • US Outlook (USD Billion, 2018-2032)

      • US Fuel and Convenience Store PoS by Component
        • Solutions
        • Services
      • US Fuel and Convenience Store PoS by Application
        • Operations Management
        • Cash Management
        • Inventory Management
        • Reporting & Analytics
        • Others
      • US Fuel and Convenience Store PoS by End-User
    • Fuel Station
    • Convenience Stores
      • CANADA Outlook (USD Billion, 2018-2032)

      • CANADA Fuel and Convenience Store PoS by Component
        • Solutions
        • Services
      • CANADA Fuel and Convenience Store PoS by Application
        • Operations Management
        • Cash Management
        • Inventory Management
        • Reporting & Analytics
        • Others
      • CANADA Fuel and Convenience Store PoS by End-User
    • Fuel Station
    • Convenience Stores
    • Europe Outlook (USD Billion, 2018-2032)

      • Europe Fuel and Convenience Store PoS by Component
        • Solutions
        • Services
      • Europe Fuel and Convenience Store PoS by Application
        • Operations Management
        • Cash Management
        • Inventory Management
        • Reporting & Analytics
        • Others
      • Europe Fuel and Convenience Store PoS by End-User
    • Fuel Station
    • Convenience Stores
      • Germany Outlook (USD Billion, 2018-2032)

      • Germany Fuel and Convenience Store PoS by Component
        • Solutions
        • Services
      • Germany Fuel and Convenience Store PoS by Application
        • Operations Management
        • Cash Management
        • Inventory Management
        • Reporting & Analytics
        • Others
      • Germany Fuel and Convenience Store PoS by End-User
    • Fuel Station
    • Convenience Stores
      • France Outlook (USD Billion, 2018-2032)

      • France Fuel and Convenience Store PoS by Component
        • Solutions
        • Services
      • France Fuel and Convenience Store PoS by Application
        • Operations Management
        • Cash Management
        • Inventory Management
        • Reporting & Analytics
        • Others
      • France Fuel and Convenience Store PoS by End-User
    • Fuel Station
    • Convenience Stores
      • UK Outlook (USD Billion, 2018-2032)

      • UK Fuel and Convenience Store PoS by Component
        • Solutions
        • Services
      • UK Fuel and Convenience Store PoS by Application
        • Operations Management
        • Cash Management
        • Inventory Management
        • Reporting & Analytics
        • Others
      • UK Fuel and Convenience Store PoS by End-User
    • Fuel Station
    • Convenience Stores
      • ITALY Outlook (USD Billion, 2018-2032)

      • ITALY Fuel and Convenience Store PoS by Component
        • Solutions
        • Services
      • ITALY Fuel and Convenience Store PoS by Application
        • Operations Management
        • Cash Management
        • Inventory Management
        • Reporting & Analytics
        • Others
      • ITALY Fuel and Convenience Store PoS by End-User
    • Fuel Station
    • Convenience Stores
      • SPAIN Outlook (USD Billion, 2018-2032)

      • Spain Fuel and Convenience Store PoS by Component
        • Solutions
        • Services
      • Spain Fuel and Convenience Store PoS by Application
        • Operations Management
        • Cash Management
        • Inventory Management
        • Reporting & Analytics
        • Others
      • Spain Fuel and Convenience Store PoS by End-User
    • Fuel Station
    • Convenience Stores
      • Rest Of Europe Outlook (USD Billion, 2018-2032)

      • Rest Of Europe Fuel and Convenience Store PoS by Component
        • Solutions
        • Services
      • Rest Of Europe Fuel and Convenience Store PoS by Application
        • Operations Management
        • Cash Management
        • Inventory Management
        • Reporting & Analytics
        • Others
      • Rest Of Europe Fuel and Convenience Store PoS by End-User
    • Fuel Station
    • Convenience Stores
    • Asia-Pacific Outlook (USD Billion, 2018-2032)

      • Asia-Pacific Fuel and Convenience Store PoS by Component
        • Solutions
        • Services
      • Asia-Pacific Fuel and Convenience Store PoS by Application
        • Operations Management
        • Cash Management
        • Inventory Management
        • Reporting & Analytics
        • Others
      • Asia-Pacific Fuel and Convenience Store PoS by End-User
    • Fuel Station
    • Convenience Stores
      • China Outlook (USD Billion, 2018-2032)

      • China Fuel and Convenience Store PoS by Component
        • Solutions
        • Services
      • China Fuel and Convenience Store PoS by Application
        • Operations Management
        • Cash Management
        • Inventory Management
        • Reporting & Analytics
        • Others
      • China Fuel and Convenience Store PoS by End-User
    • Fuel Station
    • Convenience Stores
      • Japan Outlook (USD Billion, 2018-2032)

      • Japan Fuel and Convenience Store PoS by Component
        • Solutions
        • Services
      • Japan Fuel and Convenience Store PoS by Application
        • Operations Management
        • Cash Management
        • Inventory Management
        • Reporting & Analytics
        • Others
      • Japan Fuel and Convenience Store PoS by End-User
    • Fuel Station
    • Convenience Stores
      • India Outlook (USD Billion, 2018-2032)

      • India Fuel and Convenience Store PoS by Component
        • Solutions
        • Services
      • India Fuel and Convenience Store PoS by Application
        • Operations Management
        • Cash Management
        • Inventory Management
        • Reporting & Analytics
        • Others
      • India Fuel and Convenience Store PoS by End-User
    • Fuel Station
    • Convenience Stores
      • Australia Outlook (USD Billion, 2018-2032)

      • Australia Fuel and Convenience Store PoS by Component
        • Solutions
        • Services
      • Australia Fuel and Convenience Store PoS by Application
        • Operations Management
        • Cash Management
        • Inventory Management
        • Reporting & Analytics
        • Others
      • Australia Fuel and Convenience Store PoS by End-User
    • Fuel Station
    • Convenience Stores
      • Rest of Asia-Pacific Outlook (USD Billion, 2018-2032)

      • Rest of Asia-Pacific Fuel and Convenience Store PoS by Component
        • Solutions
        • Services
      • Rest of Asia-Pacific Fuel and Convenience Store PoS by Application
        • Operations Management
        • Cash Management
        • Inventory Management
        • Reporting & Analytics
        • Others
      • Rest of Asia-Pacific Fuel and Convenience Store PoS by End-User
    • Fuel Station
    • Convenience Stores
    • Rest of the World Outlook (USD Billion, 2018-2032)

      • Rest of the World Fuel and Convenience Store PoS by Component
        • Solutions
        • Services
      • Rest of the World Fuel and Convenience Store PoS by Application
        • Operations Management
        • Cash Management
        • Inventory Management
        • Reporting & Analytics
        • Others
      • Rest of the World Fuel and Convenience Store PoS by End-User
    • Fuel Station
    • Convenience Stores
      • Middle East Outlook (USD Billion, 2018-2032)

      • Middle East Fuel and Convenience Store PoS by Component
        • Solutions
        • Services
      • Middle East Fuel and Convenience Store PoS by Application
        • Operations Management
        • Cash Management
        • Inventory Management
        • Reporting & Analytics
        • Others
      • Middle East Fuel and Convenience Store PoS by End-User
    • Fuel Station
    • Convenience Stores
      • Africa Outlook (USD Billion, 2018-2032)

      • Africa Fuel and Convenience Store PoS by Component
        • Solutions
        • Services
      • Africa Fuel and Convenience Store PoS by Application
        • Operations Management
        • Cash Management
        • Inventory Management
        • Reporting & Analytics
        • Others
      • Africa Fuel and Convenience Store PoS by End-User
    • Fuel Station
    • Convenience Stores
      • Latin America Outlook (USD Billion, 2018-2032)

      • Latin America Fuel and Convenience Store PoS by Component
        • Solutions
        • Services
      • Latin America Fuel and Convenience Store PoS by Application
        • Operations Management
        • Cash Management
        • Inventory Management
        • Reporting & Analytics
        • Others
      • Latin America Fuel and Convenience Store PoS by End-User
    • Fuel Station
    • Convenience Stores
    Fuel and Convenience Store PoS Market Research Report—Global Forecast till 2034 Infographic
    Free Sample Request

    Kindly complete the form below to receive a free sample of this Report

    Customer Strories

    “I am very pleased with how market segments have been defined in a relevant way for my purposes (such as "Portable Freezers & refrigerators" and "last-mile"). In general the report is well structured. Thanks very much for your efforts.”

    Victoria Milne Founder
    Case Study

    Chemicals and Materials