• Cat-intel
  • MedIntelliX
  • Resources
  • About Us
  • Request Free Sample ×

    Kindly complete the form below to receive a free sample of this Report

    Leading companies partner with us for data-driven Insights

    clients tt-cursor

    Floating liquefied natural gas Market

    ID: MRFR/E&P/20521-HCR
    128 Pages
    Priya Nagrale
    September 2025

    Floating Liquefied Natural Gas (FLNG) Market Research Report Information By Technology (LNG FPSO, FSRU, Others) By End Use (Small/Mid-Scale, Large Scale, Others) and By Region -Global Forecast to 2032

    Share:
    Download PDF ×

    We do not share your information with anyone. However, we may send you emails based on your report interest from time to time. You may contact us at any time to opt-out.

    Floating Liquefied Natural Gas (FLNG) Market Research Report — Global Forecast till 2032 Infographic
    Purchase Options
    $ 4,950.0
    $ 5,950.0
    $ 7,250.0
    Table of Contents

    Floating liquefied natural gas Market Summary

    As per Market Research Future Analysis, the Global Floating Liquefied Natural Gas (FLNG) Market was valued at USD 27.27 billion in 2023 and is projected to reach USD 53.54 billion by 2032, growing at a CAGR of 10.8% from 2024 to 2032. The market is driven by the increasing demand for natural gas as a cleaner energy source, the ability to monetize offshore gas reserves, and the environmental benefits of reduced onshore infrastructure. FLNG technology allows for the production, liquefaction, and storage of natural gas at sea, facilitating access to remote markets and minimizing ecological impact. The FSRU segment holds the largest market share, driven by rising LNG import demand from various sectors, particularly automotive. The Asia-Pacific region is the major consumer, with significant offshore reserves in countries like Australia and Malaysia.

    Key Market Trends & Highlights

    The FLNG market is witnessing significant growth driven by various factors.

    • Market Size in 2023: USD 27.27 billion; Projected Market Size by 2032: USD 53.54 billion.
    • CAGR from 2024 to 2032: 10.8%; Major consumer region: Asia-Pacific.
    • FSRU segment holds the largest market share due to rising LNG import demand.
    • FLNG technology enables access to remote natural gas markets, enhancing production efficiency.

    Market Size & Forecast

    2023 Market Size USD 27.27 billion
    2032 Market Size USD 53.54 billion
    CAGR 10.8%

    Major Players

    Key players include ABB Ltd, Woodside Energy Group Ltd, Petroliam Nasional Berhad (PETRONAS), EXMAR, Hoegh LNG, Shell plc, Excelerate Energy, Inc., BASF SE, Golar LNG Limited, Mitsui O.S.K. Lines, and Eni S.p.A.

    Floating liquefied natural gas Market Trends

    The Floating Liquefied Natural Gas (FLNG) market appears poised for growth as nations increasingly seek to harness offshore gas reserves while minimizing environmental impacts.

    U.S. Energy Information Administration (EIA)

    Floating liquefied natural gas Market Drivers

    Market Growth Projections

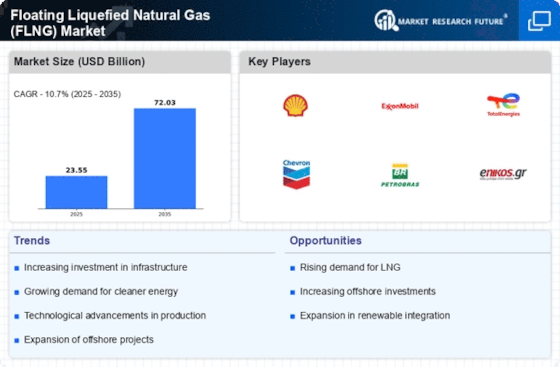
    The Global Floating Liquefied Natural Gas FLNG Market Industry is projected to experience substantial growth in the coming years. With a market valuation of approximately 30.2 USD Billion in 2024, it is anticipated to reach 72.8 USD Billion by 2035. This growth trajectory reflects a compound annual growth rate CAGR of 8.34% from 2025 to 2035. The increasing demand for cleaner energy sources, coupled with technological advancements and strategic investments, is likely to fuel this expansion. As the industry evolves, stakeholders are expected to adapt to emerging trends and capitalize on new opportunities, ensuring a dynamic market landscape.

    Rising Demand for Natural Gas

    The Global Floating Liquefied Natural Gas FLNG Market Industry is experiencing a surge in demand for natural gas as countries transition towards cleaner energy sources. This shift is driven by the need to reduce carbon emissions and meet international climate commitments. For instance, the International Energy Agency projects that natural gas consumption will increase significantly, contributing to the growth of the FLNG market. In 2024, the market is valued at approximately 30.2 USD Billion, indicating a robust demand trajectory. This trend is likely to continue, as governments and industries increasingly adopt natural gas as a bridge fuel in their energy transition strategies.

    Technological Advancements in FLNG

    Technological innovations play a pivotal role in the expansion of the Global Floating Liquefied Natural Gas FLNG Market Industry. Enhanced liquefaction processes, improved storage solutions, and advanced offshore facilities are making FLNG projects more economically viable. For example, the development of floating storage and regasification units has streamlined operations and reduced costs. These advancements not only increase efficiency but also enhance safety measures, making FLNG a more attractive option for energy companies. As a result, the market is projected to grow at a CAGR of 8.34% from 2025 to 2035, reflecting the positive impact of technology on the industry.

    Environmental Regulations and Policies

    The Global Floating Liquefied Natural Gas FLNG Market Industry is shaped by stringent environmental regulations and policies aimed at reducing greenhouse gas emissions. Governments worldwide are implementing regulations that favor cleaner energy sources, including natural gas. For example, the European Union's Green Deal emphasizes the importance of natural gas in achieving climate neutrality by 2050. Such policies not only promote the use of FLNG technology but also create a favorable investment climate for energy companies. As these regulations become more widespread, they are likely to drive growth in the FLNG market, aligning with global sustainability goals.

    Strategic Investments and Partnerships

    Strategic investments and partnerships are crucial drivers in the Global Floating Liquefied Natural Gas FLNG Market Industry. Major energy companies are increasingly collaborating with technology providers and governments to develop FLNG projects. For instance, partnerships between oil and gas companies and local governments facilitate access to resources and regulatory support. These collaborations not only enhance project feasibility but also mitigate risks associated with large-scale investments. As the market evolves, such strategic alliances are likely to become more prevalent, further propelling the industry towards its projected valuation of 72.8 USD Billion by 2035.

    Increasing Offshore Exploration Activities

    The Global Floating Liquefied Natural Gas FLNG Market Industry is significantly influenced by the rise in offshore exploration activities. As onshore reserves become depleted, energy companies are increasingly turning to offshore resources to meet global energy demands. This shift is evident in regions such as Southeast Asia and West Africa, where new discoveries are being made. The ability of FLNG facilities to operate in remote locations allows for the efficient extraction and processing of natural gas. Consequently, this trend is expected to bolster the market, as more companies invest in FLNG solutions to capitalize on offshore opportunities.

    Market Segment Insights

    Get more detailed insights about Floating Liquefied Natural Gas (FLNG) Market Research Report — Global Forecast till 2032

    Regional Insights

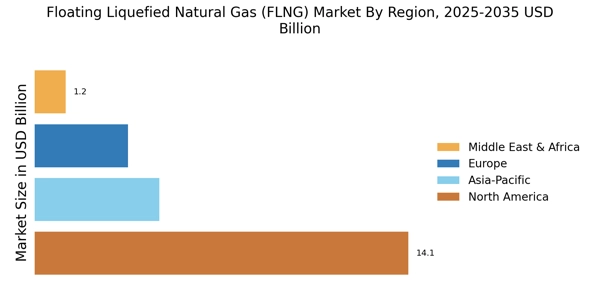
    By Region, the Floating liquefied natural gas (FLNG) market is segmented into North America, Europe, Asia-Pacific, Middle East & Africa, and Latin America.  

    The major consumer of natural gas, driving the demand for FLNG projects is the Asia-Pacific region. Countries includes are Australia, Malaysia and Indonesia have major offshore gas reserves are playing main role to pushing the FLNG developments. The Middle East and Africa region has substantial offshore gas reserves, particularly in countries like Mozambique and Tanzania. FLNG projects in this region offer opportunities for monetizing these resources and meeting the growing energy needs. 

    Also, Europe has a mature gas market, but there are opportunities for FLNG projects in regions such as the North Sea and the Mediterranean, Europe focus on reducing greenhouse gas emissions and transiting to cleaner energy sources also supports the development of FLNG technology.

    Floating liquefied natural gas (FLNG) Regional Insights

    Key Players and Competitive Insights

    The Floating liquefied natural gas (FLNG) Market is offering a wide range of advanced and efficient floating liquefied natural gas (FLNG) products are the growing demand across various applications. This market is segmented by floating liquefied natural gas (FLNG) technology, capacity, and region. Key drivers of market growth include the rising adoption of floating liquefied natural gas (FLNG)s in sectors like Natural Gas Production, Marginal Gas Fields, Gas-to-Power Projects, and Emergency Gas Supply. 

    Furthermore, the Floating liquefied natural gas (FLNG) Market is dominated by major players such as ABB Ltd, Woodside Energy Group Ltd, Petroliam Nasional Berhad (PETRONAS), EXMAR, Hoegh LNG, Shell plc, Excelerate Energy, Inc., BASF SE, Golar LNG Limited, Mitsui O.S.K.Lines, and Eni S.p.A. These companies’ or players have a strong worldwide or the global presence and offer an different floating liquefied natural gas (FLNG) technology, including Small/Mid-Scale and Large Scale application needs. 

    They comapnies differentiate on factors like, quality, reliability, and innovation and cost effectiveness. They promote research and development activities and help in the introduction new floating liquefied natural gas (FLNG) technologies which help in expanding their product portfolios . They follow or adopt initiatives like mergers, acquisitions, partnerships, and collaborations with other industry participants to achieve the market share . The Floating liquefied natural gas (FLNG) Market has also felt the impact of the COVID-19 pandemic, leading to fluctuations in demand in various end-user sectors and supply chain disruptions. 

    However, as the global economy gradually recovers, the market is expected to rebound, driven by the growing reliance on floating liquefied natural gas (FLNG)s in essential technologies and the increasing emphasis on sustainability. The market's future prospects are promising, with floating liquefied natural gas (FLNG)s set to play a pivotal role in the ongoing technological transformations and innovations, making them an integral component of the evolving global industrial landscape.

    ABB Ltd.: ABB Ltd. is a Swiss-Swedish corporation that produces electrical equipment products. It was established by the merger of Asea from Sweden and Brown, Boveri & Cie from Switzerland, both of whom were large electrical goods & engineering companies in their countries, simplified from Asea Brown Boveri to ABB.  It has four business area:  Electrification, Motion, Process Automation and Robotics & Discrete Automation along with 19 divisions. 

    The core values the company holds dear are courage, care, curiosity & collaboration, through which they have managed to keep their lead in the electrical goods market. Their aim is to be an enabler for a sustainable & resource-efficient future with their lead in electrification & automation. Until the year 2020, it was Switzerland’s largest employer.

    Petroliam Nasional Berhad: PETROLIAM NASIONAL BERHAD (PETRONAS) established in 1974, is a key player in the Exploitation of Oil And Gas sector in KUALA LUMPUR, Malaysia. This LIMITED BY SHARES, PUBLIC LIMITED entity, with a detailed company profile available, features a robust structure with 10 directors and 2 shareholders. The comprehensive company profile includes the shareholding structure, a list of shareholders and directors, records of charges, and, when available, the latest financial statements, reflecting the company's transparency and commitment to industry excellence.

    Key Companies in the Floating liquefied natural gas Market market include

    Industry Developments

    Future Outlook

    Floating liquefied natural gas Market Future Outlook

    The Floating Liquefied Natural Gas (FLNG) Market is projected to grow at an 8.34% CAGR from 2024 to 2035, driven by technological advancements, increasing energy demand, and environmental regulations.

    New opportunities lie in:

    • Invest in advanced FLNG technologies to enhance operational efficiency and reduce costs.
    • Explore partnerships with emerging markets to expand FLNG infrastructure and service offerings.
    • Develop innovative financing models to support FLNG project investments and mitigate risks.

    By 2035, the FLNG market is expected to achieve substantial growth, positioning itself as a key player in the global energy landscape.

    Market Segmentation

    Floating liquefied natural gas (FLNG) Capacity Outlook

    • Small/Mid-Scale
    • Large Scale
    • Others

    Floating liquefied natural gas (FLNG) Regional Outlook

    North America
    • US
    • Canada

    Floating liquefied natural gas (FLNG) Technology Outlook

    • LNG FPSO
    • FSRU
    • Others

    Report Scope

    Report Attribute/Metric Details
    Market Size 2023 USD 21.27 billion
    Market Size 2032 USD 53.54 Billion
    Compound Annual Growth Rate (CAGR) 10.7% (2024-2032)
    Base Year 2023
    Forecast Period 2024-2032
    Historical Data 2018 to 2022
    Forecast Units Value (USD Billion)
    Report Coverage Revenue Forecast, Competitive Landscape, Growth Factors, and Trends
    Segments Covered technology, capacity, and Region
    Geographies Covered North America, Europe, Asia Pacific, Rest of World
    Countries Covered US, Canada, Germany, UK, France, Spain, Italy, Russia, China, Japan, India, South Korea, Brazil, Mexico, Argentina, South Africa, GCC countries
    Key Companies Profiled ABB Ltd., Woodside Energy Group Ltd, Petroliam Nasional Berhad (PETRONAS), EXMAR, Hoegh LNG, Shell plc, Excelerate Energy, Inc., BASF SE, Golar LNG Limited, Mitsui O.S.K.Lines, Eni S.p.A.
    Key Market Opportunities Growing market for LNG and unlocking gas reserves
    Key Market Dynamics Increase in demand for natural gas Monetization of offshore gas

    Market Highlights

    Author
    Priya Nagrale
    Senior Research Analyst

    With an experience of over five years in market research industry (Chemicals & Materials domain), I gather and analyze market data from diverse sources to produce results, which are then presented back to a client. Also, provide recommendations based on the findings. As a Senior Research Analyst, I perform quality checks (QC) for market estimations, QC for reports, and handle queries and work extensively on client customizations. Also, handle the responsibilities of client proposals, report planning, report finalization, and execution

    Leave a Comment

    FAQs

    How much is the Floating liquefied natural gas (FLNG) Market?

    Floating liquefied natural gas (FLNG) Market Size US$ 21.27 Bn in 2023.

    What is the growth rate of the Floating liquefied natural gas (FLNG) Market?

    Growth rate of the Floating liquefied natural gas (FLNG) Market is 10.7% by 2032.

    Which region held the largest market share in the Floating liquefied natural gas (FLNG) Market?

    Asia-Pacific held the largest market share in the Floating liquefied natural gas (FLNG) Market.

    Who are the key players in the Floating liquefied natural gas (FLNG) Market?

    Woodside Energy Group Ltd, Petroliam Nasional Berhad (PETRONAS), EXMAR, ABB Ltd., Hoegh LNG, Shell plc, Excelerate Energy, Inc., BASF SE, Golar LNG Limited, Mitsui O.S.K.Lines, Eni S.p.A.natural gas (FLNG)ic Products Co

    Which technology had the largest market share in the Floating liquefied natural gas (FLNG) Market?

    FSRU had the largest market share in the Floating liquefied natural gas (FLNG) Market.

    Which capacity had the largest market share in the Floating liquefied natural gas (FLNG) Market?

    Large Scale had the largest market share in the Floating liquefied natural gas (FLNG) Market.

    1. 'TABLE OF CONTENTS
    2. EXECUTIVE SUMMARY
      1. MARKET ATTRACTIVENESS
    3. ANALYSIS
    4. GLOBAL FLOATING LIQUEFIED NATURAL GAS (FLNG) MARKET, BY TECHNOLOGY
      1. GLOBAL FLOATING LIQUEFIED
    5. NATURAL GAS (FLNG) MARKET, BY CAPACITY
      1. GLOBAL FLOATING LIQUEFIED NATURAL GAS (FLNG) MARKET,
    6. BY REGION
    7. MARKET INTRODUCTION
    8. DEFINITION
    9. SCOPE OF THE STUDY
    10. MARKET STRUCTURE
    11. KEY IMPLEMENTATION CRITERIA
    12. RESEARCH METHODOLOGY
    13. MARKET DYNAMICS
      1. INTRODUCTION
      2. DRIVERS
        1. INCREASE IN DEMAND FOR NATURAL GAS
        2. MONETIZATION OF
    14. OFFSHORE GAS
    15. RESTRAINTS
    16. HIGH CAPITAL INVESTMENTS AND LIMITED TECHNOLOGICAL ADVANCES
      1. OPPORTUNITIES
        1. GROWING MARKET FOR LNG AND UNLOCKING GAS RESERVES
    17. MARKET FACTOR ANALYSIS
      1. SUPPLY/VALUE CHAIN
    18. ANALYSIS
    19. PORTER FIVE FORCES
    20. THREAT OF NEW ENTRANTS
    21. BARGAINING POWER OF SUPPLIERS
      1. BARGAINING POWER OF BUYERS
        1. THREAT OF SUBSTITUTES:
        2. COMPETITIVE RIVALRY
      2. IMPACT OF CORONAVIRUS OUTBREAK ON THE GLOBAL
    22. FLOATING LIQUEFIED NATURAL GAS (FLNG) MARKET
      1. OVERVIEW OF SUPPLY AND DEMAND SCENARIO
        1. IMPACT OF COVID-19
    23. ON SUPPLY CHAIN ANALYSIS
    24. GLOBAL FLOATING LIQUEFIED NATURAL GAS (FLNG) MARKET, BY TECHNOLOGY
      1. INTRODUCTION
      2. LNG FPSO
      3. FSRU
      4. OTHERS
    25. GLOBAL FLOATING LIQUEFIED NATURAL
    26. GAS (FLNG) MARKET, BY CAPACITY
      1. INTRODUCTION
      2. SMALL/MID-SCALE
      3. OTHER
    27. GLOBAL FLOATING LIQUEFIED NATURAL GAS (FLNG) MARKET, BY REGION
      1. OVERVIEW
      2. NORTH AMERICA
        1. U.S.
        2. CANADA
      3. EUROPE
        1. GERMANY
        2. U.K.
        3. FRANCE
        4. ITALY
        5. SPAIN
        6. RUSSIA
        7. REST OF EUROPE
      4. ASIA-PACIFIC
        1. CHINA
        2. INDIA
        3. JAPAN
        4. SOUTH KOREA
        5. REST OF APAC
      5. MEA (MIDDLE EAST
    28. AND AFRICA)
    29. GCC
      1. SOUTH
    30. AFRICA
    31. ROMEA
      1. LATIN
    32. AMERICA
    33. BRAZIL
    34. MEXICO
    35. ARGENTINA
    36. ROLA (REST OF LATIN AMERICA)
    37. COMPETITIVE LANDSCAPE
      1. MARKET SHARE ANALYSIS
      2. COMPETITIVE BENCHMARKING
    38. COMPANY PROFILES
      1. WOODSIDE ENERGY GROUP LTD
        1. COMPANY OVERVIEW
        2. FINANCIAL OVERVIEW
        3. TYPES AND SERVICES
        4. SWOT ANALYSIS
        5. KEY STRATEGIES
      2. PETROLIAM NASIONAL
    39. BERHAD (PETRONAS)
    40. COMPANY OVERVIEW
    41. FINANCIAL OVERVIEW
    42. TYPES AND SERVICES
    43. SWOT ANALYSIS
    44. KEY STRATEGIES
    45. EXMAR, ABB LTD.
    46. COMPANY OVERVIEW
    47. FINANCIAL OVERVIEW
    48. TYPES AND SERVICES
    49. NEELKANTH FINECHEM LLP: SWOT ANALYSIS
      1. KEY STRATEGIES
      2. HOEGH LNG
        1. COMPANY OVERVIEW
        2. FINANCIAL OVERVIEW
        3. TYPES AND SERVICES
        4. SWOT ANALYSIS
        5. KEY STRATEGIES
      3. SHELL PLC
        1. COMPANY OVERVIEW
        2. FINANCIAL OVERVIEW
        3. TYPES AND SERVICES
        4. SWOT ANALYSIS
        5. KEY STRATEGIES
      4. EXCELERATE ENERGY, INC.
        1. COMPANY OVERVIEW
        2. FINANCIAL OVERVIEW
        3. TYPES AND SERVICES
        4. SWOT ANALYSIS
        5. KEY STRATEGIES
      5. BASF SE
        1. COMPANY OVERVIEW
        2. FINANCIAL OVERVIEW
        3. TYPES AND SERVICES
        4. SWOT ANALYSIS
        5. KEY STRATEGIES
      6. GOLAR LNG LIMITED
        1. COMPANY OVERVIEW
        2. FINANCIAL OVERVIEW
        3. TYPES AND SERVICES
        4. SWOT ANALYSIS
        5. KEY STRATEGIES
      7. MITSUI O.S.K.LINES
        1. COMPANY OVERVIEW
        2. FINANCIAL OVERVIEW
        3. TYPES AND SERVICES
        4. SWOT ANALYSIS
        5. KEY STRATEGIES
      8. ENI S.P.A.
        1. COMPANY OVERVIEW
        2. FINANCIAL OVERVIEW
        3. TYPES AND SERVICES
        4. SWOT ANALYSIS
        5. KEY STRATEGIES
    50. MARKET, BY TECHNOLOGY, 2018-2032 (USD MILLION)
    51. MARKET, FOR LNG FPSO, BY TECHNOLOGY, 2018-2032 (USD MILLION)
    52. MARKET, FOR FSRU, BY TECHNOLOGY, 2018-2032 (USD MILLION)
    53. MARKET, FOR OTHERS, BY TECHNOLOGY, 2018-2032 (USD MILLION)
    54. MARKET, BY CAPACITY, 2018-2032 (USD MILLION)
    55. MARKET, FOR SMALL/MID-SCALE, BY CAPACITY, 2018-2032 (USD MILLION)
    56. NATURAL GAS (FLNG) MARKET, FOR LARGE SCALE, BY CAPACITY, 2018-2032 (USD MILLION)
    57. LIQUEFIED NATURAL GAS (FLNG) MARKET, FOR OTHERS, BY CAPACITY, 2018-2032 (USD MILLION)
    58. LIQUEFIED NATURAL GAS (FLNG) MARKET, BY REGION, 2018-2032 (USD MILLION)
    59. FLOATING LIQUEFIED NATURAL GAS (FLNG) MARKET, BY COUNTRY, 2018-2032 (USD MILLION)
    60. FLOATING LIQUEFIED NATURAL GAS (FLNG) MARKET, BY TECHNOLOGY, 2018-2032 (USD MILLION)
    61. FLOATING LIQUEFIED NATURAL GAS (FLNG) MARKET, BY CAPACITY, 2018-2032 (USD MILLION)
    62. LIQUEFIED NATURAL GAS (FLNG) MARKET, BY TECHNOLOGY, 2018-2032 (USD MILLION)
    63. LIQUEFIED NATURAL GAS (FLNG) MARKET, BY CAPACITY, 2018-2032 (USD MILLION)
    64. LIQUEFIED NATURAL GAS (FLNG) MARKET, BY TECHNOLOGY, 2018-2032 (USD MILLION)
    65. LIQUEFIED NATURAL GAS (FLNG) MARKET, BY CAPACITY, 2018-2032 (USD MILLION)
    66. LIQUEFIED NATURAL GAS (FLNG) MARKET, BY COUNTRY, 2018-2032 (USD MILLION)
    67. LIQUEFIED NATURAL GAS (FLNG) MARKET, BY TECHNOLOGY, 2018-2032 (USD MILLION)
    68. LIQUEFIED NATURAL GAS (FLNG) MARKET, BY CAPACITY, 2018-2032 (USD MILLION)
    69. LIQUEFIED NATURAL GAS (FLNG) MARKET, BY TECHNOLOGY, 2018-2032 (USD MILLION)
    70. LIQUEFIED NATURAL GAS (FLNG) MARKET, BY CAPACITY, 2018-2032 (USD MILLION)
    71. LIQUEFIED NATURAL GAS (FLNG) MARKET, BY TECHNOLOGY, 2018-2032 (USD MILLION)
    72. LIQUEFIED NATURAL GAS (FLNG) MARKET, BY CAPACITY, 2018-2032 (USD MILLION)
    73. LIQUEFIED NATURAL GAS (FLNG) MARKET, BY TECHNOLOGY, 2018-2032 (USD MILLION)
    74. LIQUEFIED NATURAL GAS (FLNG) MARKET, BY CAPACITY, 2018-2032 (USD MILLION)
    75. LIQUEFIED NATURAL GAS (FLNG) MARKET, BY TECHNOLOGY, 2018-2032 (USD MILLION)
    76. LIQUEFIED NATURAL GAS (FLNG) MARKET, BY CAPACITY, 2018-2032 (USD MILLION)
    77. LIQUEFIED NATURAL GAS (FLNG) MARKET, BY TECHNOLOGY, 2018-2032 (USD MILLION)
    78. LIQUEFIED NATURAL GAS (FLNG) MARKET, BY CAPACITY, 2018-2032 (USD MILLION)
    79. LIQUEFIED NATURAL GAS (FLNG) MARKET, BY TECHNOLOGY, 2018-2032 (USD MILLION)
    80. LIQUEFIED NATURAL GAS (FLNG) MARKET, BY CAPACITY, 2018-2032 (USD MILLION
    81. LIQUEFIED NATURAL GAS (FLNG) MARKET, BY TECHNOLOGY, 2018-2032 (USD MILLION)
    82. LIQUEFIED NATURAL GAS (FLNG) MARKET, BY CAPACITY, 2018-2032 (USD MILLION)
    83. FLOATING LIQUEFIED NATURAL GAS (FLNG) MARKET, BY COUNTRY, 2018-2032 (USD MILLION)
    84. FLOATING LIQUEFIED NATURAL GAS (FLNG) MARKET, BY TECHNOLOGY, 2018-2032 (USD MILLION)
    85. FLOATING LIQUEFIED NATURAL GAS (FLNG) MARKET, BY CAPACITY, 2018-2032 (USD MILLION)
    86. LIQUEFIED NATURAL GAS (FLNG) MARKET, BY TECHNOLOGY, 2018-2032 (USD MILLION)
    87. LIQUEFIED NATURAL GAS (FLNG) MARKET, BY CAPACITY, 2018-2032 (USD MILLION)
    88. LIQUEFIED NATURAL GAS (FLNG) MARKET, BY TECHNOLOGY, 2018-2032 (USD MILLION)
    89. LIQUEFIED NATURAL GAS (FLNG) MARKET, BY CAPACITY, 2018-2032 (USD MILLION)
    90. LIQUEFIED NATURAL GAS (FLNG) MARKET, BY TECHNOLOGY, 2018-2032 (USD MILLION)
    91. LIQUEFIED NATURAL GAS (FLNG) MARKET, BY CAPACITY, 2018-2032 (USD MILLION)
    92. FLOATING LIQUEFIED NATURAL GAS (FLNG) MARKET, BY TECHNOLOGY, 2018-2032 (USD MILLION)
    93. FLOATING LIQUEFIED NATURAL GAS (FLNG) MARKET, BY CAPACITY, 2018-2032 (USD MILLION)
    94. FLOATING LIQUEFIED NATURAL GAS (FLNG) MARKET, BY TECHNOLOGY, 2018-2032 (USD MILLION)
    95. FLOATING LIQUEFIED NATURAL GAS (FLNG) MARKET, BY CAPACITY, 2018-2032 (USD MILLION)
    96. LIQUEFIED NATURAL GAS (FLNG) MARKET, BY COUNTRY, 2018-2032 (USD MILLION)
    97. LIQUEFIED NATURAL GAS (FLNG) MARKET, BY TECHNOLOGY, 2018-2032 (USD MILLION)
    98. LIQUEFIED NATURAL GAS (FLNG) MARKET, BY CAPACITY, 2018-2032 (USD MILLION)
    99. LIQUEFIED NATURAL GAS (FLNG) MARKET, BY TECHNOLOGY, 2018-2032 (USD MILLION)
    100. LIQUEFIED NATURAL GAS (FLNG) MARKET, BY CAPACITY, 2018-2032 (USD MILLION)
    101. FLOATING LIQUEFIED NATURAL GAS (FLNG) MARKET, BY TECHNOLOGY, 2018-2032 (USD MILLION)
    102. FLOATING LIQUEFIED NATURAL GAS (FLNG) MARKET, BY CAPACITY, 2018-2032 (USD MILLION)
    103. LIQUEFIED NATURAL GAS (FLNG) MARKET, BY TECHNOLOGY, 2018-2032 (USD MILLION)
    104. LIQUEFIED NATURAL GAS (FLNG) MARKET, BY CAPACITY, 2018-2032 (USD MILLION)
    105. FLOATING LIQUEFIED NATURAL GAS (FLNG) MARKET, BY COUNTRY, 2018-2032 (USD MILLION)
    106. FLOATING LIQUEFIED NATURAL GAS (FLNG) MARKET, BY TECHNOLOGY, 2018-2032 (USD MILLION)
    107. FLOATING LIQUEFIED NATURAL GAS (FLNG) MARKET, BY CAPACITY, 2018-2032 (USD MILLION)
    108. LIQUEFIED NATURAL GAS (FLNG) MARKET, BY TECHNOLOGY, 2018-2032 (USD MILLION)
    109. LIQUEFIED NATURAL GAS (FLNG) MARKET, BY CAPACITY, 2018-2032 (USD MILLION)
    110. LIQUEFIED NATURAL GAS (FLNG) MARKET, BY TECHNOLOGY, 2018-2032 (USD MILLION)
    111. LIQUEFIED NATURAL GAS (FLNG) MARKET, BY CAPACITY, 2018-2032 (USD MILLION)
    112. LIQUEFIED NATURAL GAS (FLNG) MARKET, BY TECHNOLOGY, 2018-2032 (USD MILLION)
    113. LIQUEFIED NATURAL GAS (FLNG) MARKET, BY CAPACITY, 2018-2032 (USD MILLION)
    114. LIQUEFIED NATURAL GAS (FLNG) MARKET, BY TECHNOLOGY, 2018-2032 (USD MILLION)
    115. LIQUEFIED NATURAL GAS (FLNG) MARKET, BY CAPACITY, 2018-2032 (USD MILLION)
    116. ANALYSIS: GLOBAL FLOATING LIQUEFIED NATURAL GAS (FLNG)
    117. ANALYSIS BY TECHNOLOGY, % SHARE, 2023, MARKET SIZE, 2018-2032
    118. NATURAL GAS (FLNG) ANALYSIS BY CAPACITY, % SHARE, 2023, MARKET SIZE, 2018-2032
    119. LIQUEFIED NATURAL GAS (FLNG) ANALYSIS BY REGION, 2023
    120. MARKET: MARKET STRUCTURE
    121. REPORT
    122. BOTTOM-UP AND TOP-DOWN APPROACHES
    123. LIQUEFIED NATURAL GAS (FLNG) MARKET
    124. NATURAL GAS (FLNG) MARKET
    125. (% SHARE), 2023 VS 2030 (USD MILLION)
    126. MARKET, BY TECHNOLOGY, 2023 (% SHARE), 2023 VS 2030 (USD MILLION)
    127. NATURAL GAS (FLNG) MARKET, BY REGION, 2021 (% SHARE) 2021 VS 2030 (USD MILLION)
    128. FLOATING LIQUEFIED NATURAL GAS (FLNG) MARKET, BY COUNTRY, 2023 (USD BILLION)
    129. LIQUEFIED NATURAL GAS (FLNG) MARKET, BY COUNTRY, 2023 (REVENUE % SHARE)
    130. FLOATING LIQUEFIED NATURAL GAS (FLNG) MARKET, BY COUNTRY, 2023 (REVENUE % SHARE)
    131. LIQUEFIED NATURAL GAS (FLNG) MARKET, BY COUNTRY, 2023 (REVENUE % SHARE)
    132. FLOATING LIQUEFIED NATURAL GAS (FLNG) MARKET, BY COUNTRY, 2023 (REVENUE % SHARE)
    133. ANALYSIS (2023, %) *
    134. GLOBAL FLOATING LIQUEFIED NATURAL GAS (FLNG) MARKET: COMPETITIVE BENCHMARKING'

    Floating Liquefied Natural Gas (FLNG) Market Segmentation

    Floating Liquefied Natural Gas (FLNG) Technology Outlook (USD Million, 2019-2030)

    • LNG FPSO
    • FSRU
    • Others

    Floating Liquefied Natural Gas (FLNG) Capacity Outlook (USD Million, 2019-2030)

    • Small/Mid-Scale
    • Large Scale
    • Others

    Reciprocating Compressors for Hydrogen & Carbon Capture Regional Outlook (USD Million, 2019-2030)

    • North America Outlook (USD Million, 2019-2030)

      • North America Floating Liquefied Natural Gas (FLNG) Technology Outlook (USD Million, 2019-2030)

        • LNG FPSO

        • FSRU

        • Others

      • North America Floating Liquefied Natural Gas (FLNG) Capacity Outlook (USD Million, 2019-2030)

        • Small/Mid-Scale

        • Large Scale

        • Others

      • US Outlook (USD Million, 2019-2030)

        • US Floating Liquefied Natural Gas (FLNG) Technology Outlook (USD Million, 2019-2030)

          • LNG FPSO

          • FSRU

          • Others

        • US Floating Liquefied Natural Gas (FLNG) Capacity Outlook (USD Million, 2019-2030)

          • Small/Mid-Scale

          • Large Scale

          • Others

      • Canada Outlook (USD Million, 2019-2030)

        • Canada Floating Liquefied Natural Gas (FLNG) Technology Outlook (USD Million, 2019-2030)

          • LNG FPSO

          • FSRU

          • Others

        • Canada Floating Liquefied Natural Gas (FLNG) Capacity Outlook (USD Million, 2019-2030)

          • Small/Mid-Scale

          • Large Scale

          • Others

    • Europe Outlook (USD Million, 2019-2030)

      • Europe Floating Liquefied Natural Gas (FLNG) Technology Outlook (USD Million, 2019-2030)

        • LNG FPSO

        • FSRU

        • Others

      • Europe Floating Liquefied Natural Gas (FLNG) Capacity Outlook (USD Million, 2019-2030)

        • Small/Mid-Scale

        • Large Scale

        • Others

      • GERMANY Outlook (USD Million, 2019-2030)

        • Floating Liquefied Natural Gas (FLNG) Technology Outlook (USD Million, 2019-2030)

          • LNG FPSO

          • FSRU

          • Others

        • GERMANY Floating Liquefied Natural Gas (FLNG) Capacity Outlook (USD Million, 2019-2030)

          • Small/Mid-Scale

          • Large Scale

          • Others

      • Spain Outlook (USD Million, 2019-2030)

        • Spain Floating Liquefied Natural Gas (FLNG) Technology Outlook (USD Million, 2019-2030)

          • LNG FPSO

          • FSRU

          • Others

        • Spain Floating Liquefied Natural Gas (FLNG) Capacity Outlook (USD Million, 2019-2030)

          • Small/Mid-Scale

          • Large Scale

          • Others

      • REST OF EUROPE Outlook (USD Million, 2019-2030)

        • REST OF EUROPE Floating Liquefied Natural Gas (FLNG) Technology Outlook (USD Million, 2019-2030)

          • LNG FPSO

          • FSRU

          • Others

        • REST OF EUROPE Floating Liquefied Natural Gas (FLNG) Capacity Outlook (USD Million, 2019-2030)

          • Small/Mid-Scale

          • Large Scale

          • Others

      • Asia-Pacific Floating Liquefied Natural Gas (FLNG) Technology Outlook (USD Million, 2019-2030)

        • LNG FPSO

        • FSRU

        • Others

      • Asia-Pacific Floating Liquefied Natural Gas (FLNG) Capacity Outlook (USD Million, 2019-2030)

        • Small/Mid-Scale

        • Large Scale

        • Others

      • CHINA Outlook (USD Million, 2019-2030)

        • CHINA Floating Liquefied Natural Gas (FLNG) Technology Outlook (USD Million, 2019-2030)

          • LNG FPSO

          • FSRU

          • Others

        • CHINA Floating Liquefied Natural Gas (FLNG) Capacity Outlook (USD Million, 2019-2030)

          • Small/Mid-Scale

          • Large Scale

          • Others

      • India Outlook (USD Million, 2019-2030)

        • India Floating Liquefied Natural Gas (FLNG) Technology Outlook (USD Million, 2019-2030)

          • LNG FPSO

          • FSRU

          • Others

        • India Floating Liquefied Natural Gas (FLNG) Capacity Outlook (USD Million, 2019-2030)

          • Small/Mid-Scale

          • Large Scale

          • Others

      • JAPAN Outlook (USD Million, 2019-2030)

        • JAPAN Floating Liquefied Natural Gas (FLNG) Technology Outlook (USD Million, 2019-2030)

          • LNG FPSO

          • FSRU

          • Others

        • JAPAN Floating Liquefied Natural Gas (FLNG) Capacity Outlook (USD Million, 2019-2030)

          • Small/Mid-Scale

          • Large Scale

          • Others

      • South Korea Outlook (USD Million, 2019-2030)

        • South Korea Floating Liquefied Natural Gas (FLNG) Technology Outlook (USD Million, 2019-2030)

          • LNG FPSO

          • FSRU

          • Others

        • South Korea Floating Liquefied Natural Gas (FLNG) Capacity Outlook (USD Million, 2019-2030)

          • Small/Mid-Scale

          • Large Scale

          • Others

      • REST OF ASIA-PACIFIC Outlook (USD Million, 2019-2030)

        • REST OF ASIA-PACIFIC Floating Liquefied Natural Gas (FLNG) Technology Outlook (USD Million, 2019-2030)

          • LNG FPSO

          • FSRU

          • Others

        • REST OF ASIA-PACIFIC Floating Liquefied Natural Gas (FLNG) Capacity Outlook (USD Million, 2019-2030)

          • Small/Mid-Scale

          • Large Scale

          • Others

    • Rest of World Outlook (USD Million, 2019-2030)

      • Rest of World Floating Liquefied Natural Gas (FLNG) Technology Outlook (USD Million, 2019-2030)

        • LNG FPSO

        • FSRU

        • Others

      • Rest of World Floating Liquefied Natural Gas (FLNG) Capacity Outlook (USD Million, 2019-2030)

        • Small/Mid-Scale

        • Large Scale

        • Others

      • LATIN AMERICA Outlook (USD Million, 2019-2030)

        • LATIN AMERICA Floating Liquefied Natural Gas (FLNG) Technology Outlook (USD Million, 2019-2030)

          • LNG FPSO

          • FSRU

          • Others

        • LATIN AMERICA Floating Liquefied Natural Gas (FLNG) Capacity Outlook (USD Million, 2019-2030)

          • Small/Mid-Scale

          • Large Scale

          • Others

      • Middle East & Africa Outlook (USD Million, 2019-2030)

        • Middle East & Africa Floating Liquefied Natural Gas (FLNG) Technology Outlook (USD Million, 2019-2030)

          • LNG FPSO

          • FSRU

          • Others

        • Middle East & Africa Floating Liquefied Natural Gas (FLNG) Capacity Outlook (USD Million, 2019-2030)

          • Small/Mid-Scale

          • Large Scale

          • Others

    Report Infographic
    Free Sample Request

    Kindly complete the form below to receive a free sample of this Report

    Customer Strories

    “I am very pleased with how market segments have been defined in a relevant way for my purposes (such as "Portable Freezers & refrigerators" and "last-mile"). In general the report is well structured. Thanks very much for your efforts.”

    Victoria Milne Founder
    Case Study

    Chemicals and Materials