• Cat-intel
  • MedIntelliX
  • Resources
  • About Us
  • Request Free Sample ×

    Kindly complete the form below to receive a free sample of this Report

    Leading companies partner with us for data-driven Insights

    clients tt-cursor

    Augmented Virtual Reality Handheld Device Market

    ID: MRFR/SEM/29694-HCR
    128 Pages
    Shubham Munde
    September 2025

    Augmented Virtual Reality Handheld Device Market Research Report By Device Type (Smart Glasses, Handheld Controllers, Wearable Headsets, Haptic Devices), By Application Area (Gaming, Education and Training, Healthcare, Real Estate, Retail), By Technology Adoption (Consumer Adoption, Enterprise Adoption, Research and Development), By User Demographics (Children, Young Adults, Adults, Senior Citizens), By Interaction Method (Touch Input, Voice Control, Gesture Recognition, Motion Tracking) and By Regional (North America, Europe, South America,...

    Share:
    Download PDF ×

    We do not share your information with anyone. However, we may send you emails based on your report interest from time to time. You may contact us at any time to opt-out.

    Augmented Virtual Reality Handheld Device Market Research Report - Global Forecast till 2034 Infographic
    Purchase Options
    $ 4,950.0
    $ 5,950.0
    $ 7,250.0
    Table of Contents

    Augmented Virtual Reality Handheld Device Market Summary

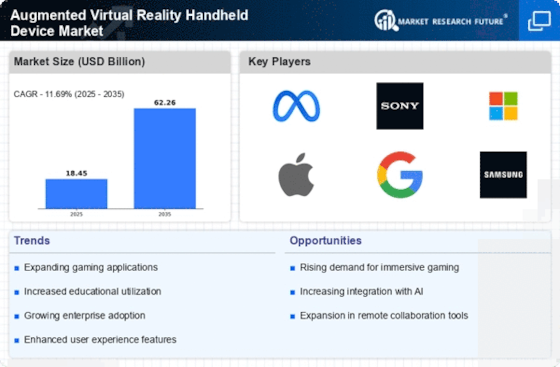
    The Global Augmented Virtual Reality Handheld Device Market is projected to grow significantly from 18.4 USD Billion in 2024 to 55.7 USD Billion by 2035.

    Key Market Trends & Highlights

    Augmented Virtual Reality Handheld Device Key Trends and Highlights

    • The market is expected to experience a compound annual growth rate (CAGR) of 10.58 percent from 2025 to 2035.
    • By 2035, the market valuation is anticipated to reach 55.7 USD Billion, indicating robust growth potential.
    • In 2024, the market is valued at 18.4 USD Billion, reflecting a strong foundation for future expansion.
    • Growing adoption of augmented reality technology due to increasing demand for immersive experiences is a major market driver.

    Market Size & Forecast

    2024 Market Size 18.4 (USD Billion)
    2035 Market Size 55.7 (USD Billion)
    CAGR (2025-2035) 10.58%

    Major Players

    Microsoft, HTC, Lenovo, Pimax, Snap, Oculus, Samsung, Magic Leap, Meta Platforms, Apple, Qualcomm, Vive, Nreal, Google, Sony

    Augmented Virtual Reality Handheld Device Market Trends

    The Augmented Virtual Reality Handheld Device Market is witnessing significant growth driven by advancements in technology and consumer demand for immersive experiences. Key market drivers include the increasing adoption of augmented reality (AR) and virtual reality (VR) applications in gaming, entertainment, and education.

    The rise in smartphone penetration and the development of more sophisticated hardware are also pivotal, as they enhance user experiences and encourage content creation. Additionally, the expansion of the Internet of Things (IoT) and improvements in network connectivity facilitate the seamless integration of AR and VR technologies into daily life, further supporting market growth.

    In terms of opportunities to be explored, the market is poised for expansion in sectors such as healthcare, where AR and VR can be employed for training medical professionals or for patient rehabilitation.

    The retail sector also presents a fertile ground, with brands increasingly seeking to utilize augmented reality to enhance consumer shopping experiences through virtual try-on solutions. Moreover, the rise of remote work and virtual collaboration tools in recent times has highlighted the need for effective AR and VR solutions that can improve communication and teamwork beyond traditional methods.

    Trends in recent times reveal a growing interest in cross-platform compatibility, as consumers desire flexibility in how they engage with content. Furthermore, the integration of artificial intelligence into AR and VR systems is enhancing personalization and user interaction, making these technologies more appealing.

    As hardware becomes more affordable and accessible, and as the industry continues to innovate, the potential for widespread adoption of handheld AR and VR devices appears promising, paving the way for richer, more engaging experiences across numerous applications.

    Source: Primary Research, Secondary Research, MRFR Database and Analyst Review

    The integration of augmented and virtual reality technologies into handheld devices is poised to redefine user interaction across various sectors, enhancing both productivity and immersive experiences.

    U.S. Department of Commerce

    Augmented Virtual Reality Handheld Device Market Drivers

    Market Growth Projections

    The Global Augmented Virtual Reality Handheld Device Market Industry is projected to experience substantial growth, with market size expected to reach 55.7 USD Billion by 2035. This growth trajectory reflects the increasing adoption of augmented reality technologies across various sectors, including entertainment, education, and healthcare. The anticipated compound annual growth rate of 10.58% from 2025 to 2035 indicates a robust market environment, driven by continuous technological advancements and rising consumer demand for immersive experiences. As industries recognize the potential of AR, the market is likely to witness a proliferation of innovative handheld devices designed to meet diverse consumer needs.

    Technological Advancements in AR/VR

    Technological advancements play a pivotal role in shaping the Global Augmented Virtual Reality Handheld Device Market Industry. Innovations in hardware and software, such as improved graphics, processing power, and user interfaces, enhance the overall user experience. For example, the integration of artificial intelligence and machine learning into AR applications allows for more personalized and adaptive experiences. As these technologies continue to evolve, they are likely to drive market growth, with projections suggesting a compound annual growth rate of 10.58% from 2025 to 2035. This trend underscores the importance of continuous innovation in maintaining competitive advantage.

    Increased Investment in AR/VR Startups

    The Global Augmented Virtual Reality Handheld Device Market Industry benefits from increased investment in AR and VR startups, fostering innovation and development. Venture capitalists and tech giants are recognizing the potential of augmented reality applications across various industries, leading to a surge in funding. This influx of capital enables startups to develop cutting-edge handheld devices that cater to diverse consumer needs. As a result, the market is likely to see a proliferation of new products and services, enhancing competition and driving growth. This trend is indicative of the broader recognition of AR/VR technologies as vital components of future digital experiences.

    Rising Demand for Immersive Experiences

    The Global Augmented Virtual Reality Handheld Device Market Industry experiences a surge in demand for immersive experiences across various sectors, including gaming, education, and healthcare. As consumers increasingly seek engaging and interactive content, handheld devices that offer augmented reality capabilities become essential. For instance, the gaming sector is projected to significantly contribute to the market, with revenues expected to reach 18.4 USD Billion in 2024. This growing interest in immersive technology indicates a shift in consumer preferences, compelling manufacturers to innovate and enhance their offerings to meet these evolving demands.

    Growing Adoption in Education and Training

    The Global Augmented Virtual Reality Handheld Device Market Industry is witnessing growing adoption in the education and training sectors. Educational institutions are increasingly integrating AR technologies into their curricula to enhance learning outcomes and engagement. For instance, handheld devices that provide interactive simulations and real-time feedback are transforming traditional teaching methods. This trend is particularly evident in vocational training, where AR applications facilitate hands-on learning experiences. As educational institutions recognize the benefits of augmented reality, the market is expected to expand, driven by the need for innovative teaching tools that cater to diverse learning styles.

    Expansion of AR/VR Applications in Healthcare

    The Global Augmented Virtual Reality Handheld Device Market Industry is experiencing expansion in healthcare applications, where augmented reality is revolutionizing patient care and medical training. Handheld devices equipped with AR capabilities enable healthcare professionals to visualize complex medical data, enhancing diagnostic accuracy and treatment planning. For example, AR applications are being utilized in surgical training, allowing medical students to practice procedures in a risk-free environment. This growing integration of AR in healthcare not only improves patient outcomes but also drives market growth as healthcare providers increasingly adopt these technologies to enhance their services.

    Market Segment Insights

    Augmented Virtual Reality Handheld Device Market Device Type Insights

    The Augmented Virtual Reality Handheld Device Market is poised for substantial growth, reflecting a significant trajectory in the overall market valuation, which is expected to reach USD 40.0 billion by 2032, up from USD 14.78 billion in 2023.

    Within this broader market, the Device Type segmentation reveals intriguing insights. The Smart Glasses sub-segment, with a market valuation of USD 4.45 billion in 2023, is forecasted to grow to USD 12.25 billion by 2032.

    This growth is attributed to their versatility in applications ranging from enterprise solutions to consumer-grade products, greatly enhancing user engagement and operational efficiency across industries like healthcare, education, and manufacturing.

    Handheld Controllers, another vital segment, valued at USD 3.74 billion in 2023, is anticipated to reach USD 10.25 billion by 2032. This segment's growth is supported by the increasing incorporation of motion-sensing technologies and user-friendly designs that enhance user experience, particularly in gaming and training simulations.

    Following closely is the Wearable Headsets segment, which stands at a valuation of USD 5.14 billion in 2023 and is expected to surge to USD 13.5 billion by 2032. The uptick in this segment is largely influenced by the demand for high-quality immersive content and the ongoing integration of AI and machine learning to improve interactive capabilities.

    Lastly, the Haptic Devices sub-segment, though smaller, with a valuation of USD 1.45 billion in 2023, is projected to grow to USD 4.0 billion by 2032.

    Augmented Virtual Reality Handheld Device Market Application Area Insights

    The Augmented Virtual Reality Handheld Device Market is projected to experience significant growth across various application areas, with the market expected to reach a value of 40.0 USD billion by 2032, growing from 14.78 USD billion in 2023.

    Within specific application areas, the Gaming sector leads, reflecting a strong consumer interest and increasing investments in AR/VR technologies; handheld controllers are projected to grow from 3.74 USD billion in 2023 to 10.25 USD billion in 2032.

    Similarly, the Education and Training segment is gaining traction, emphasizing the utility of Augmented and Virtual Reality in creating interactive learning environments.

    The Healthcare industry is also a prominent segment, with applications in training simulations and remote consultations, while the Real Estate sector benefits from enhanced property visualization. Additionally, the Retail sector is harnessing these technologies for enriched customer experiences, evidencing market-diversified opportunities.

    Smart glasses, wearable headsets, and haptic devices are all important components of the Augmented Virtual Reality Handheld Device Market, indicating an evolving landscape with various potential growth trajectories as indicated by the Augmented Virtual Reality Handheld Device Market statistics.

    Augmented Virtual Reality Handheld Device Market Technology Adoption Insights

    The Technology Adoption segment of the Augmented Virtual Reality Handheld Device Market is poised for substantial growth, with the overall market expected to reach a valuation of approximately 14.78 USD billion in 2023 and projected to rise to around 40.0 USD billion by 2032.

    Within this segment, Consumer Adoption is expected to significantly influence market dynamics as smart glasses, handheld controllers, wearable headsets, and haptic devices gain traction among tech-savvy individuals.

    The smart glasses sub-segment, starting at a valuation of 4.45 USD billion in 2023, is expected to expand to 12.25 USD billion by 2032, reflecting a growing consumer interest in immersive experiences. Similarly, the handheld controllers segment, valued at 3.74 USD billion in 2023, is projected to reach 10.25 USD billion by 2032, driven by advancements in gaming and interactive applications.

    Enterprise Adoption presents another vital aspect of the market, fostering the integration of augmented and virtual reality into training, design, and operational efficiencies, while Research and Development initiatives are crucial for innovating next-generation devices.

    Overall, the Augmented Virtual Reality Handheld Device Market statistics illustrate a rapidly evolving landscape filled with opportunities as businesses and consumers alike pursue enhanced technological experiences.

    Augmented Virtual Reality Handheld Device Market User Demographics Insights

    This growth is being driven by a diverse user demographic that includes Children, Young Adults, Adults, and Senior Citizens, each displaying distinct preferences and engagement levels with augmented and virtual reality technologies.

    Children are highly engaged with user-friendly devices, particularly in gaming and educational tools, while Young Adults tend to drive innovation, driving high demand for interactive and immersive experiences, with expectations for significant revenue growth in smart glasses and handheld controllers, valued at 12.25 USD billion and 10.25 USD billion respectively by 2032.

    Adults utilize these devices for both work and leisure, showing interest in wearable headsets, which are projected to reach a value of 13.5 USD billion, reflecting the increasing integration of AR/VR in professional environments.

    Senior Citizens represent a growing segment, gaining interest in health and wellness applications, with Haptic Devices demonstrating potential with projected revenues of 4.0 USD billion.

    This diverse user base highlights the unfolding opportunities and market growth across different age groups within the Augmented Virtual Reality Handheld Device Market, establishing an essential landscape for future development and innovation.

    Augmented Virtual Reality Handheld Device Market Interaction Method Insights

    The Interaction Method segment of the Augmented Virtual Reality Handheld Device Market is gaining significant traction, contributing notably to the overall market growth, which is expected to reach a valuation of $40.0 billion by 2032, up from $14.78 billion in 2023.

    This segment encompasses several innovative technologies, including Touch Input, Voice Control, Gesture Recognition, and Motion Tracking, each contributing distinct features and engaging user experiences. In particular, Touch Input is enhancing user interactivity with a more tactile experience, while Voice Control simplifies navigation through hands-free commands.

    Gesture Recognition is revolutionizing the way users interact, allowing for intuitive movements that translate actions seamlessly into virtual environments. Motion Tracking further enriches user immersion by accurately monitoring physical movements, thus augmenting the overall experience.

    The increasing adoption of such technologies is driven by the growing demand for more interactive and immersive environments, spurred by advancements in hardware and software capabilities.

    The Augmented Virtual Reality Handheld Device Market data indicates a marked rise in consumer and enterprise applications, allowing for an increasingly versatile use of handheld devices in education, gaming, and training.

    Get more detailed insights about Augmented Virtual Reality Handheld Device Market Research Report - Global Forecast till 2034

    Regional Insights

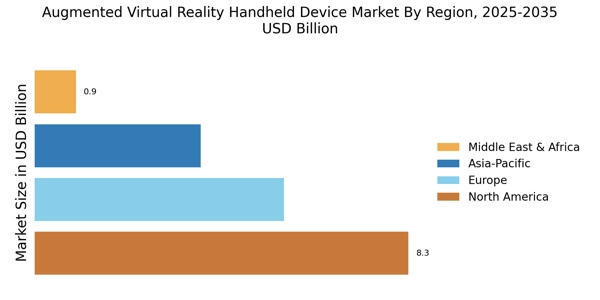
    North America leads the market, driven by increasing demand for advanced gaming and education applications, while Europe follows closely, supported by strong technological infrastructure and investment in AR/VR research.

    The APAC region is set to witness rapid expansion as countries like China and Japan prioritize technology adoption and innovation in handheld devices.

    South America is emerging as a promising market, fueled by rising consumer interest in AR applications in the entertainment and training sectors. Meanwhile, the MEA region is gradually adopting augmented reality solutions, primarily in retail and education, indicating potential for growth.

    Augmented Virtual Reality Handheld Device Market Regional Insights

    Source: Primary Research, Secondary Research, MRFR Database and Analyst Review

    Key Players and Competitive Insights

    The Augmented Virtual Reality Handheld Device Market is witnessing significant competitive dynamics driven by technological advancements and a growing consumer appetite for immersive experiences. This market is characterized by a diverse range of players, each striving to establish a foothold in an environment marked by rapid innovation and fierce rivalry.

    Companies in this sector are continually enhancing their product offerings to cater to various segments, including gaming, education, healthcare, and more.

    As augmented and virtual reality technologies continue to evolve, the competitive landscape is shaped by not only the development of cutting-edge hardware but also software capabilities that enhance user engagement. Key players are focusing on strategic partnerships, collaborations, and acquisitions to bolster their market positions and expand their reach on a global scale.

    Microsoft has established itself as a formidable entity within the Augmented Virtual Reality Handheld Device Market, leveraging its extensive expertise in software engineering and cloud technology. The company’s strengths lie in its comprehensive ecosystem, which facilitates seamless integration between hardware and software.

    Microsoft’s powerful platform is enhanced by its strong emphasis on enterprise applications, positioning it as an appealing choice for businesses looking to implement augmented reality solutions.

    Furthermore, its commitment to innovation is exemplified by ongoing investments in Research and Development, allowing Microsoft to maintain a competitive edge. The company's robust brand recognition, coupled with strategic alliances across various industries, has enabled it to build a loyal customer base and penetrate different market segments effectively.

    HTC is another key player in the Augmented Virtual Reality Handheld Device Market, recognized for its pioneering contributions and a strong focus on immersive technology. HTC's strengths stem from its deep-rooted experience in both VR hardware and content creation, which allows it to deliver high-quality immersive experiences to users.

    The company has adeptly positioned itself to cater to a diverse audience, ranging from consumers to professionals in various sectors, including gaming and education. HTC's commitment to innovation is showcased through its constant enhancements to product features and user interface, ensuring that its offerings remain competitive in a fast-evolving market.

    Their emphasis on community engagement and developer support has fostered a vibrant ecosystem that enhances user retention and encourages widespread adoption of their devices.

    Key Companies in the Augmented Virtual Reality Handheld Device Market market include

    Industry Developments

    The Augmented Virtual Reality Handheld Device Market is experiencing significant developments driven by technological advancements and increasing consumer demand.

    Major players in the industry are focusing on enhancing user experiences through improved hardware capabilities and software applications that support immersive experiences. Recently, partnerships between tech companies and gaming developers have emerged to create more engaging content for these devices, fueling market growth.

    Furthermore, the rise in remote working and virtual collaboration has accelerated the adoption of AR and VR technologies across various sectors, including education, healthcare, and entertainment.

    Investments in research and development are at an all-time high as companies aim to innovate and stay competitive. Additionally, regulatory changes in key regions are influencing market dynamics, encouraging the integration of AR and VR solutions in everyday applications.

    The future outlook remains positive, with projections indicating substantial growth in market value as new technologies and applications continue to emerge, catering to an increasingly tech-savvy consumer base. This shift is expected to reshape consumer interactions, paving the way for novel use cases and a holistic approach to augmented and virtual reality solutions in handheld formats.

    Future Outlook

    Augmented Virtual Reality Handheld Device Market Future Outlook

    The Augmented Virtual Reality Handheld Device Market is projected to grow at a 10.58% CAGR from 2024 to 2035, driven by technological advancements and increasing consumer demand.

    New opportunities lie in:

    • Develop immersive educational tools for remote learning environments.
    • Create partnerships with gaming companies to enhance user experiences.
    • Invest in health and wellness applications for therapeutic uses.

    By 2035, the market is expected to achieve substantial growth, reflecting robust innovation and consumer engagement.

    Market Segmentation

    Augmented Virtual Reality Handheld Device Market Regional Outlook

    • North America
    • Europe
    • South America
    • Asia Pacific
    • Middle East and Africa

    Augmented Virtual Reality Handheld Device Market Device Type Outlook

    • Gaming
    • Education and Training
    • Healthcare
    • Real Estate
    • Retail

    Augmented Virtual Reality Handheld Device Market Application Area Outlook

    • Consumer Adoption
    • Enterprise Adoption
    • Research and Development

    Augmented Virtual Reality Handheld Device Market User Demographics Outlook

    • Touch Input
    • Voice Control
    • Gesture Recognition
    • Motion Tracking

    Augmented Virtual Reality Handheld Device Market Interaction Method Outlook

    • North America
    • Europe
    • South America
    • Asia Pacific
    • Middle East and Africa

    Augmented Virtual Reality Handheld Device Market Technology Adoption Outlook

    • Children
    • Young Adults
    • Adults
    • Senior Citizens

    Report Scope

    Report Attribute/Metric Details
    Market Size 2024 USD 18.44 Billion
    Market Size 2025 USD 20.60 Billion
    Market Size 2034 USD 55.74 Billion
    Compound Annual Growth Rate (CAGR) 11.69% (2025-2034)
    Base Year 2024
    Market Forecast Period 2025-2034
    Historical Data 2020-2023
    Market Forecast Units USD billion
    Report Coverage Revenue Forecast, Competitive Landscape, Growth Factors, and Trends
    Key Companies Profiled Microsoft, HTC, Lenovo, Pimax, Snap, Oculus, Samsung, Magic Leap, Meta Platforms, Apple, Qualcomm, Vive, Nreal, Google, Sony
    Segments Covered Device Type, Application Area, Technology Adoption, User Demographics, Interaction Method, Regional
    Key Market Opportunities Enhanced gaming experiences Immersive training solutions Therapeutic applications in healthcare Remote collaboration tools Education and skill development platforms
    Key Market Dynamics Technological advancements Growing gaming industry Increased demand for training Rising adoption in healthcare Enhanced user experience
    Countries Covered North America, Europe, APAC, South America, MEA

    Market Highlights

    Author
    Shubham Munde
    Research Analyst Level II

    With a technical background in information technology & semiconductors, Shubham has 4.5+ years of experience in market research and analytics with the tasks of data mining, analysis, and project execution. He is the POC for our clients, for their consulting projects running under the ICT/Semiconductor domain. Shubham holds a Bachelor’s in Information and Technology and a Master of Business Administration (MBA). Shubham has executed over 150 research projects for our clients under the brand name Market Research Future in the last 2 years. His core skill is building the research respondent relation for gathering the primary information from industry and market estimation for niche markets. He is having expertise in conducting secondary & primary research, market estimations, market projections, competitive analysis, analysing current market trends and market dynamics, deep-dive analysis on market scenarios, consumer behaviour, technological impact analysis, consulting, analytics, etc. He has worked on fortune 500 companies' syndicate and consulting projects along with several government projects. He has worked on the projects of top tech brands such as IBM, Google, Microsoft, AWS, Meta, Oracle, Cisco Systems, Samsung, Accenture, VMware, Schneider Electric, Dell, HP, Ericsson, and so many others. He has worked on Metaverse, Web 3.0, Zero-Trust security, cyber-security, blockchain, quantum computing, robotics, 5G technology, High-Performance computing, data centers, AI, automation, IT equipment, sensors, semiconductors, consumer electronics and so many tech domain projects.

    Leave a Comment

    FAQs

    What is the expected market size of the Augmented Virtual Reality Handheld Device Market in 2034?

    The Augmented Virtual Reality Handheld Device Market is expected to be valued at 55.74 USD billion in 2034.

    What was the market value of Smart Glasses in 2023, and what is it projected to be in 2032?

    Smart Glasses were valued at 4.45 USD billion in 2023 and are projected to reach 12.25 USD billion by 2032.

    Which region accounted for the largest market size in 2023 in the Augmented Virtual Reality Handheld Device Market?

    North America accounted for the largest market size of 5.5 USD billion in 2023.

    What is the expected CAGR for the Augmented Virtual Reality Handheld Device Market from 2025 to 2034?

    The expected CAGR for the market from 2025 to 2034 is 11.69.

    How much is the Handheld Controllers segment expected to be valued at in 2032?

    The Handheld Controllers segment is expected to be valued at 10.25 USD billion in 2032.

    What is the projected market size of the Wearable Headsets segment by 2032?

    The Wearable Headsets segment is projected to reach 13.5 USD billion by 2032.

    What market value is expected for the Haptic Devices segment in 2032?

    The Haptic Devices segment is expected to be valued at 4.0 USD billion in 2032.

    Which company is considered a key player in the Augmented Virtual Reality Handheld Device Market?

    Companies such as Microsoft, HTC, and Oculus are considered key players in this market.

    What was the market size of the Europe region in 2023 for the Augmented Virtual Reality Handheld Device Market?

    The market size of the Europe region was 3.8 USD billion in 2023.

    What is the expected market size for the APAC region in 2032?

    The APAC region is expected to reach a market size of 12.0 USD billion by 2032.

    1. 'TABLE OF CONTENTS
    2. EXECUTIVE SUMMARY
      1. Market Overview
      2. Key Findings
      3. Market Segmentation
      4. Competitive Landscape
      5. Challenges and Opportunities
      6. Future Outlook
    3. MARKET INTRODUCTION
      1. Definition
      2. Scope of the study
        1. Research Objective
        2. Assumption
        3. Limitations
    4. RESEARCH METHODOLOGY
    5. Overview
      1. Data Mining
      2. Secondary Research
      3. Primary Research
        1. Primary Interviews and Information Gathering Process
        2. Breakdown
    6. of Primary Respondents
      1. Forecasting Model
      2. Market Size Estimation
        1. Bottom-Up Approach
        2. Top-Down Approach
      3. Data Triangulation
      4. Validation
    7. MARKET DYNAMICS
      1. Overview
      2. Drivers
      3. Restraints
      4. Opportunities
    8. MARKET FACTOR ANALYSIS
    9. Value chain Analysis
      1. Porter''s Five Forces Analysis
        1. Bargaining
    10. Power of Suppliers
      1. Bargaining Power of Buyers
        1. Threat of
    11. New Entrants
      1. Threat of Substitutes
        1. Intensity of Rivalry
      2. COVID-19 Impact Analysis
        1. Market Impact Analysis
        2. Regional
    12. Impact
      1. Opportunity and Threat Analysis
    13. AUGMENTED VIRTUAL REALITY
    14. HANDHELD DEVICE MARKET, BY DEVICE TYPE (USD BILLION)
      1. Smart Glasses
      2. Handheld Controllers
      3. Wearable Headsets
      4. Haptic Devices
    15. AUGMENTED VIRTUAL REALITY HANDHELD DEVICE MARKET, BY APPLICATION AREA (USD
    16. BILLION)
      1. Gaming
      2. Education and Training
      3. Healthcare
      4. Real Estate
      5. Retail
    17. AUGMENTED VIRTUAL REALITY HANDHELD DEVICE
    18. MARKET, BY TECHNOLOGY ADOPTION (USD BILLION)
      1. Consumer Adoption
    19. Enterprise Adoption
      1. Research and Development
    20. AUGMENTED VIRTUAL
    21. REALITY HANDHELD DEVICE MARKET, BY USER DEMOGRAPHICS (USD BILLION)
      1. Children
      2. Young Adults
      3. Adults
      4. Senior Citizens
    22. AUGMENTED
    23. VIRTUAL REALITY HANDHELD DEVICE MARKET, BY INTERACTION METHOD (USD BILLION)
    24. Touch Input
      1. Voice Control
      2. Gesture Recognition
      3. Motion
    25. Tracking
    26. AUGMENTED VIRTUAL REALITY HANDHELD DEVICE MARKET, BY REGIONAL
    27. (USD BILLION)
      1. North America
        1. US
        2. Canada
    28. Europe
      1. Germany
        1. UK
        2. France
        3. Russia
        4. Italy
        5. Spain
        6. Rest of Europe
      2. APAC
        1. China
        2. India
        3. Japan
        4. South Korea
        5. Malaysia
        6. Thailand
        7. Indonesia
        8. Rest
    29. of APAC
      1. South America
        1. Brazil
        2. Mexico
    30. Argentina
      1. Rest of South America
      2. MEA
        1. GCC Countries
        2. South Africa
        3. Rest of MEA
    31. COMPETITIVE LANDSCAPE
      1. Overview
      2. Competitive Analysis
      3. Market share Analysis
      4. Major Growth Strategy in the Augmented Virtual Reality Handheld Device Market
      5. Competitive Benchmarking
      6. Leading Players in Terms of Number of
    32. Developments in the Augmented Virtual Reality Handheld Device Market
    33. Key developments and growth strategies
      1. New Product Launch/Service Deployment
        1. Merger & Acquisitions
        2. Joint Ventures
      2. Major
    34. Players Financial Matrix
      1. Sales and Operating Income
        1. Major
    35. Players R&D Expenditure. 2023
    36. COMPANY PROFILES
      1. Microsoft
        1. Financial Overview
        2. Products Offered
        3. Key Developments
        4. SWOT Analysis
        5. Key Strategies
      2. HTC
    37. Financial Overview
      1. Products Offered
        1. Key Developments
        2. SWOT Analysis
        3. Key Strategies
      2. Lenovo
    38. Financial Overview
      1. Products Offered
        1. Key Developments
        2. SWOT Analysis
        3. Key Strategies
      2. Pimax
    39. Financial Overview
      1. Products Offered
        1. Key Developments
        2. SWOT Analysis
        3. Key Strategies
      2. Snap
    40. Financial Overview
      1. Products Offered
        1. Key Developments
        2. SWOT Analysis
        3. Key Strategies
      2. Oculus
    41. Financial Overview
      1. Products Offered
        1. Key Developments
        2. SWOT Analysis
        3. Key Strategies
      2. Samsung
    42. Financial Overview
      1. Products Offered
        1. Key Developments
        2. SWOT Analysis
        3. Key Strategies
      2. Magic Leap
    43. Financial Overview
      1. Products Offered
        1. Key Developments
        2. SWOT Analysis
        3. Key Strategies
      2. Meta Platforms
        1. Financial Overview
        2. Products Offered
        3. Key Developments
        4. SWOT Analysis
        5. Key Strategies
      3. Apple
    44. Financial Overview
      1. Products Offered
        1. Key Developments
        2. SWOT Analysis
        3. Key Strategies
      2. Qualcomm
    45. Financial Overview
      1. Products Offered
        1. Key Developments
        2. SWOT Analysis
        3. Key Strategies
      2. Vive
    46. Financial Overview
      1. Products Offered
        1. Key Developments
        2. SWOT Analysis
        3. Key Strategies
      2. Nreal
    47. Financial Overview
      1. Products Offered
        1. Key Developments
        2. SWOT Analysis
        3. Key Strategies
      2. Google
    48. Financial Overview
      1. Products Offered
        1. Key Developments
        2. SWOT Analysis
        3. Key Strategies
      2. Sony
    49. Financial Overview
      1. Products Offered
        1. Key Developments
        2. SWOT Analysis
        3. Key Strategies
    50. APPENDIX
    51. References
      1. Related Reports
    52. LIST OF ASSUMPTIONS
    53. DEVICE MARKET SIZE ESTIMATES & FORECAST, BY DEVICE TYPE, 2020-2034 (USD BILLIONS)
    54. & FORECAST, BY APPLICATION AREA, 2020-2034 (USD BILLIONS)
    55. AMERICA AUGMENTED VIRTUAL REALITY HANDHELD DEVICE MARKET SIZE ESTIMATES & FORECAST,
    56. BY TECHNOLOGY ADOPTION, 2020-2034 (USD BILLIONS)
    57. VIRTUAL REALITY HANDHELD DEVICE MARKET SIZE ESTIMATES & FORECAST, BY USER DEMOGRAPHICS,
    58. 2034 (USD BILLIONS)
    59. DEVICE MARKET SIZE ESTIMATES & FORECAST, BY INTERACTION METHOD, 2020-2034 (USD
    60. BILLIONS)
    61. MARKET SIZE ESTIMATES & FORECAST, BY REGIONAL, 2020-2034 (USD BILLIONS)
    62. US AUGMENTED VIRTUAL REALITY HANDHELD DEVICE MARKET SIZE ESTIMATES & FORECAST,
    63. BY DEVICE TYPE, 2020-2034 (USD BILLIONS)
    64. HANDHELD DEVICE MARKET SIZE ESTIMATES & FORECAST, BY APPLICATION AREA, 2020-2034
    65. (USD BILLIONS)
    66. SIZE ESTIMATES & FORECAST, BY TECHNOLOGY ADOPTION, 2020-2034 (USD BILLIONS)
    67. FORECAST, BY USER DEMOGRAPHICS, 2020-2034 (USD BILLIONS)
    68. VIRTUAL REALITY HANDHELD DEVICE MARKET SIZE ESTIMATES & FORECAST, BY INTERACTION
    69. METHOD, 2020-2034 (USD BILLIONS)
    70. DEVICE MARKET SIZE ESTIMATES & FORECAST, BY REGIONAL, 2020-2034 (USD BILLIONS)
    71. & FORECAST, BY DEVICE TYPE, 2020-2034 (USD BILLIONS)
    72. VIRTUAL REALITY HANDHELD DEVICE MARKET SIZE ESTIMATES & FORECAST, BY APPLICATION
    73. AREA, 2020-2034 (USD BILLIONS)
    74. DEVICE MARKET SIZE ESTIMATES & FORECAST, BY TECHNOLOGY ADOPTION, 2020-2034 (USD
    75. BILLIONS)
    76. SIZE ESTIMATES & FORECAST, BY USER DEMOGRAPHICS, 2020-2034 (USD BILLIONS)
    77. & FORECAST, BY INTERACTION METHOD, 2020-2034 (USD BILLIONS)
    78. AUGMENTED VIRTUAL REALITY HANDHELD DEVICE MARKET SIZE ESTIMATES & FORECAST,
    79. BY REGIONAL, 2020-2034 (USD BILLIONS)
    80. HANDHELD DEVICE MARKET SIZE ESTIMATES & FORECAST, BY DEVICE TYPE, 2020-2034
    81. (USD BILLIONS)
    82. SIZE ESTIMATES & FORECAST, BY APPLICATION AREA, 2020-2034 (USD BILLIONS)
    83. & FORECAST, BY TECHNOLOGY ADOPTION, 2020-2034 (USD BILLIONS)
    84. EUROPE AUGMENTED VIRTUAL REALITY HANDHELD DEVICE MARKET SIZE ESTIMATES & FORECAST,
    85. BY USER DEMOGRAPHICS, 2020-2034 (USD BILLIONS)
    86. REALITY HANDHELD DEVICE MARKET SIZE ESTIMATES & FORECAST, BY INTERACTION METHOD,
    87. 2034 (USD BILLIONS)
    88. DEVICE MARKET SIZE ESTIMATES & FORECAST, BY REGIONAL, 2020-2034 (USD BILLIONS)
    89. & FORECAST, BY DEVICE TYPE, 2020-2034 (USD BILLIONS)
    90. AUGMENTED VIRTUAL REALITY HANDHELD DEVICE MARKET SIZE ESTIMATES & FORECAST,
    91. BY APPLICATION AREA, 2020-2034 (USD BILLIONS)
    92. REALITY HANDHELD DEVICE MARKET SIZE ESTIMATES & FORECAST, BY TECHNOLOGY ADOPTION,
    93. 2034 (USD BILLIONS)
    94. DEVICE MARKET SIZE ESTIMATES & FORECAST, BY USER DEMOGRAPHICS, 2020-2034 (USD
    95. BILLIONS)
    96. SIZE ESTIMATES & FORECAST, BY INTERACTION METHOD, 2020-2034 (USD BILLIONS)
    97. & FORECAST, BY REGIONAL, 2020-2034 (USD BILLIONS)
    98. VIRTUAL REALITY HANDHELD DEVICE MARKET SIZE ESTIMATES & FORECAST, BY DEVICE
    99. TYPE, 2020-2034 (USD BILLIONS)
    100. DEVICE MARKET SIZE ESTIMATES & FORECAST, BY APPLICATION AREA, 2020-2034 (USD
    101. BILLIONS)
    102. ESTIMATES & FORECAST, BY TECHNOLOGY ADOPTION, 2020-2034 (USD BILLIONS)
    103. UK AUGMENTED VIRTUAL REALITY HANDHELD DEVICE MARKET SIZE ESTIMATES & FORECAST,
    104. BY USER DEMOGRAPHICS, 2020-2034 (USD BILLIONS)
    105. REALITY HANDHELD DEVICE MARKET SIZE ESTIMATES & FORECAST, BY INTERACTION METHOD,
    106. 2034 (USD BILLIONS)
    107. MARKET SIZE ESTIMATES & FORECAST, BY REGIONAL, 2020-2034 (USD BILLIONS)
    108. FRANCE AUGMENTED VIRTUAL REALITY HANDHELD DEVICE MARKET SIZE ESTIMATES &
    109. FORECAST, BY DEVICE TYPE, 2020-2034 (USD BILLIONS)
    110. VIRTUAL REALITY HANDHELD DEVICE MARKET SIZE ESTIMATES & FORECAST, BY APPLICATION
    111. AREA, 2020-2034 (USD BILLIONS)
    112. DEVICE MARKET SIZE ESTIMATES & FORECAST, BY TECHNOLOGY ADOPTION, 2020-2034 (USD
    113. BILLIONS)
    114. SIZE ESTIMATES & FORECAST, BY USER DEMOGRAPHICS, 2020-2034 (USD BILLIONS)
    115. & FORECAST, BY INTERACTION METHOD, 2020-2034 (USD BILLIONS)
    116. AUGMENTED VIRTUAL REALITY HANDHELD DEVICE MARKET SIZE ESTIMATES & FORECAST,
    117. BY REGIONAL, 2020-2034 (USD BILLIONS)
    118. HANDHELD DEVICE MARKET SIZE ESTIMATES & FORECAST, BY DEVICE TYPE, 2020-2034
    119. (USD BILLIONS)
    120. SIZE ESTIMATES & FORECAST, BY APPLICATION AREA, 2020-2034 (USD BILLIONS)
    121. & FORECAST, BY TECHNOLOGY ADOPTION, 2020-2034 (USD BILLIONS)
    122. RUSSIA AUGMENTED VIRTUAL REALITY HANDHELD DEVICE MARKET SIZE ESTIMATES & FORECAST,
    123. BY USER DEMOGRAPHICS, 2020-2034 (USD BILLIONS)
    124. REALITY HANDHELD DEVICE MARKET SIZE ESTIMATES & FORECAST, BY INTERACTION METHOD,
    125. 2034 (USD BILLIONS)
    126. DEVICE MARKET SIZE ESTIMATES & FORECAST, BY REGIONAL, 2020-2034 (USD BILLIONS)
    127. & FORECAST, BY DEVICE TYPE, 2020-2034 (USD BILLIONS)
    128. VIRTUAL REALITY HANDHELD DEVICE MARKET SIZE ESTIMATES & FORECAST, BY APPLICATION
    129. AREA, 2020-2034 (USD BILLIONS)
    130. DEVICE MARKET SIZE ESTIMATES & FORECAST, BY TECHNOLOGY ADOPTION, 2020-2034 (USD
    131. BILLIONS)
    132. SIZE ESTIMATES & FORECAST, BY USER DEMOGRAPHICS, 2020-2034 (USD BILLIONS)
    133. & FORECAST, BY INTERACTION METHOD, 2020-2034 (USD BILLIONS)
    134. AUGMENTED VIRTUAL REALITY HANDHELD DEVICE MARKET SIZE ESTIMATES & FORECAST,
    135. BY REGIONAL, 2020-2034 (USD BILLIONS)
    136. HANDHELD DEVICE MARKET SIZE ESTIMATES & FORECAST, BY DEVICE TYPE, 2020-2034
    137. (USD BILLIONS)
    138. SIZE ESTIMATES & FORECAST, BY APPLICATION AREA, 2020-2034 (USD BILLIONS)
    139. & FORECAST, BY TECHNOLOGY ADOPTION, 2020-2034 (USD BILLIONS)
    140. SPAIN AUGMENTED VIRTUAL REALITY HANDHELD DEVICE MARKET SIZE ESTIMATES & FORECAST,
    141. BY USER DEMOGRAPHICS, 2020-2034 (USD BILLIONS)
    142. REALITY HANDHELD DEVICE MARKET SIZE ESTIMATES & FORECAST, BY INTERACTION METHOD,
    143. 2034 (USD BILLIONS)
    144. DEVICE MARKET SIZE ESTIMATES & FORECAST, BY REGIONAL, 2020-2034 (USD BILLIONS)
    145. ESTIMATES & FORECAST, BY DEVICE TYPE, 2020-2034 (USD BILLIONS)
    146. REST OF EUROPE AUGMENTED VIRTUAL REALITY HANDHELD DEVICE MARKET SIZE ESTIMATES &
    147. FORECAST, BY APPLICATION AREA, 2020-2034 (USD BILLIONS)
    148. AUGMENTED VIRTUAL REALITY HANDHELD DEVICE MARKET SIZE ESTIMATES & FORECAST,
    149. BY TECHNOLOGY ADOPTION, 2020-2034 (USD BILLIONS)
    150. VIRTUAL REALITY HANDHELD DEVICE MARKET SIZE ESTIMATES & FORECAST, BY USER DEMOGRAPHICS,
    151. 2034 (USD BILLIONS)
    152. HANDHELD DEVICE MARKET SIZE ESTIMATES & FORECAST, BY INTERACTION METHOD, 2020-2034
    153. (USD BILLIONS)
    154. DEVICE MARKET SIZE ESTIMATES & FORECAST, BY REGIONAL, 2020-2034 (USD BILLIONS)
    155. & FORECAST, BY DEVICE TYPE, 2020-2034 (USD BILLIONS)
    156. VIRTUAL REALITY HANDHELD DEVICE MARKET SIZE ESTIMATES & FORECAST, BY APPLICATION
    157. AREA, 2020-2034 (USD BILLIONS)
    158. DEVICE MARKET SIZE ESTIMATES & FORECAST, BY TECHNOLOGY ADOPTION, 2020-2034 (USD
    159. BILLIONS)
    160. ESTIMATES & FORECAST, BY USER DEMOGRAPHICS, 2020-2034 (USD BILLIONS)
    161. APAC AUGMENTED VIRTUAL REALITY HANDHELD DEVICE MARKET SIZE ESTIMATES & FORECAST,
    162. BY INTERACTION METHOD, 2020-2034 (USD BILLIONS)
    163. REALITY HANDHELD DEVICE MARKET SIZE ESTIMATES & FORECAST, BY REGIONAL, 2020-2034
    164. (USD BILLIONS)
    165. SIZE ESTIMATES & FORECAST, BY DEVICE TYPE, 2020-2034 (USD BILLIONS)
    166. CHINA AUGMENTED VIRTUAL REALITY HANDHELD DEVICE MARKET SIZE ESTIMATES &
    167. FORECAST, BY APPLICATION AREA, 2020-2034 (USD BILLIONS)
    168. VIRTUAL REALITY HANDHELD DEVICE MARKET SIZE ESTIMATES & FORECAST, BY TECHNOLOGY
    169. ADOPTION, 2020-2034 (USD BILLIONS)
    170. HANDHELD DEVICE MARKET SIZE ESTIMATES & FORECAST, BY USER DEMOGRAPHICS, 2020-2034
    171. (USD BILLIONS)
    172. SIZE ESTIMATES & FORECAST, BY INTERACTION METHOD, 2020-2034 (USD BILLIONS)
    173. & FORECAST, BY REGIONAL, 2020-2034 (USD BILLIONS)
    174. VIRTUAL REALITY HANDHELD DEVICE MARKET SIZE ESTIMATES & FORECAST, BY DEVICE
    175. TYPE, 2020-2034 (USD BILLIONS)
    176. DEVICE MARKET SIZE ESTIMATES & FORECAST, BY APPLICATION AREA, 2020-2034 (USD
    177. BILLIONS)
    178. SIZE ESTIMATES & FORECAST, BY TECHNOLOGY ADOPTION, 2020-2034 (USD BILLIONS)
    179. & FORECAST, BY USER DEMOGRAPHICS, 2020-2034 (USD BILLIONS)
    180. AUGMENTED VIRTUAL REALITY HANDHELD DEVICE MARKET SIZE ESTIMATES & FORECAST,
    181. BY INTERACTION METHOD, 2020-2034 (USD BILLIONS)
    182. REALITY HANDHELD DEVICE MARKET SIZE ESTIMATES & FORECAST, BY REGIONAL, 2020-2034
    183. (USD BILLIONS)
    184. SIZE ESTIMATES & FORECAST, BY DEVICE TYPE, 2020-2034 (USD BILLIONS)
    185. JAPAN AUGMENTED VIRTUAL REALITY HANDHELD DEVICE MARKET SIZE ESTIMATES &
    186. FORECAST, BY APPLICATION AREA, 2020-2034 (USD BILLIONS)
    187. VIRTUAL REALITY HANDHELD DEVICE MARKET SIZE ESTIMATES & FORECAST, BY TECHNOLOGY
    188. ADOPTION, 2020-2034 (USD BILLIONS)
    189. HANDHELD DEVICE MARKET SIZE ESTIMATES & FORECAST, BY USER DEMOGRAPHICS, 2020-2034
    190. (USD BILLIONS)
    191. SIZE ESTIMATES & FORECAST, BY INTERACTION METHOD, 2020-2034 (USD BILLIONS)
    192. & FORECAST, BY REGIONAL, 2020-2034 (USD BILLIONS)
    193. AUGMENTED VIRTUAL REALITY HANDHELD DEVICE MARKET SIZE ESTIMATES & FORECAST,
    194. BY DEVICE TYPE, 2020-2034 (USD BILLIONS)
    195. REALITY HANDHELD DEVICE MARKET SIZE ESTIMATES & FORECAST, BY APPLICATION AREA,
    196. 2034 (USD BILLIONS)
    197. DEVICE MARKET SIZE ESTIMATES & FORECAST, BY TECHNOLOGY ADOPTION, 2020-2034 (USD
    198. BILLIONS)
    199. SIZE ESTIMATES & FORECAST, BY USER DEMOGRAPHICS, 2020-2034 (USD BILLIONS)
    200. & FORECAST, BY INTERACTION METHOD, 2020-2034 (USD BILLIONS)
    201. KOREA AUGMENTED VIRTUAL REALITY HANDHELD DEVICE MARKET SIZE ESTIMATES & FORECAST,
    202. BY REGIONAL, 2020-2034 (USD BILLIONS)
    203. REALITY HANDHELD DEVICE MARKET SIZE ESTIMATES & FORECAST, BY DEVICE TYPE, 2020-2034
    204. (USD BILLIONS)
    205. MARKET SIZE ESTIMATES & FORECAST, BY APPLICATION AREA, 2020-2034 (USD BILLIONS)
    206. & FORECAST, BY TECHNOLOGY ADOPTION, 2020-2034 (USD BILLIONS)
    207. MALAYSIA AUGMENTED VIRTUAL REALITY HANDHELD DEVICE MARKET SIZE ESTIMATES & FORECAST,
    208. BY USER DEMOGRAPHICS, 2020-2034 (USD BILLIONS)
    209. VIRTUAL REALITY HANDHELD DEVICE MARKET SIZE ESTIMATES & FORECAST, BY INTERACTION
    210. METHOD, 2020-2034 (USD BILLIONS)
    211. HANDHELD DEVICE MARKET SIZE ESTIMATES & FORECAST, BY REGIONAL, 2020-2034 (USD
    212. BILLIONS)
    213. SIZE ESTIMATES & FORECAST, BY DEVICE TYPE, 2020-2034 (USD BILLIONS)
    214. THAILAND AUGMENTED VIRTUAL REALITY HANDHELD DEVICE MARKET SIZE ESTIMATES &
    215. FORECAST, BY APPLICATION AREA, 2020-2034 (USD BILLIONS)
    216. AUGMENTED VIRTUAL REALITY HANDHELD DEVICE MARKET SIZE ESTIMATES & FORECAST,
    217. BY TECHNOLOGY ADOPTION, 2020-2034 (USD BILLIONS)
    218. VIRTUAL REALITY HANDHELD DEVICE MARKET SIZE ESTIMATES & FORECAST, BY USER DEMOGRAPHICS,
    219. 2034 (USD BILLIONS)
    220. DEVICE MARKET SIZE ESTIMATES & FORECAST, BY INTERACTION METHOD, 2020-2034 (USD
    221. BILLIONS)
    222. SIZE ESTIMATES & FORECAST, BY REGIONAL, 2020-2034 (USD BILLIONS)
    223. INDONESIA AUGMENTED VIRTUAL REALITY HANDHELD DEVICE MARKET SIZE ESTIMATES &
    224. FORECAST, BY DEVICE TYPE, 2020-2034 (USD BILLIONS)
    225. VIRTUAL REALITY HANDHELD DEVICE MARKET SIZE ESTIMATES & FORECAST, BY APPLICATION
    226. AREA, 2020-2034 (USD BILLIONS)
    227. HANDHELD DEVICE MARKET SIZE ESTIMATES & FORECAST, BY TECHNOLOGY ADOPTION, 2020-2034
    228. (USD BILLIONS)
    229. MARKET SIZE ESTIMATES & FORECAST, BY USER DEMOGRAPHICS, 2020-2034 (USD BILLIONS)
    230. & FORECAST, BY INTERACTION METHOD, 2020-2034 (USD BILLIONS)
    231. INDONESIA AUGMENTED VIRTUAL REALITY HANDHELD DEVICE MARKET SIZE ESTIMATES &
    232. FORECAST, BY REGIONAL, 2020-2034 (USD BILLIONS)
    233. VIRTUAL REALITY HANDHELD DEVICE MARKET SIZE ESTIMATES & FORECAST, BY DEVICE
    234. TYPE, 2020-2034 (USD BILLIONS)
    235. HANDHELD DEVICE MARKET SIZE ESTIMATES & FORECAST, BY APPLICATION AREA, 2020-2034
    236. (USD BILLIONS)
    237. MARKET SIZE ESTIMATES & FORECAST, BY TECHNOLOGY ADOPTION, 2020-2034 (USD BILLIONS)
    238. ESTIMATES & FORECAST, BY USER DEMOGRAPHICS, 2020-2034 (USD BILLIONS)
    239. REST OF APAC AUGMENTED VIRTUAL REALITY HANDHELD DEVICE MARKET SIZE ESTIMATES
    240. & FORECAST, BY INTERACTION METHOD, 2020-2034 (USD BILLIONS)
    241. REST OF APAC AUGMENTED VIRTUAL REALITY HANDHELD DEVICE MARKET SIZE ESTIMATES &
    242. FORECAST, BY REGIONAL, 2020-2034 (USD BILLIONS)
    243. VIRTUAL REALITY HANDHELD DEVICE MARKET SIZE ESTIMATES & FORECAST, BY DEVICE
    244. TYPE, 2020-2034 (USD BILLIONS)
    245. HANDHELD DEVICE MARKET SIZE ESTIMATES & FORECAST, BY APPLICATION AREA, 2020-2034
    246. (USD BILLIONS)
    247. DEVICE MARKET SIZE ESTIMATES & FORECAST, BY TECHNOLOGY ADOPTION, 2020-2034 (USD
    248. BILLIONS)
    249. MARKET SIZE ESTIMATES & FORECAST, BY USER DEMOGRAPHICS, 2020-2034 (USD BILLIONS)
    250. ESTIMATES & FORECAST, BY INTERACTION METHOD, 2020-2034 (USD BILLIONS)
    251. SOUTH AMERICA AUGMENTED VIRTUAL REALITY HANDHELD DEVICE MARKET SIZE ESTIMATES
    252. & FORECAST, BY REGIONAL, 2020-2034 (USD BILLIONS)
    253. VIRTUAL REALITY HANDHELD DEVICE MARKET SIZE ESTIMATES & FORECAST, BY DEVICE
    254. TYPE, 2020-2034 (USD BILLIONS)
    255. HANDHELD DEVICE MARKET SIZE ESTIMATES & FORECAST, BY APPLICATION AREA, 2020-2034
    256. (USD BILLIONS)
    257. MARKET SIZE ESTIMATES & FORECAST, BY TECHNOLOGY ADOPTION, 2020-2034 (USD BILLIONS)
    258. & FORECAST, BY USER DEMOGRAPHICS, 2020-2034 (USD BILLIONS)
    259. AUGMENTED VIRTUAL REALITY HANDHELD DEVICE MARKET SIZE ESTIMATES & FORECAST,
    260. BY INTERACTION METHOD, 2020-2034 (USD BILLIONS)
    261. VIRTUAL REALITY HANDHELD DEVICE MARKET SIZE ESTIMATES & FORECAST, BY REGIONAL,
    262. 2034 (USD BILLIONS)
    263. DEVICE MARKET SIZE ESTIMATES & FORECAST, BY DEVICE TYPE, 2020-2034 (USD BILLIONS)
    264. & FORECAST, BY APPLICATION AREA, 2020-2034 (USD BILLIONS)
    265. AUGMENTED VIRTUAL REALITY HANDHELD DEVICE MARKET SIZE ESTIMATES & FORECAST,
    266. BY TECHNOLOGY ADOPTION, 2020-2034 (USD BILLIONS)
    267. VIRTUAL REALITY HANDHELD DEVICE MARKET SIZE ESTIMATES & FORECAST, BY USER DEMOGRAPHICS,
    268. 2034 (USD BILLIONS)
    269. DEVICE MARKET SIZE ESTIMATES & FORECAST, BY INTERACTION METHOD, 2020-2034 (USD
    270. BILLIONS)
    271. SIZE ESTIMATES & FORECAST, BY REGIONAL, 2020-2034 (USD BILLIONS)
    272. ARGENTINA AUGMENTED VIRTUAL REALITY HANDHELD DEVICE MARKET SIZE ESTIMATES &
    273. FORECAST, BY DEVICE TYPE, 2020-2034 (USD BILLIONS)
    274. VIRTUAL REALITY HANDHELD DEVICE MARKET SIZE ESTIMATES & FORECAST, BY APPLICATION
    275. AREA, 2020-2034 (USD BILLIONS)
    276. HANDHELD DEVICE MARKET SIZE ESTIMATES & FORECAST, BY TECHNOLOGY ADOPTION, 2020-2034
    277. (USD BILLIONS)
    278. MARKET SIZE ESTIMATES & FORECAST, BY USER DEMOGRAPHICS, 2020-2034 (USD BILLIONS)
    279. & FORECAST, BY INTERACTION METHOD, 2020-2034 (USD BILLIONS)
    280. ARGENTINA AUGMENTED VIRTUAL REALITY HANDHELD DEVICE MARKET SIZE ESTIMATES &
    281. FORECAST, BY REGIONAL, 2020-2034 (USD BILLIONS)
    282. AUGMENTED VIRTUAL REALITY HANDHELD DEVICE MARKET SIZE ESTIMATES & FORECAST,
    283. BY DEVICE TYPE, 2020-2034 (USD BILLIONS)
    284. VIRTUAL REALITY HANDHELD DEVICE MARKET SIZE ESTIMATES & FORECAST, BY APPLICATION
    285. AREA, 2020-2034 (USD BILLIONS)
    286. REALITY HANDHELD DEVICE MARKET SIZE ESTIMATES & FORECAST, BY TECHNOLOGY ADOPTION,
    287. 2034 (USD BILLIONS)
    288. REALITY HANDHELD DEVICE MARKET SIZE ESTIMATES & FORECAST, BY USER DEMOGRAPHICS,
    289. 2034 (USD BILLIONS)
    290. REALITY HANDHELD DEVICE MARKET SIZE ESTIMATES & FORECAST, BY INTERACTION METHOD,
    291. 2034 (USD BILLIONS)
    292. REALITY HANDHELD DEVICE MARKET SIZE ESTIMATES & FORECAST, BY REGIONAL, 2020-2034
    293. (USD BILLIONS)
    294. SIZE ESTIMATES & FORECAST, BY DEVICE TYPE, 2020-2034 (USD BILLIONS)
    295. MEA AUGMENTED VIRTUAL REALITY HANDHELD DEVICE MARKET SIZE ESTIMATES & FORECAST,
    296. BY APPLICATION AREA, 2020-2034 (USD BILLIONS)
    297. REALITY HANDHELD DEVICE MARKET SIZE ESTIMATES & FORECAST, BY TECHNOLOGY ADOPTION,
    298. 2034 (USD BILLIONS)
    299. DEVICE MARKET SIZE ESTIMATES & FORECAST, BY USER DEMOGRAPHICS, 2020-2034 (USD
    300. BILLIONS)
    301. ESTIMATES & FORECAST, BY INTERACTION METHOD, 2020-2034 (USD BILLIONS)
    302. MEA AUGMENTED VIRTUAL REALITY HANDHELD DEVICE MARKET SIZE ESTIMATES & FORECAST,
    303. BY REGIONAL, 2020-2034 (USD BILLIONS)
    304. REALITY HANDHELD DEVICE MARKET SIZE ESTIMATES & FORECAST, BY DEVICE TYPE, 2020-2034
    305. (USD BILLIONS)
    306. DEVICE MARKET SIZE ESTIMATES & FORECAST, BY APPLICATION AREA, 2020-2034 (USD
    307. BILLIONS)
    308. MARKET SIZE ESTIMATES & FORECAST, BY TECHNOLOGY ADOPTION, 2020-2034 (USD BILLIONS)
    309. ESTIMATES & FORECAST, BY USER DEMOGRAPHICS, 2020-2034 (USD BILLIONS)
    310. GCC COUNTRIES AUGMENTED VIRTUAL REALITY HANDHELD DEVICE MARKET SIZE ESTIMATES
    311. & FORECAST, BY INTERACTION METHOD, 2020-2034 (USD BILLIONS)
    312. GCC COUNTRIES AUGMENTED VIRTUAL REALITY HANDHELD DEVICE MARKET SIZE ESTIMATES &
    313. FORECAST, BY REGIONAL, 2020-2034 (USD BILLIONS)
    314. VIRTUAL REALITY HANDHELD DEVICE MARKET SIZE ESTIMATES & FORECAST, BY DEVICE
    315. TYPE, 2020-2034 (USD BILLIONS)
    316. HANDHELD DEVICE MARKET SIZE ESTIMATES & FORECAST, BY APPLICATION AREA, 2020-2034
    317. (USD BILLIONS)
    318. MARKET SIZE ESTIMATES & FORECAST, BY TECHNOLOGY ADOPTION, 2020-2034 (USD BILLIONS)
    319. ESTIMATES & FORECAST, BY USER DEMOGRAPHICS, 2020-2034 (USD BILLIONS)
    320. SOUTH AFRICA AUGMENTED VIRTUAL REALITY HANDHELD DEVICE MARKET SIZE ESTIMATES
    321. & FORECAST, BY INTERACTION METHOD, 2020-2034 (USD BILLIONS)
    322. SOUTH AFRICA AUGMENTED VIRTUAL REALITY HANDHELD DEVICE MARKET SIZE ESTIMATES &
    323. FORECAST, BY REGIONAL, 2020-2034 (USD BILLIONS)
    324. VIRTUAL REALITY HANDHELD DEVICE MARKET SIZE ESTIMATES & FORECAST, BY DEVICE
    325. TYPE, 2020-2034 (USD BILLIONS)
    326. HANDHELD DEVICE MARKET SIZE ESTIMATES & FORECAST, BY APPLICATION AREA, 2020-2034
    327. (USD BILLIONS)
    328. MARKET SIZE ESTIMATES & FORECAST, BY TECHNOLOGY ADOPTION, 2020-2034 (USD BILLIONS)
    329. & FORECAST, BY USER DEMOGRAPHICS, 2020-2034 (USD BILLIONS)
    330. OF MEA AUGMENTED VIRTUAL REALITY HANDHELD DEVICE MARKET SIZE ESTIMATES & FORECAST,
    331. BY INTERACTION METHOD, 2020-2034 (USD BILLIONS)
    332. VIRTUAL REALITY HANDHELD DEVICE MARKET SIZE ESTIMATES & FORECAST, BY REGIONAL,
    333. 2034 (USD BILLIONS)
    334. MARKET SYNOPSIS
    335. DEVICE MARKET ANALYSIS
    336. MARKET ANALYSIS BY DEVICE TYPE
    337. DEVICE MARKET ANALYSIS BY APPLICATION AREA
    338. HANDHELD DEVICE MARKET ANALYSIS BY TECHNOLOGY ADOPTION
    339. VIRTUAL REALITY HANDHELD DEVICE MARKET ANALYSIS BY USER DEMOGRAPHICS
    340. US AUGMENTED VIRTUAL REALITY HANDHELD DEVICE MARKET ANALYSIS BY INTERACTION METHOD
    341. DEVICE TYPE
    342. ANALYSIS BY APPLICATION AREA
    343. DEVICE MARKET ANALYSIS BY TECHNOLOGY ADOPTION
    344. REALITY HANDHELD DEVICE MARKET ANALYSIS BY USER DEMOGRAPHICS
    345. AUGMENTED VIRTUAL REALITY HANDHELD DEVICE MARKET ANALYSIS BY INTERACTION METHOD
    346. REGIONAL
    347. ANALYSIS
    348. ANALYSIS BY DEVICE TYPE
    349. DEVICE MARKET ANALYSIS BY APPLICATION AREA
    350. REALITY HANDHELD DEVICE MARKET ANALYSIS BY TECHNOLOGY ADOPTION
    351. AUGMENTED VIRTUAL REALITY HANDHELD DEVICE MARKET ANALYSIS BY USER DEMOGRAPHICS
    352. INTERACTION METHOD
    353. MARKET ANALYSIS BY REGIONAL
    354. DEVICE MARKET ANALYSIS BY DEVICE TYPE
    355. HANDHELD DEVICE MARKET ANALYSIS BY APPLICATION AREA
    356. VIRTUAL REALITY HANDHELD DEVICE MARKET ANALYSIS BY TECHNOLOGY ADOPTION
    357. UK AUGMENTED VIRTUAL REALITY HANDHELD DEVICE MARKET ANALYSIS BY USER DEMOGRAPHICS
    358. METHOD
    359. BY REGIONAL
    360. ANALYSIS BY DEVICE TYPE
    361. DEVICE MARKET ANALYSIS BY APPLICATION AREA
    362. REALITY HANDHELD DEVICE MARKET ANALYSIS BY TECHNOLOGY ADOPTION
    363. AUGMENTED VIRTUAL REALITY HANDHELD DEVICE MARKET ANALYSIS BY USER DEMOGRAPHICS
    364. INTERACTION METHOD
    365. MARKET ANALYSIS BY REGIONAL
    366. DEVICE MARKET ANALYSIS BY DEVICE TYPE
    367. HANDHELD DEVICE MARKET ANALYSIS BY APPLICATION AREA
    368. VIRTUAL REALITY HANDHELD DEVICE MARKET ANALYSIS BY TECHNOLOGY ADOPTION
    369. RUSSIA AUGMENTED VIRTUAL REALITY HANDHELD DEVICE MARKET ANALYSIS BY USER DEMOGRAPHICS
    370. INTERACTION METHOD
    371. MARKET ANALYSIS BY REGIONAL
    372. DEVICE MARKET ANALYSIS BY DEVICE TYPE
    373. HANDHELD DEVICE MARKET ANALYSIS BY APPLICATION AREA
    374. VIRTUAL REALITY HANDHELD DEVICE MARKET ANALYSIS BY TECHNOLOGY ADOPTION
    375. ITALY AUGMENTED VIRTUAL REALITY HANDHELD DEVICE MARKET ANALYSIS BY USER DEMOGRAPHICS
    376. INTERACTION METHOD
    377. MARKET ANALYSIS BY REGIONAL
    378. DEVICE MARKET ANALYSIS BY DEVICE TYPE
    379. HANDHELD DEVICE MARKET ANALYSIS BY APPLICATION AREA
    380. VIRTUAL REALITY HANDHELD DEVICE MARKET ANALYSIS BY TECHNOLOGY ADOPTION
    381. SPAIN AUGMENTED VIRTUAL REALITY HANDHELD DEVICE MARKET ANALYSIS BY USER DEMOGRAPHICS
    382. INTERACTION METHOD
    383. MARKET ANALYSIS BY REGIONAL
    384. HANDHELD DEVICE MARKET ANALYSIS BY DEVICE TYPE
    385. VIRTUAL REALITY HANDHELD DEVICE MARKET ANALYSIS BY APPLICATION AREA
    386. REST OF EUROPE AUGMENTED VIRTUAL REALITY HANDHELD DEVICE MARKET ANALYSIS BY
    387. TECHNOLOGY ADOPTION
    388. DEVICE MARKET ANALYSIS BY USER DEMOGRAPHICS
    389. VIRTUAL REALITY HANDHELD DEVICE MARKET ANALYSIS BY INTERACTION METHOD
    390. REST OF EUROPE AUGMENTED VIRTUAL REALITY HANDHELD DEVICE MARKET ANALYSIS BY
    391. REGIONAL
    392. DEVICE TYPE
    393. ANALYSIS BY APPLICATION AREA
    394. DEVICE MARKET ANALYSIS BY TECHNOLOGY ADOPTION
    395. REALITY HANDHELD DEVICE MARKET ANALYSIS BY USER DEMOGRAPHICS
    396. AUGMENTED VIRTUAL REALITY HANDHELD DEVICE MARKET ANALYSIS BY INTERACTION METHOD
    397. REGIONAL
    398. ANALYSIS BY DEVICE TYPE
    399. DEVICE MARKET ANALYSIS BY APPLICATION AREA
    400. REALITY HANDHELD DEVICE MARKET ANALYSIS BY TECHNOLOGY ADOPTION
    401. AUGMENTED VIRTUAL REALITY HANDHELD DEVICE MARKET ANALYSIS BY USER DEMOGRAPHICS
    402. INTERACTION METHOD
    403. MARKET ANALYSIS BY REGIONAL
    404. DEVICE MARKET ANALYSIS BY DEVICE TYPE
    405. HANDHELD DEVICE MARKET ANALYSIS BY APPLICATION AREA
    406. VIRTUAL REALITY HANDHELD DEVICE MARKET ANALYSIS BY TECHNOLOGY ADOPTION
    407. JAPAN AUGMENTED VIRTUAL REALITY HANDHELD DEVICE MARKET ANALYSIS BY USER DEMOGRAPHICS
    408. INTERACTION METHOD
    409. MARKET ANALYSIS BY REGIONAL
    410. HANDHELD DEVICE MARKET ANALYSIS BY DEVICE TYPE
    411. VIRTUAL REALITY HANDHELD DEVICE MARKET ANALYSIS BY APPLICATION AREA
    412. SOUTH KOREA AUGMENTED VIRTUAL REALITY HANDHELD DEVICE MARKET ANALYSIS BY TECHNOLOGY
    413. ADOPTION
    414. ANALYSIS BY USER DEMOGRAPHICS
    415. HANDHELD DEVICE MARKET ANALYSIS BY INTERACTION METHOD
    416. AUGMENTED VIRTUAL REALITY HANDHELD DEVICE MARKET ANALYSIS BY REGIONAL
    417. MALAYSIA AUGMENTED VIRTUAL REALITY HANDHELD DEVICE MARKET ANALYSIS BY DEVICE
    418. TYPE
    419. BY APPLICATION AREA
    420. DEVICE MARKET ANALYSIS BY TECHNOLOGY ADOPTION
    421. VIRTUAL REALITY HANDHELD DEVICE MARKET ANALYSIS BY USER DEMOGRAPHICS
    422. MALAYSIA AUGMENTED VIRTUAL REALITY HANDHELD DEVICE MARKET ANALYSIS BY INTERACTION
    423. METHOD
    424. ANALYSIS BY REGIONAL
    425. DEVICE MARKET ANALYSIS BY DEVICE TYPE
    426. REALITY HANDHELD DEVICE MARKET ANALYSIS BY APPLICATION AREA
    427. AUGMENTED VIRTUAL REALITY HANDHELD DEVICE MARKET ANALYSIS BY TECHNOLOGY ADOPTION
    428. BY USER DEMOGRAPHICS
    429. DEVICE MARKET ANALYSIS BY INTERACTION METHOD
    430. VIRTUAL REALITY HANDHELD DEVICE MARKET ANALYSIS BY REGIONAL
    431. AUGMENTED VIRTUAL REALITY HANDHELD DEVICE MARKET ANALYSIS BY DEVICE TYPE
    432. INDONESIA AUGMENTED VIRTUAL REALITY HANDHELD DEVICE MARKET ANALYSIS BY APPLICATION
    433. AREA
    434. ANALYSIS BY TECHNOLOGY ADOPTION
    435. HANDHELD DEVICE MARKET ANALYSIS BY USER DEMOGRAPHICS
    436. VIRTUAL REALITY HANDHELD DEVICE MARKET ANALYSIS BY INTERACTION METHOD
    437. INDONESIA AUGMENTED VIRTUAL REALITY HANDHELD DEVICE MARKET ANALYSIS BY REGIONAL
    438. BY DEVICE TYPE
    439. DEVICE MARKET ANALYSIS BY APPLICATION AREA
    440. VIRTUAL REALITY HANDHELD DEVICE MARKET ANALYSIS BY TECHNOLOGY ADOPTION
    441. REST OF APAC AUGMENTED VIRTUAL REALITY HANDHELD DEVICE MARKET ANALYSIS BY USER
    442. DEMOGRAPHICS
    443. MARKET ANALYSIS BY INTERACTION METHOD
    444. REALITY HANDHELD DEVICE MARKET ANALYSIS BY REGIONAL
    445. AUGMENTED VIRTUAL REALITY HANDHELD DEVICE MARKET ANALYSIS
    446. AUGMENTED VIRTUAL REALITY HANDHELD DEVICE MARKET ANALYSIS BY DEVICE TYPE
    447. BRAZIL AUGMENTED VIRTUAL REALITY HANDHELD DEVICE MARKET ANALYSIS BY APPLICATION
    448. AREA
    449. BY TECHNOLOGY ADOPTION
    450. DEVICE MARKET ANALYSIS BY USER DEMOGRAPHICS
    451. REALITY HANDHELD DEVICE MARKET ANALYSIS BY INTERACTION METHOD
    452. AUGMENTED VIRTUAL REALITY HANDHELD DEVICE MARKET ANALYSIS BY REGIONAL
    453. MEXICO AUGMENTED VIRTUAL REALITY HANDHELD DEVICE MARKET ANALYSIS BY DEVICE
    454. TYPE
    455. BY APPLICATION AREA
    456. MARKET ANALYSIS BY TECHNOLOGY ADOPTION
    457. REALITY HANDHELD DEVICE MARKET ANALYSIS BY USER DEMOGRAPHICS
    458. AUGMENTED VIRTUAL REALITY HANDHELD DEVICE MARKET ANALYSIS BY INTERACTION METHOD
    459. REGIONAL
    460. ANALYSIS BY DEVICE TYPE
    461. DEVICE MARKET ANALYSIS BY APPLICATION AREA
    462. VIRTUAL REALITY HANDHELD DEVICE MARKET ANALYSIS BY TECHNOLOGY ADOPTION
    463. ARGENTINA AUGMENTED VIRTUAL REALITY HANDHELD DEVICE MARKET ANALYSIS BY USER
    464. DEMOGRAPHICS
    465. MARKET ANALYSIS BY INTERACTION METHOD
    466. REALITY HANDHELD DEVICE MARKET ANALYSIS BY REGIONAL
    467. AMERICA AUGMENTED VIRTUAL REALITY HANDHELD DEVICE MARKET ANALYSIS BY DEVICE TYPE
    468. ANALYSIS BY APPLICATION AREA
    469. REALITY HANDHELD DEVICE MARKET ANALYSIS BY TECHNOLOGY ADOPTION
    470. REST OF SOUTH AMERICA AUGMENTED VIRTUAL REALITY HANDHELD DEVICE MARKET ANALYSIS
    471. BY USER DEMOGRAPHICS
    472. HANDHELD DEVICE MARKET ANALYSIS BY INTERACTION METHOD
    473. AMERICA AUGMENTED VIRTUAL REALITY HANDHELD DEVICE MARKET ANALYSIS BY REGIONAL
    474. GCC COUNTRIES AUGMENTED VIRTUAL REALITY HANDHELD DEVICE MARKET ANALYSIS BY
    475. DEVICE TYPE
    476. MARKET ANALYSIS BY APPLICATION AREA
    477. REALITY HANDHELD DEVICE MARKET ANALYSIS BY TECHNOLOGY ADOPTION
    478. GCC COUNTRIES AUGMENTED VIRTUAL REALITY HANDHELD DEVICE MARKET ANALYSIS BY USER
    479. DEMOGRAPHICS
    480. MARKET ANALYSIS BY INTERACTION METHOD
    481. REALITY HANDHELD DEVICE MARKET ANALYSIS BY REGIONAL
    482. AUGMENTED VIRTUAL REALITY HANDHELD DEVICE MARKET ANALYSIS BY DEVICE TYPE
    483. SOUTH AFRICA AUGMENTED VIRTUAL REALITY HANDHELD DEVICE MARKET ANALYSIS BY APPLICATION
    484. AREA
    485. ANALYSIS BY TECHNOLOGY ADOPTION
    486. REALITY HANDHELD DEVICE MARKET ANALYSIS BY USER DEMOGRAPHICS
    487. AFRICA AUGMENTED VIRTUAL REALITY HANDHELD DEVICE MARKET ANALYSIS BY INTERACTION
    488. METHOD
    489. ANALYSIS BY REGIONAL
    490. DEVICE MARKET ANALYSIS BY DEVICE TYPE
    491. REALITY HANDHELD DEVICE MARKET ANALYSIS BY APPLICATION AREA
    492. OF MEA AUGMENTED VIRTUAL REALITY HANDHELD DEVICE MARKET ANALYSIS BY TECHNOLOGY ADOPTION
    493. BY USER DEMOGRAPHICS
    494. DEVICE MARKET ANALYSIS BY INTERACTION METHOD
    495. VIRTUAL REALITY HANDHELD DEVICE MARKET ANALYSIS BY REGIONAL
    496. BUYING CRITERIA OF AUGMENTED VIRTUAL REALITY HANDHELD DEVICE MARKET
    497. RESEARCH PROCESS OF MRFR
    498. REALITY HANDHELD DEVICE MARKET
    499. VIRTUAL REALITY HANDHELD DEVICE MARKET
    500. AUGMENTED VIRTUAL REALITY HANDHELD DEVICE MARKET
    501. CHAIN: AUGMENTED VIRTUAL REALITY HANDHELD DEVICE MARKET
    502. VIRTUAL REALITY HANDHELD DEVICE MARKET, BY DEVICE TYPE, 2024 (% SHARE)
    503. AUGMENTED VIRTUAL REALITY HANDHELD DEVICE MARKET, BY DEVICE TYPE, 2020 TO 2034
    504. (USD Billions)
    505. BY APPLICATION AREA, 2024 (% SHARE)
    506. DEVICE MARKET, BY APPLICATION AREA, 2020 TO 2034 (USD Billions)
    507. AUGMENTED VIRTUAL REALITY HANDHELD DEVICE MARKET, BY TECHNOLOGY ADOPTION, 2024 (%
    508. SHARE)
    509. ADOPTION, 2020 TO 2034 (USD Billions)
    510. HANDHELD DEVICE MARKET, BY USER DEMOGRAPHICS, 2024 (% SHARE)
    511. VIRTUAL REALITY HANDHELD DEVICE MARKET, BY USER DEMOGRAPHICS, 2020 TO 2034 (USD
    512. Billions)
    513. INTERACTION METHOD, 2024 (% SHARE)
    514. DEVICE MARKET, BY INTERACTION METHOD, 2020 TO 2034 (USD Billions)
    515. AUGMENTED VIRTUAL REALITY HANDHELD DEVICE MARKET, BY REGIONAL, 2024 (% SHARE)
    516. TO 2034 (USD Billions)

    Augmented Virtual Reality Handheld Device Market Segmentation

    • Augmented Virtual Reality Handheld Device Market By Device Type (USD Billion, 2020-2034)
      • Smart Glasses
      • Handheld Controllers
      • Wearable Headsets
      • Haptic Devices
    • Augmented Virtual Reality Handheld Device Market By Application Area (USD Billion, 2020-2034)
      • Gaming
      • Education and Training
      • Healthcare
      • Real Estate
      • Retail
    • Augmented Virtual Reality Handheld Device Market By Technology Adoption (USD Billion, 2020-2034)
      • Consumer Adoption
      • Enterprise Adoption
      • Research and Development
    • Augmented Virtual Reality Handheld Device Market By User Demographics (USD Billion, 2020-2034)
      • Children
      • Young Adults
      • Adults
      • Senior Citizens
    • Augmented Virtual Reality Handheld Device Market By Interaction Method (USD Billion, 2020-2034)
      • Touch Input
      • Voice Control
      • Gesture Recognition
      • Motion Tracking
    • Augmented Virtual Reality Handheld Device Market By Regional (USD Billion, 2020-2034)
      • North America
      • Europe
      • South America
      • Asia Pacific
      • Middle East and Africa

    Augmented Virtual Reality Handheld Device Market Regional Outlook (USD Billion, 2020-2034)

    • North America Outlook (USD Billion, 2020-2034)
      • North America Augmented Virtual Reality Handheld Device Market by Device Type
        • Smart Glasses
        • Handheld Controllers
        • Wearable Headsets
        • Haptic Devices
      • North America Augmented Virtual Reality Handheld Device Market by Application Area Type
        • Gaming
        • Education and Training
        • Healthcare
        • Real Estate
        • Retail
      • North America Augmented Virtual Reality Handheld Device Market by Technology Adoption Type
        • Consumer Adoption
        • Enterprise Adoption
        • Research and Development
      • North America Augmented Virtual Reality Handheld Device Market by User Demographics Type
        • Children
        • Young Adults
        • Adults
        • Senior Citizens
      • North America Augmented Virtual Reality Handheld Device Market by Interaction Method Type
        • Touch Input
        • Voice Control
        • Gesture Recognition
        • Motion Tracking
      • North America Augmented Virtual Reality Handheld Device Market by Regional Type
        • US
        • Canada
      • US Outlook (USD Billion, 2020-2034)
      • US Augmented Virtual Reality Handheld Device Market by Device Type
        • Smart Glasses
        • Handheld Controllers
        • Wearable Headsets
        • Haptic Devices
      • US Augmented Virtual Reality Handheld Device Market by Application Area Type
        • Gaming
        • Education and Training
        • Healthcare
        • Real Estate
        • Retail
      • US Augmented Virtual Reality Handheld Device Market by Technology Adoption Type
        • Consumer Adoption
        • Enterprise Adoption
        • Research and Development
      • US Augmented Virtual Reality Handheld Device Market by User Demographics Type
        • Children
        • Young Adults
        • Adults
        • Senior Citizens
      • US Augmented Virtual Reality Handheld Device Market by Interaction Method Type
        • Touch Input
        • Voice Control
        • Gesture Recognition
        • Motion Tracking
      • CANADA Outlook (USD Billion, 2020-2034)
      • CANADA Augmented Virtual Reality Handheld Device Market by Device Type
        • Smart Glasses
        • Handheld Controllers
        • Wearable Headsets
        • Haptic Devices
      • CANADA Augmented Virtual Reality Handheld Device Market by Application Area Type
        • Gaming
        • Education and Training
        • Healthcare
        • Real Estate
        • Retail
      • CANADA Augmented Virtual Reality Handheld Device Market by Technology Adoption Type
        • Consumer Adoption
        • Enterprise Adoption
        • Research and Development
      • CANADA Augmented Virtual Reality Handheld Device Market by User Demographics Type
        • Children
        • Young Adults
        • Adults
        • Senior Citizens
      • CANADA Augmented Virtual Reality Handheld Device Market by Interaction Method Type
        • Touch Input
        • Voice Control
        • Gesture Recognition
        • Motion Tracking
    • Europe Outlook (USD Billion, 2020-2034)
      • Europe Augmented Virtual Reality Handheld Device Market by Device Type
        • Smart Glasses
        • Handheld Controllers
        • Wearable Headsets
        • Haptic Devices
      • Europe Augmented Virtual Reality Handheld Device Market by Application Area Type
        • Gaming
        • Education and Training
        • Healthcare
        • Real Estate
        • Retail
      • Europe Augmented Virtual Reality Handheld Device Market by Technology Adoption Type
        • Consumer Adoption
        • Enterprise Adoption
        • Research and Development
      • Europe Augmented Virtual Reality Handheld Device Market by User Demographics Type
        • Children
        • Young Adults
        • Adults
        • Senior Citizens
      • Europe Augmented Virtual Reality Handheld Device Market by Interaction Method Type
        • Touch Input
        • Voice Control
        • Gesture Recognition
        • Motion Tracking
      • Europe Augmented Virtual Reality Handheld Device Market by Regional Type
        • Germany
        • UK
        • France
        • Russia
        • Italy
        • Spain
        • Rest of Europe
      • GERMANY Outlook (USD Billion, 2020-2034)
      • GERMANY Augmented Virtual Reality Handheld Device Market by Device Type
        • Smart Glasses
        • Handheld Controllers
        • Wearable Headsets
        • Haptic Devices
      • GERMANY Augmented Virtual Reality Handheld Device Market by Application Area Type
        • Gaming
        • Education and Training
        • Healthcare
        • Real Estate
        • Retail
      • GERMANY Augmented Virtual Reality Handheld Device Market by Technology Adoption Type
        • Consumer Adoption
        • Enterprise Adoption
        • Research and Development
      • GERMANY Augmented Virtual Reality Handheld Device Market by User Demographics Type
        • Children
        • Young Adults
        • Adults
        • Senior Citizens
      • GERMANY Augmented Virtual Reality Handheld Device Market by Interaction Method Type
        • Touch Input
        • Voice Control
        • Gesture Recognition
        • Motion Tracking
      • UK Outlook (USD Billion, 2020-2034)
      • UK Augmented Virtual Reality Handheld Device Market by Device Type
        • Smart Glasses
        • Handheld Controllers
        • Wearable Headsets
        • Haptic Devices
      • UK Augmented Virtual Reality Handheld Device Market by Application Area Type
        • Gaming
        • Education and Training
        • Healthcare
        • Real Estate
        • Retail
      • UK Augmented Virtual Reality Handheld Device Market by Technology Adoption Type
        • Consumer Adoption
        • Enterprise Adoption
        • Research and Development
      • UK Augmented Virtual Reality Handheld Device Market by User Demographics Type
        • Children
        • Young Adults
        • Adults
        • Senior Citizens
      • UK Augmented Virtual Reality Handheld Device Market by Interaction Method Type
        • Touch Input
        • Voice Control
        • Gesture Recognition
        • Motion Tracking
      • FRANCE Outlook (USD Billion, 2020-2034)
      • FRANCE Augmented Virtual Reality Handheld Device Market by Device Type
        • Smart Glasses
        • Handheld Controllers
        • Wearable Headsets
        • Haptic Devices
      • FRANCE Augmented Virtual Reality Handheld Device Market by Application Area Type
        • Gaming
        • Education and Training
        • Healthcare
        • Real Estate
        • Retail
      • FRANCE Augmented Virtual Reality Handheld Device Market by Technology Adoption Type
        • Consumer Adoption
        • Enterprise Adoption
        • Research and Development
      • FRANCE Augmented Virtual Reality Handheld Device Market by User Demographics Type
        • Children
        • Young Adults
        • Adults
        • Senior Citizens
      • FRANCE Augmented Virtual Reality Handheld Device Market by Interaction Method Type
        • Touch Input
        • Voice Control
        • Gesture Recognition
        • Motion Tracking
      • RUSSIA Outlook (USD Billion, 2020-2034)
      • RUSSIA Augmented Virtual Reality Handheld Device Market by Device Type
        • Smart Glasses
        • Handheld Controllers
        • Wearable Headsets
        • Haptic Devices
      • RUSSIA Augmented Virtual Reality Handheld Device Market by Application Area Type
        • Gaming
        • Education and Training
        • Healthcare
        • Real Estate
        • Retail
      • RUSSIA Augmented Virtual Reality Handheld Device Market by Technology Adoption Type
        • Consumer Adoption
        • Enterprise Adoption
        • Research and Development
      • RUSSIA Augmented Virtual Reality Handheld Device Market by User Demographics Type
        • Children
        • Young Adults
        • Adults
        • Senior Citizens
      • RUSSIA Augmented Virtual Reality Handheld Device Market by Interaction Method Type
        • Touch Input
        • Voice Control
        • Gesture Recognition
        • Motion Tracking
      • ITALY Outlook (USD Billion, 2020-2034)
      • ITALY Augmented Virtual Reality Handheld Device Market by Device Type
        • Smart Glasses
        • Handheld Controllers
        • Wearable Headsets
        • Haptic Devices
      • ITALY Augmented Virtual Reality Handheld Device Market by Application Area Type
        • Gaming
        • Education and Training
        • Healthcare
        • Real Estate
        • Retail
      • ITALY Augmented Virtual Reality Handheld Device Market by Technology Adoption Type
        • Consumer Adoption
        • Enterprise Adoption
        • Research and Development
      • ITALY Augmented Virtual Reality Handheld Device Market by User Demographics Type
        • Children
        • Young Adults
        • Adults
        • Senior Citizens
      • ITALY Augmented Virtual Reality Handheld Device Market by Interaction Method Type
        • Touch Input
        • Voice Control
        • Gesture Recognition
        • Motion Tracking
      • SPAIN Outlook (USD Billion, 2020-2034)
      • SPAIN Augmented Virtual Reality Handheld Device Market by Device Type
        • Smart Glasses
        • Handheld Controllers
        • Wearable Headsets
        • Haptic Devices
      • SPAIN Augmented Virtual Reality Handheld Device Market by Application Area Type
        • Gaming
        • Education and Training
        • Healthcare
        • Real Estate
        • Retail
      • SPAIN Augmented Virtual Reality Handheld Device Market by Technology Adoption Type
        • Consumer Adoption
        • Enterprise Adoption
        • Research and Development
      • SPAIN Augmented Virtual Reality Handheld Device Market by User Demographics Type
        • Children
        • Young Adults
        • Adults
        • Senior Citizens
      • SPAIN Augmented Virtual Reality Handheld Device Market by Interaction Method Type
        • Touch Input
        • Voice Control
        • Gesture Recognition
        • Motion Tracking
      • REST OF EUROPE Outlook (USD Billion, 2020-2034)
      • REST OF EUROPE Augmented Virtual Reality Handheld Device Market by Device Type
        • Smart Glasses
        • Handheld Controllers
        • Wearable Headsets
        • Haptic Devices
      • REST OF EUROPE Augmented Virtual Reality Handheld Device Market by Application Area Type
        • Gaming
        • Education and Training
        • Healthcare
        • Real Estate
        • Retail
      • REST OF EUROPE Augmented Virtual Reality Handheld Device Market by Technology Adoption Type
        • Consumer Adoption
        • Enterprise Adoption
        • Research and Development
      • REST OF EUROPE Augmented Virtual Reality Handheld Device Market by User Demographics Type
        • Children
        • Young Adults
        • Adults
        • Senior Citizens
      • REST OF EUROPE Augmented Virtual Reality Handheld Device Market by Interaction Method Type
        • Touch Input
        • Voice Control
        • Gesture Recognition
        • Motion Tracking
    • APAC Outlook (USD Billion, 2020-2034)
      • APAC Augmented Virtual Reality Handheld Device Market by Device Type
        • Smart Glasses
        • Handheld Controllers
        • Wearable Headsets
        • Haptic Devices
      • APAC Augmented Virtual Reality Handheld Device Market by Application Area Type
        • Gaming
        • Education and Training
        • Healthcare
        • Real Estate
        • Retail
      • APAC Augmented Virtual Reality Handheld Device Market by Technology Adoption Type
        • Consumer Adoption
        • Enterprise Adoption
        • Research and Development
      • APAC Augmented Virtual Reality Handheld Device Market by User Demographics Type
        • Children
        • Young Adults
        • Adults
        • Senior Citizens
      • APAC Augmented Virtual Reality Handheld Device Market by Interaction Method Type
        • Touch Input
        • Voice Control
        • Gesture Recognition
        • Motion Tracking
      • APAC Augmented Virtual Reality Handheld Device Market by Regional Type
        • China
        • India
        • Japan
        • South Korea
        • Malaysia
        • Thailand
        • Indonesia
        • Rest of APAC
      • CHINA Outlook (USD Billion, 2020-2034)
      • CHINA Augmented Virtual Reality Handheld Device Market by Device Type
        • Smart Glasses
        • Handheld Controllers
        • Wearable Headsets
        • Haptic Devices
      • CHINA Augmented Virtual Reality Handheld Device Market by Application Area Type
        • Gaming
        • Education and Training
        • Healthcare
        • Real Estate
        • Retail
      • CHINA Augmented Virtual Reality Handheld Device Market by Technology Adoption Type
        • Consumer Adoption
        • Enterprise Adoption
        • Research and Development
      • CHINA Augmented Virtual Reality Handheld Device Market by User Demographics Type
        • Children
        • Young Adults
        • Adults
        • Senior Citizens
      • CHINA Augmented Virtual Reality Handheld Device Market by Interaction Method Type
        • Touch Input
        • Voice Control
        • Gesture Recognition
        • Motion Tracking
      • INDIA Outlook (USD Billion, 2020-2034)
      • INDIA Augmented Virtual Reality Handheld Device Market by Device Type
        • Smart Glasses
        • Handheld Controllers
        • Wearable Headsets
        • Haptic Devices
      • INDIA Augmented Virtual Reality Handheld Device Market by Application Area Type
        • Gaming
        • Education and Training
        • Healthcare
        • Real Estate
        • Retail
      • INDIA Augmented Virtual Reality Handheld Device Market by Technology Adoption Type
        • Consumer Adoption
        • Enterprise Adoption
        • Research and Development
      • INDIA Augmented Virtual Reality Handheld Device Market by User Demographics Type
        • Children
        • Young Adults
        • Adults
        • Senior Citizens
      • INDIA Augmented Virtual Reality Handheld Device Market by Interaction Method Type
        • Touch Input
        • Voice Control
        • Gesture Recognition
        • Motion Tracking
      • JAPAN Outlook (USD Billion, 2020-2034)
      • JAPAN Augmented Virtual Reality Handheld Device Market by Device Type
        • Smart Glasses
        • Handheld Controllers
        • Wearable Headsets
        • Haptic Devices
      • JAPAN Augmented Virtual Reality Handheld Device Market by Application Area Type
        • Gaming
        • Education and Training
        • Healthcare
        • Real Estate
        • Retail
      • JAPAN Augmented Virtual Reality Handheld Device Market by Technology Adoption Type
        • Consumer Adoption
        • Enterprise Adoption
        • Research and Development
      • JAPAN Augmented Virtual Reality Handheld Device Market by User Demographics Type
        • Children
        • Young Adults
        • Adults
        • Senior Citizens
      • JAPAN Augmented Virtual Reality Handheld Device Market by Interaction Method Type
        • Touch Input
        • Voice Control
        • Gesture Recognition
        • Motion Tracking
      • SOUTH KOREA Outlook (USD Billion, 2020-2034)
      • SOUTH KOREA Augmented Virtual Reality Handheld Device Market by Device Type
        • Smart Glasses
        • Handheld Controllers
        • Wearable Headsets
        • Haptic Devices
      • SOUTH KOREA Augmented Virtual Reality Handheld Device Market by Application Area Type
        • Gaming
        • Education and Training
        • Healthcare
        • Real Estate
        • Retail
      • SOUTH KOREA Augmented Virtual Reality Handheld Device Market by Technology Adoption Type
        • Consumer Adoption
        • Enterprise Adoption
        • Research and Development
      • SOUTH KOREA Augmented Virtual Reality Handheld Device Market by User Demographics Type
        • Children
        • Young Adults
        • Adults
        • Senior Citizens
      • SOUTH KOREA Augmented Virtual Reality Handheld Device Market by Interaction Method Type
        • Touch Input
        • Voice Control
        • Gesture Recognition
        • Motion Tracking
      • MALAYSIA Outlook (USD Billion, 2020-2034)
      • MALAYSIA Augmented Virtual Reality Handheld Device Market by Device Type
        • Smart Glasses
        • Handheld Controllers
        • Wearable Headsets
        • Haptic Devices
      • MALAYSIA Augmented Virtual Reality Handheld Device Market by Application Area Type
        • Gaming
        • Education and Training
        • Healthcare
        • Real Estate
        • Retail
      • MALAYSIA Augmented Virtual Reality Handheld Device Market by Technology Adoption Type
        • Consumer Adoption
        • Enterprise Adoption
        • Research and Development
      • MALAYSIA Augmented Virtual Reality Handheld Device Market by User Demographics Type
        • Children
        • Young Adults
        • Adults
        • Senior Citizens
      • MALAYSIA Augmented Virtual Reality Handheld Device Market by Interaction Method Type
        • Touch Input
        • Voice Control
        • Gesture Recognition
        • Motion Tracking
      • THAILAND Outlook (USD Billion, 2020-2034)
      • THAILAND Augmented Virtual Reality Handheld Device Market by Device Type
        • Smart Glasses
        • Handheld Controllers
        • Wearable Headsets
        • Haptic Devices
      • THAILAND Augmented Virtual Reality Handheld Device Market by Application Area Type
        • Gaming
        • Education and Training
        • Healthcare
        • Real Estate
        • Retail
      • THAILAND Augmented Virtual Reality Handheld Device Market by Technology Adoption Type
        • Consumer Adoption
        • Enterprise Adoption
        • Research and Development
      • THAILAND Augmented Virtual Reality Handheld Device Market by User Demographics Type
        • Children
        • Young Adults
        • Adults
        • Senior Citizens
      • THAILAND Augmented Virtual Reality Handheld Device Market by Interaction Method Type
        • Touch Input
        • Voice Control
        • Gesture Recognition
        • Motion Tracking
      • INDONESIA Outlook (USD Billion, 2020-2034)
      • INDONESIA Augmented Virtual Reality Handheld Device Market by Device Type
        • Smart Glasses
        • Handheld Controllers
        • Wearable Headsets
        • Haptic Devices
      • INDONESIA Augmented Virtual Reality Handheld Device Market by Application Area Type
        • Gaming
        • Education and Training
        • Healthcare
        • Real Estate
        • Retail
      • INDONESIA Augmented Virtual Reality Handheld Device Market by Technology Adoption Type
        • Consumer Adoption
        • Enterprise Adoption
        • Research and Development
      • INDONESIA Augmented Virtual Reality Handheld Device Market by User Demographics Type
        • Children
        • Young Adults
        • Adults
        • Senior Citizens
      • INDONESIA Augmented Virtual Reality Handheld Device Market by Interaction Method Type
        • Touch Input
        • Voice Control
        • Gesture Recognition
        • Motion Tracking
      • REST OF APAC Outlook (USD Billion, 2020-2034)
      • REST OF APAC Augmented Virtual Reality Handheld Device Market by Device Type
        • Smart Glasses
        • Handheld Controllers
        • Wearable Headsets
        • Haptic Devices
      • REST OF APAC Augmented Virtual Reality Handheld Device Market by Application Area Type
        • Gaming
        • Education and Training
        • Healthcare
        • Real Estate
        • Retail
      • REST OF APAC Augmented Virtual Reality Handheld Device Market by Technology Adoption Type
        • Consumer Adoption
        • Enterprise Adoption
        • Research and Development
      • REST OF APAC Augmented Virtual Reality Handheld Device Market by User Demographics Type
        • Children
        • Young Adults
        • Adults
        • Senior Citizens
      • REST OF APAC Augmented Virtual Reality Handheld Device Market by Interaction Method Type
        • Touch Input
        • Voice Control
        • Gesture Recognition
        • Motion Tracking
    • South America Outlook (USD Billion, 2020-2034)
      • South America Augmented Virtual Reality Handheld Device Market by Device Type
        • Smart Glasses
        • Handheld Controllers
        • Wearable Headsets
        • Haptic Devices
      • South America Augmented Virtual Reality Handheld Device Market by Application Area Type
        • Gaming
        • Education and Training
        • Healthcare
        • Real Estate
        • Retail
      • South America Augmented Virtual Reality Handheld Device Market by Technology Adoption Type
        • Consumer Adoption
        • Enterprise Adoption
        • Research and Development
      • South America Augmented Virtual Reality Handheld Device Market by User Demographics Type
        • Children
        • Young Adults
        • Adults
        • Senior Citizens
      • South America Augmented Virtual Reality Handheld Device Market by Interaction Method Type
        • Touch Input
        • Voice Control
        • Gesture Recognition
        • Motion Tracking
      • South America Augmented Virtual Reality Handheld Device Market by Regional Type
        • Brazil
        • Mexico
        • Argentina
        • Rest of South America
      • BRAZIL Outlook (USD Billion, 2020-2034)
      • BRAZIL Augmented Virtual Reality Handheld Device Market by Device Type
        • Smart Glasses
        • Handheld Controllers
        • Wearable Headsets
        • Haptic Devices
      • BRAZIL Augmented Virtual Reality Handheld Device Market by Application Area Type
        • Gaming
        • Education and Training
        • Healthcare
        • Real Estate
        • Retail
      • BRAZIL Augmented Virtual Reality Handheld Device Market by Technology Adoption Type
        • Consumer Adoption
        • Enterprise Adoption
        • Research and Development
      • BRAZIL Augmented Virtual Reality Handheld Device Market by User Demographics Type
        • Children
        • Young Adults
        • Adults
        • Senior Citizens
      • BRAZIL Augmented Virtual Reality Handheld Device Market by Interaction Method Type
        • Touch Input
        • Voice Control
        • Gesture Recognition
        • Motion Tracking
      • MEXICO Outlook (USD Billion, 2020-2034)
      • MEXICO Augmented Virtual Reality Handheld Device Market by Device Type
        • Smart Glasses
        • Handheld Controllers
        • Wearable Headsets
        • Haptic Devices
      • MEXICO Augmented Virtual Reality Handheld Device Market by Application Area Type
        • Gaming
        • Education and Training
        • Healthcare
        • Real Estate
        • Retail
      • MEXICO Augmented Virtual Reality Handheld Device Market by Technology Adoption Type
        • Consumer Adoption
        • Enterprise Adoption
        • Research and Development
      • MEXICO Augmented Virtual Reality Handheld Device Market by User Demographics Type
        • Children
        • Young Adults
        • Adults
        • Senior Citizens
      • MEXICO Augmented Virtual Reality Handheld Device Market by Interaction Method Type
        • Touch Input
        • Voice Control
        • Gesture Recognition
        • Motion Tracking
      • ARGENTINA Outlook (USD Billion, 2020-2034)
      • ARGENTINA Augmented Virtual Reality Handheld Device Market by Device Type
        • Smart Glasses
        • Handheld Controllers
        • Wearable Headsets
        • Haptic Devices
      • ARGENTINA Augmented Virtual Reality Handheld Device Market by Application Area Type
        • Gaming
        • Education and Training
        • Healthcare
        • Real Estate
        • Retail
      • ARGENTINA Augmented Virtual Reality Handheld Device Market by Technology Adoption Type
        • Consumer Adoption
        • Enterprise Adoption
        • Research and Development
      • ARGENTINA Augmented Virtual Reality Handheld Device Market by User Demographics Type
        • Children
        • Young Adults
        • Adults
        • Senior Citizens
      • ARGENTINA Augmented Virtual Reality Handheld Device Market by Interaction Method Type
        • Touch Input
        • Voice Control
        • Gesture Recognition
        • Motion Tracking
      • REST OF SOUTH AMERICA Outlook (USD Billion, 2020-2034)
      • REST OF SOUTH AMERICA Augmented Virtual Reality Handheld Device Market by Device Type
        • Smart Glasses
        • Handheld Controllers
        • Wearable Headsets
        • Haptic Devices
      • REST OF SOUTH AMERICA Augmented Virtual Reality Handheld Device Market by Application Area Type
        • Gaming
        • Education and Training
        • Healthcare
        • Real Estate
        • Retail
      • REST OF SOUTH AMERICA Augmented Virtual Reality Handheld Device Market by Technology Adoption Type
        • Consumer Adoption
        • Enterprise Adoption
        • Research and Development
      • REST OF SOUTH AMERICA Augmented Virtual Reality Handheld Device Market by User Demographics Type
        • Children
        • Young Adults
        • Adults
        • Senior Citizens
      • REST OF SOUTH AMERICA Augmented Virtual Reality Handheld Device Market by Interaction Method Type
        • Touch Input
        • Voice Control
        • Gesture Recognition
        • Motion Tracking
    • MEA Outlook (USD Billion, 2020-2034)
      • MEA Augmented Virtual Reality Handheld Device Market by Device Type
        • Smart Glasses
        • Handheld Controllers
        • Wearable Headsets
        • Haptic Devices
      • MEA Augmented Virtual Reality Handheld Device Market by Application Area Type
        • Gaming
        • Education and Training
        • Healthcare
        • Real Estate
        • Retail
      • MEA Augmented Virtual Reality Handheld Device Market by Technology Adoption Type
        • Consumer Adoption
        • Enterprise Adoption
        • Research and Development
      • MEA Augmented Virtual Reality Handheld Device Market by User Demographics Type
        • Children
        • Young Adults
        • Adults
        • Senior Citizens
      • MEA Augmented Virtual Reality Handheld Device Market by Interaction Method Type
        • Touch Input
        • Voice Control
        • Gesture Recognition
        • Motion Tracking
      • MEA Augmented Virtual Reality Handheld Device Market by Regional Type
        • GCC Countries
        • South Africa
        • Rest of MEA
      • GCC COUNTRIES Outlook (USD Billion, 2020-2034)
      • GCC COUNTRIES Augmented Virtual Reality Handheld Device Market by Device Type
        • Smart Glasses
        • Handheld Controllers
        • Wearable Headsets
        • Haptic Devices
      • GCC COUNTRIES Augmented Virtual Reality Handheld Device Market by Application Area Type
        • Gaming
        • Education and Training
        • Healthcare
        • Real Estate
        • Retail
      • GCC COUNTRIES Augmented Virtual Reality Handheld Device Market by Technology Adoption Type
        • Consumer Adoption
        • Enterprise Adoption
        • Research and Development
      • GCC COUNTRIES Augmented Virtual Reality Handheld Device Market by User Demographics Type
        • Children
        • Young Adults
        • Adults
        • Senior Citizens
      • GCC COUNTRIES Augmented Virtual Reality Handheld Device Market by Interaction Method Type
        • Touch Input
        • Voice Control
        • Gesture Recognition
        • Motion Tracking
      • SOUTH AFRICA Outlook (USD Billion, 2020-2034)
      • SOUTH AFRICA Augmented Virtual Reality Handheld Device Market by Device Type
        • Smart Glasses
        • Handheld Controllers
        • Wearable Headsets
        • Haptic Devices
      • SOUTH AFRICA Augmented Virtual Reality Handheld Device Market by Application Area Type
        • Gaming
        • Education and Training
        • Healthcare
        • Real Estate
        • Retail
      • SOUTH AFRICA Augmented Virtual Reality Handheld Device Market by Technology Adoption Type
        • Consumer Adoption
        • Enterprise Adoption
        • Research and Development
      • SOUTH AFRICA Augmented Virtual Reality Handheld Device Market by User Demographics Type
        • Children
        • Young Adults
        • Adults
        • Senior Citizens
      • SOUTH AFRICA Augmented Virtual Reality Handheld Device Market by Interaction Method Type
        • Touch Input
        • Voice Control
        • Gesture Recognition
        • Motion Tracking
      • REST OF MEA Outlook (USD Billion, 2020-2034)
      • REST OF MEA Augmented Virtual Reality Handheld Device Market by Device Type
        • Smart Glasses
        • Handheld Controllers
        • Wearable Headsets
        • Haptic Devices
      • REST OF MEA Augmented Virtual Reality Handheld Device Market by Application Area Type
        • Gaming
        • Education and Training
        • Healthcare
        • Real Estate
        • Retail
      • REST OF MEA Augmented Virtual Reality Handheld Device Market by Technology Adoption Type
        • Consumer Adoption
        • Enterprise Adoption
        • Research and Development
      • REST OF MEA Augmented Virtual Reality Handheld Device Market by User Demographics Type
        • Children
        • Young Adults
        • Adults
        • Senior Citizens
      • REST OF MEA Augmented Virtual Reality Handheld Device Market by Interaction Method Type
        • Touch Input
        • Voice Control
        • Gesture Recognition
        • Motion Tracking


    Report Infographic
    Free Sample Request

    Kindly complete the form below to receive a free sample of this Report

    Customer Strories

    “I am very pleased with how market segments have been defined in a relevant way for my purposes (such as "Portable Freezers & refrigerators" and "last-mile"). In general the report is well structured. Thanks very much for your efforts.”

    Victoria Milne Founder
    Case Study

    Chemicals and Materials