• Cat-intel
  • MedIntelliX
  • Resources
  • About Us
  • Request Free Sample ×

    Kindly complete the form below to receive a free sample of this Report

    Leading companies partner with us for data-driven Insights

    clients tt-cursor

    Augmented Reality Mixed Reality Market

    ID: MRFR/ICT/41017-HCR
    200 Pages
    Garvit Vyas
    September 2025

    Global Augmented Reality Mixed Reality Market Research Report: By Application (Gaming, Healthcare, Education, Retail, Military), By Device Type (Smartphone, Tablet, Smart Glasses, Head-Mounted Displays, Projectors), By Technology (Marker-Based, Marker-Less, Projection-Based, Superimposition-Based), By End Use (Consumer, Enterprise, Government) andBy Regional (North America, Europe, South America, Asia Pacific, Middle East and Africa)- Forecast to 2035

    Share:
    Download PDF ×

    We do not share your information with anyone. However, we may send you emails based on your report interest from time to time. You may contact us at any time to opt-out.

    Augmented Reality Mixed Reality Market - Research Report Forecast Till 2035 Infographic
    Purchase Options
    $ 4,950.0
    $ 5,950.0
    $ 7,250.0
    Table of Contents

    Augmented Reality Mixed Reality Market Summary

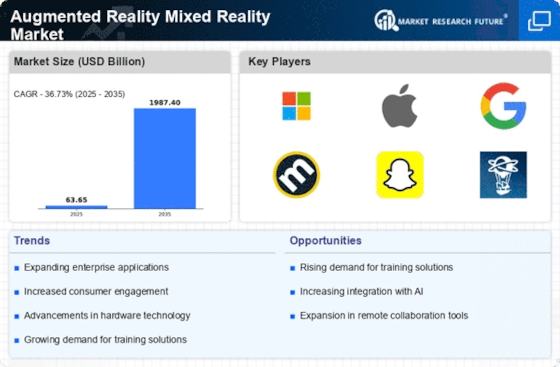
    The Global Augmented Reality Mixed Reality Market is projected to grow from 63.6 USD Billion in 2024 to 1988.2 USD Billion by 2035.

    Key Market Trends & Highlights

    Augmented Reality Mixed Reality Key Trends and Highlights

    • The market is expected to experience a compound annual growth rate of 36.73 percent from 2025 to 2035.
    • By 2035, the market valuation is anticipated to reach 1988.2 USD Billion, indicating substantial growth potential.
    • In 2024, the market is valued at 63.6 USD Billion, reflecting the current investment landscape.
    • Growing adoption of augmented reality technology due to increasing demand for immersive experiences is a major market driver.

    Market Size & Forecast

    2024 Market Size 63.6 (USD Billion)
    2035 Market Size 1988.2 (USD Billion)
    CAGR (2025-2035) 36.73%

    Major Players

    Google, Unity Technologies, Qualcomm, DAQRI, Blippar, Microsoft, PTC, Snap, Apple, Zebra Technologies, Nvidia, Vive, Magic Leap, Facebook, Samsung

    Augmented Reality Mixed Reality Market Trends

    The Global Augmented Reality (AR) and Mixed Reality (MR) market is witnessing significant growth driven by several factors. One of the main drivers is the increasing demand for immersive experiences in various sectors such as gaming, education, and healthcare. Businesses are increasingly adopting AR and MR technologies to engage customers more effectively. The rise of smartphones and wearable devices also plays a pivotal role in broadening accessibility and usability, making AR and MR solutions more appealing to a wider audience.

    Furthermore, advancements in related technologies, like 5G and artificial intelligence, enhance the performance and capabilities of AR and MR applications, which contributes to market expansion.Numerous opportunities exist for organizations to capitalize on in this ever-evolving landscape. For instance, industries such as retail and manufacturing can leverage AR solutions for virtual try-ons and product simulations to improve customer experiences. Additionally, the healthcare sector can use AR technology for surgical training and patient education, enhancing the overall quality of care. The rapid development of the gaming industry also presents an ongoing opportunity as consumers continue to seek innovative experiences.

    Companies can explore partnerships and collaborations, leading to new applications of AR and MR that cater to various consumer and business needs.Recent trends indicate a growing integration of AR and MR in everyday activities, from simple mobile applications to complex business solutions. The focus on remote collaboration has surged, with tools that enable users to interact in virtual spaces becoming increasingly popular. Moreover, there is a noticeable shift towards creating more user-friendly and flexible AR and MR technologies, allowing easier adoption across different demographics.

    Brands are also investing in marketing strategies that incorporate AR, making it integral to their outreach efforts. This landscape suggests a promising future for the AR and MR markets, with continuous innovation and user engagement driving further development.

    The ongoing advancements in augmented and mixed reality technologies are poised to transform various sectors, enhancing user engagement and operational efficiency across industries.

    U.S. Department of Commerce

    Augmented Reality Mixed Reality Market Drivers

    Healthcare Innovations

    The Global Augmented Reality Mixed Reality Market Industry is being driven by innovations in healthcare applications. AR and MR technologies are transforming surgical procedures, medical training, and patient care. Surgeons are using AR overlays to visualize critical information during operations, enhancing precision and outcomes. Additionally, AR is being employed in medical education to provide students with interactive simulations of complex procedures. The growing investment in healthcare technology suggests a sustained demand for AR solutions, further propelling market growth. As the industry evolves, the market size is anticipated to reach 1988.2 USD Billion by 2035.

    Growing Demand in Retail

    The Global Augmented Reality Mixed Reality Market Industry is significantly influenced by the growing demand for AR applications in the retail sector. Retailers are increasingly utilizing AR to enhance customer experiences, allowing consumers to visualize products in their own environments before making a purchase. For instance, furniture retailers offer AR apps that enable customers to see how a piece of furniture would look in their home. This trend not only improves customer satisfaction but also boosts sales conversion rates. As retailers continue to adopt these technologies, the market is expected to experience a compound annual growth rate of 36.73% from 2025 to 2035.

    Market Growth Projections

    The Global Augmented Reality Mixed Reality Market Industry is poised for remarkable growth, with projections indicating a market size of 63.6 USD Billion in 2024 and an astonishing 1988.2 USD Billion by 2035. The expected compound annual growth rate of 36.73% from 2025 to 2035 highlights the increasing integration of AR and MR technologies across various sectors. This growth is driven by factors such as technological advancements, increased adoption in education, and the expanding retail market. As industries recognize the potential of AR and MR, the market is likely to witness unprecedented expansion in the coming years.

    Technological Advancements

    The Global Augmented Reality Mixed Reality Market Industry is propelled by rapid technological advancements in hardware and software. Innovations such as improved sensors, faster processors, and enhanced display technologies are enabling more immersive experiences. For instance, the integration of artificial intelligence and machine learning into AR applications allows for real-time data processing and interaction. This trend is evident in sectors like healthcare, where AR is used for surgical simulations and training. As technology continues to evolve, the market is expected to grow significantly, with projections indicating a market size of 63.6 USD Billion in 2024.

    Increased Adoption in Education

    The Global Augmented Reality Mixed Reality Market Industry is witnessing increased adoption in the education sector, where immersive learning experiences are becoming more prevalent. Educational institutions are leveraging AR and MR technologies to enhance student engagement and understanding of complex subjects. For example, AR applications in science classes allow students to visualize molecular structures in 3D. This trend is likely to expand as educational budgets allocate more resources towards technology integration. The potential for AR in education suggests a robust growth trajectory, contributing to the overall market expansion towards an estimated 1988.2 USD Billion by 2035.

    Expansion in Gaming and Entertainment

    The Global Augmented Reality Mixed Reality Market Industry is experiencing substantial growth due to the expansion of AR in gaming and entertainment. The popularity of AR games, such as those that integrate real-world environments with virtual elements, is attracting a diverse audience. This trend is supported by advancements in mobile technology, making AR experiences more accessible. The gaming industry is projected to be a major contributor to market growth, with innovative AR experiences drawing in millions of users worldwide. As this segment continues to flourish, it is likely to play a crucial role in achieving a market valuation of 63.6 USD Billion in 2024.

    Market Segment Insights

    Augmented Reality Mixed Reality Market Application Insights

    The Global Augmented Reality Mixed Reality Market revenue is projected to see remarkable growth, with diverse Applications playing a critical role in its expansion. The Application segment has significant contributions from various domains, showcasing the versatility of Augmented Reality (AR) and Mixed Reality (MR) technologies. By 2024, the market valued at 63.65 USD Billion, with growing interest in sectors such as Gaming, Healthcare, Education, Retail, and Military. The Gaming sector stands out, holding a valuation of 15.5 USD Billion in 2024 and expected to rise significantly to 578.9 USD Billion by 2035, reflecting its majority holding in the market.

    The immersive nature of AR and MR in gaming enhances user experiences, driving continued investment and innovation in this segment. Following closely, the Healthcare segment is valued at 12.3 USD Billion in 2024 and is anticipated to burgeon to 385.7 USD Billion by 2035. The integration of AR technologies in surgical procedures and medical training enhances accuracy and learning, making it a significant player in transforming healthcare practices.

    The Education sector also holds its ground with a value of 11.0 USD Billion in 2024, growing to 350.3 USD Billion by 2035.The demand for interactive learning experiences is essential for student engagement and knowledge retention, which drives its development within the market. The Retail sector, valued at 10.0 USD Billion in 2024 and reaching 325.2 USD Billion by 2035, benefits from AR in enhancing customer experiences through virtual try-ons and interactive product displays, which optimize sales and customer satisfaction.

    Lastly, the Military sector, valued at 14.85 USD Billion in 2024 and aiming for 348.15 USD Billion by 2035, illustrates the importance of AR and MR in training simulations and situational awareness, showcasing the strategic innovations reshaping defense operations.Each sector not only demonstrates significant potential for growth but also offers distinct applications of AR and MR technologies that shape how users interact with their environments. The statistics within the Global Augmented Reality Mixed Reality Market data underscore a broad spectrum of opportunities, emphasizing the importance of continued advancements and investments in these applications across different industries.

    As the market grows, understanding these trends and impacts will be crucial for stakeholders looking to capitalize on the expanding Global Augmented Reality Mixed Reality Market segmentation.The increasing adoption rates provide a fertile ground for new entrants and existing players, all vying for shares in a promising industry landscape that is rapidly evolving. With compelling data supporting this landscape, investment in Augmented Reality and Mixed Reality Applications is expected to strategically define the future of various critical sectors within the marketplace.

    Augmented Reality Mixed Reality Market Application Insights

    Source: Primary Research, Secondary Research, Market Research Future Database and Analyst Review

    Augmented Reality Mixed Reality Market Device Type Insights

    In the Device Type segment, which includes Smartphones, Tablets, Smart Glasses, Head-Mounted Displays, and Projectors, user convenience and technological advancements are driving substantial market engagement. Smartphones and Tablets are significantly contributing to the market due to their widespread use and easy accessibility, making augmented reality applications more popular among everyday consumers.Smart Glasses are gradually gaining traction, yet their higher price point often makes them a niche choice for specific industries, such as healthcare and engineering. Head-Mounted Displays represent another critical performance area, especially in gaming and training sessions, where immersive experiences are paramount.

    Projectors also present unique opportunities for shared augmented reality experiences in educational and professional settings. Each device type offers distinct advantages and caters to various user needs, thus shaping the Global Augmented Reality Mixed Reality Market segmentation landscape and contributing to the market growth witnessed overall.

    Augmented Reality Mixed Reality Market Technology Insights

    The market showcases diverse approaches, such as Marker-Based, Marker-Less, Projection-Based, and Superimposition-Based technologies, each offering unique functionalities and applications. Marker-Based technology enables interaction with digital content via specific visual markers, playing a vital role in controlled environments like retail and education. Conversely, Marker-Less technology dominates by allowing overlay of digital information in real-world environments without reliance on markers, enhancing user experience and flexibility in gaming and navigation.Projection-Based methods leverage light projection to create interactive displays, beneficial in exhibitions and presentations. Lastly, Superimposition-Based technology enriches real-world views by overlaying digital data, thus enhancing fields like surgery and training.

    The Global Augmented Reality Mixed Reality Market statistics further illustrate potential for growth, positioning this industry at the forefront of technological advancement and consumer engagement.

    Augmented Reality Mixed Reality Market End Use Insights

    The Global Augmented Reality Mixed Reality Market is poised for significant growth as the consumer, enterprise and government sectors increasingly adopt these technologies. Among the end-use areas, the consumer segment plays a crucial role, particularly in gaming and retail, where user engagement and personalized experiences are becoming essential. The enterprise segment is also significant, with industries leveraging augmented and mixed reality for training, maintenance, and collaboration purposes, thus enhancing operational efficiency.Furthermore, the government segment is exploring applications in defense, education, and public safety, indicating the versatility of the technology.

    This diversity in end-use illustrates the wide-ranging potential of the Global Augmented Reality Mixed Reality Market, making it an attractive arena for investment and innovation. Overall, the market is experiencing strong growth rates attributed to increasing investments, technological advancements, and the expanding array of applications across various industries.

    Regional Insights

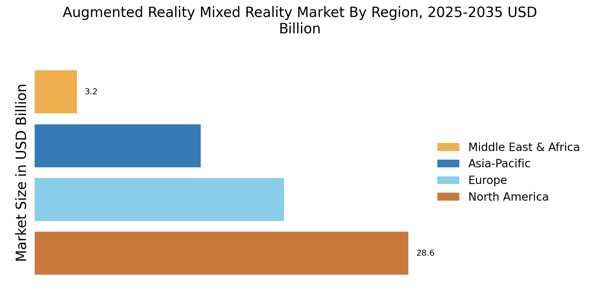
    The Global Augmented Reality Mixed Reality Market showcases significant regional diversity, with North America leading in market value. In 2024, North America was valued at 29.25 USD Billion and is projected to reach 995.12 USD Billion by 2035, highlighting its majority holding and strong demand across various applications.

    Europe follows with a valuation of 15.38 USD Billion in 2024, expected to grow to 486.0 USD Billion by 2035, showing a robust market driven by technological advancements and integration in industries such as retail and education.The APAC region, valued at 12.1 USD Billion in 2024 and forecasted to grow to 393.42 USD Billion by 2035, represents a significant opportunity due to rapid digitalization and increasing use of augmented reality in gaming and entertainment. South America, with a market valuation of 4.5 USD Billion in 2024, is projected to rise to 35.75 USD Billion by 2035, indicating gradual growth potential.

    The MEA segment, although smaller with a value of 2.42 USD Billion in 2024, is expected to increase to 77.96 USD Billion by 2035, suggesting increasing adoption of augmented reality technologies driven by infrastructure developments.Overall, the Global Augmented Reality Mixed Reality Market segmentation reveals diverse growth trajectories and regional strengths contributing to the industry's advancement.

    Augmented Reality Mixed Reality Market Regional Insights

    Source: Primary Research, Secondary Research, Market Research Future Database and Analyst Review

    Key Players and Competitive Insights

    The Global Augmented Reality Mixed Reality Market has become increasingly dynamic and competitive, driven by advancements in technology, rising consumer demand, and extensive applications across various industries. As immersive technology, augmented reality and mixed reality facilitate interactive experiences that blend digital content with the real-world environment. This has opened new doors for businesses seeking innovative ways to engage customers, enhance training programs, and streamline operations. Competitive insights within this market reveal a landscape characterized by rapid innovation, strategic partnerships, and the pursuit of scalability as companies strive to harness the full potential of augmented and mixed reality experiences.

    Industry players are keenly focused on creating robust ecosystems that combine hardware, software, and content to stay ahead in a market that exhibits significant growth projections.Focusing on Google, the company's extensive experience in technology and software development positions it as a formidable player in the Global Augmented Reality Mixed Reality Market. Google's strengths lie in its substantial resources, innovative capabilities, and strong brand reputation. The company has made significant strides in integrating augmented reality features into existing platforms like Google Maps, providing users with navigational assistance overlayed on the real world.

    Furthermore, Google's commitment to artificial intelligence and machine learning enhances its AR initiatives, allowing for highly personalized and contextually aware experiences. The company's access to vast amounts of data also enables the development of more effective augmented reality applications, ensuring that they remain competitive.

    By continuously investing in research and development, Google has positioned itself as a leading contender in creating engaging AR and MR solutions that push the boundaries of what is possible.Unity Technologies is another significant entity in the Global Augmented Reality Mixed Reality Market, particularly recognized for its powerful platform that supports the development of interactive 2D and 3D content. Unity's strength lies in its user-friendly interface and extensive tools designed for creators, making it an ideal choice for both large enterprises and independent developers aiming to produce augmented reality experiences .

    The versatility of the Unity engine allows developers to deploy applications across multiple devices, maximizing reach and accessibility. With a robust community of developers and numerous training resources available, Unity fosters collaboration and innovation, ensuring continuous growth in the market. The company remains committed to enhancing real-time rendering and spatial mapping capabilities in its platform, positioning itself at the forefront of advancements in augmented and mixed reality technology. Unity Technologies' proactive approach to industry trends and developer needs establishes it as a key player, contributing to the evolution and expanding applications of AR and MR environments.

    Key Companies in the Augmented Reality Mixed Reality Market market include

    Industry Developments

    The Global Augmented Reality (AR) and Mixed Reality (MR) Market is witnessing significant developments, particularly from leading companies like Google, Microsoft, and Apple. Google has been enhancing its AR capabilities through advancements in Google's ARCore, aiming to integrate AR into everyday applications more seamlessly. Meanwhile, Microsoft continues to expand its HoloLens platform for enterprise solutions, emphasizing reality training applications. Apple has reportedly been increasing investments in its AR endeavors, potentially gearing up to launch new devices that leverage AR experiences.

    Unity Technologies and Qualcomm are also making strides with their AR platforms, focusing on software development kits and hardware solutions that support immersive experiences.

    Furthermore, recent mergers and acquisitions are shaping the landscape, with notable activity among these tech giants reflecting the increasing importance of AR and MR technologies. The market has seen a considerable increase in valuation, driven by the growing demand for AR and MR applications across various sectors, including gaming, retail, and healthcare. This expansion highlights the accelerating adoption of immersive technologies and the competitive maneuvers of companies like Blippar, Snap, and Magic Leap in pushing the boundaries of what AR and MR can achieve.

    Future Outlook

    Augmented Reality Mixed Reality Market Future Outlook

    The Global Augmented Reality Mixed Reality Market is projected to grow at a 36.73% CAGR from 2024 to 2035, driven by technological advancements, increased adoption in various sectors, and enhanced user experiences.

    New opportunities lie in:

    • Develop AR solutions for remote collaboration in enterprises.
    • Create immersive training programs using mixed reality for healthcare professionals.
    • Leverage AR for personalized marketing strategies in retail environments.

    By 2035, the market is expected to be robust, reflecting substantial advancements and widespread adoption.

    Market Segmentation

    Augmented Reality Mixed Reality Market End Use Outlook

    • North America
    • Europe
    • South America
    • Asia Pacific
    • Middle East and Africa

    Augmented Reality Mixed Reality Market Regional Outlook

    • North America
    • Europe
    • South America
    • Asia Pacific
    • Middle East and Africa

    Augmented Reality Mixed Reality Market Technology Outlook

    • Consumer
    • Enterprise
    • Government

    Augmented Reality Mixed Reality Market Application Outlook

    • Smartphone
    • Tablet
    • Smart Glasses
    • Head-Mounted Displays
    • Projectors

    Augmented Reality Mixed Reality Market Device Type Outlook

    • Marker-Based
    • Marker-Less
    • Projection-Based
    • Superimposition-Based

    Report Scope

    Report Attribute/Metric Details
    Market Size 2023 46.55(USD Billion)
    Market Size 2024 63.65(USD Billion)
    Market Size 2035 1988.25(USD Billion)
    Compound Annual Growth Rate (CAGR) 36.73% (2025 - 2035)
    Report Coverage Revenue Forecast, Competitive Landscape, Growth Factors, and Trends
    Base Year 2024
    Market Forecast Period 2025 - 2035
    Historical Data 2019 - 2024
    Market Forecast Units USD Billion
    Key Companies Profiled Google, Unity Technologies, Qualcomm, DAQRI, Blippar, Microsoft, PTC, Snap, Apple, Zebra Technologies, Nvidia, Vive, Magic Leap, Facebook, Samsung
    Segments Covered Application, Device Type, Technology, End Use, Regional
    Key Market Opportunities Enhanced training simulations, Remote collaboration tools, AR in retail experiences, Gaming and entertainment innovations, Healthcare visualization applications
    Key Market Dynamics Technological advancements, Increasing investment, Growing consumer demand, Enhanced user experience, Expanding application areas
    Countries Covered North America, Europe, APAC, South America, MEA

    Market Highlights

    Author
    Garvit Vyas
    Analyst

    Explore the profile of Garvit Vyas, one of our esteemed authors at Market Research Future, and access their expert research contributions in the field of market research and industry analysis

    Leave a Comment

    FAQs

    What is the expected market size of the Global Augmented Reality Mixed Reality Market in 2024?

    The Global Augmented Reality Mixed Reality Market is expected to be valued at 63.65 USD Billion in 2024.

    What is the projected market size for the Global Augmented Reality Mixed Reality Market by 2035?

    By 2035, the Global Augmented Reality Mixed Reality Market is projected to reach a value of 1988.25 USD Billion.

    What is the expected compound annual growth rate (CAGR) for the Global Augmented Reality Mixed Reality Market from 2025 to 2035?

    The expected CAGR for the Global Augmented Reality Mixed Reality Market from 2025 to 2035 is 36.73%.

    Which region is expected to dominate the Global Augmented Reality Mixed Reality Market by 2035?

    North America is expected to dominate the Global Augmented Reality Mixed Reality Market with a value of 995.12 USD Billion by 2035.

    What will be the market size of the Gaming application segment in 2035?

    The market size for the Gaming application segment is expected to be 578.9 USD Billion by 2035.

    Which company is among the major players in the Global Augmented Reality Mixed Reality Market?

    Companies such as Google, Microsoft, and Qualcomm are considered major players in the Global Augmented Reality Mixed Reality Market.

    What is the projected market size for the Healthcare application segment by 2035?

    The Healthcare application segment is projected to reach a market size of 385.7 USD Billion by 2035.

    What will be the size of the Retail application segment in 2024?

    The Retail application segment is anticipated to be valued at 10.0 USD Billion in 2024.

    How much will the APAC region be valued in the Global Augmented Reality Mixed Reality Market by 2035?

    The APAC region is expected to be valued at 393.42 USD Billion in the Global Augmented Reality Mixed Reality Market by 2035.

    What is the expected market size for the Military application segment in 2024?

    The expected market size for the Military application segment in 2024 is 14.85 USD Billion.

    1. 'TABLE OF CONTENTS
    2. EXECUTIVE SUMMARY
    3. Market Overview
      1. Key Findings
      2. Market Segmentation
    4. Competitive Landscape
      1. Challenges and Opportunities
      2. Future Outlook
    5. MARKET INTRODUCTION
      1. Definition
      2. Scope of the study
        1. Research Objective
        2. Assumption
        3. Limitations
    6. RESEARCH METHODOLOGY
      1. Overview
    7. Data Mining
      1. Secondary Research
      2. Primary Research
    8. Primary Interviews and Information Gathering Process
      1. Breakdown of Primary
    9. Respondents
      1. Forecasting Model
      2. Market Size Estimation
    10. Bottom-Up Approach
      1. Top-Down Approach
      2. Data Triangulation
      3. Validation
    11. MARKET DYNAMICS
      1. Overview
      2. Drivers
      3. Restraints
      4. Opportunities
    12. MARKET FACTOR ANALYSIS
      1. Value chain Analysis
      2. Porter''s Five Forces
    13. Analysis
      1. Bargaining Power of Suppliers
        1. Bargaining Power
    14. of Buyers
      1. Threat of New Entrants
        1. Threat of Substitutes
        2. Intensity of Rivalry
      2. COVID-19 Impact Analysis
    15. Market Impact Analysis
      1. Regional Impact
        1. Opportunity and
    16. Threat Analysis
    17. AUGMENTED REALITY MIXED REALITY MARKET,
    18. BY APPLICATION (USD BILLION)
      1. Gaming
      2. Healthcare
    19. Education
      1. Retail
      2. Military
    20. AUGMENTED REALITY MIXED
    21. REALITY MARKET, BY DEVICE TYPE (USD BILLION)
      1. Smartphone
      2. Tablet
      3. Smart Glasses
      4. Head-Mounted Displays
      5. Projectors
    22. AUGMENTED REALITY MIXED REALITY MARKET, BY TECHNOLOGY (USD BILLION)
      1. Marker-Based
      2. Marker-Less
      3. Projection-Based
    23. Superimposition-Based
    24. AUGMENTED REALITY MIXED REALITY MARKET, BY END USE
    25. (USD BILLION)
      1. Consumer
      2. Enterprise
      3. Government
    26. AUGMENTED REALITY MIXED REALITY MARKET, BY REGIONAL (USD BILLION)
    27. North America
      1. US
        1. Canada
      2. Europe
    28. Germany
      1. UK
        1. France
        2. Russia
    29. Italy
      1. Spain
        1. Rest of Europe
      2. APAC
    30. China
      1. India
        1. Japan
        2. South Korea
    31. Malaysia
      1. Thailand
        1. Indonesia
        2. Rest of APAC
      2. South America
        1. Brazil
        2. Mexico
    32. Argentina
      1. Rest of South America
      2. MEA
        1. GCC
    33. Countries
      1. South Africa
        1. Rest of MEA
    34. COMPETITIVE LANDSCAPE
      1. Overview
      2. Competitive Analysis
      3. Market share Analysis
      4. Major Growth Strategy in the Augmented
    35. Reality Mixed Reality Market
      1. Competitive Benchmarking
      2. Leading
    36. Players in Terms of Number of Developments in the Augmented Reality Mixed Reality
    37. Market
      1. Key developments and growth strategies
        1. New Product
    38. Launch/Service Deployment
      1. Merger & Acquisitions
    39. Joint Ventures
      1. Major Players Financial Matrix
        1. Sales and
    40. Operating Income
      1. Major Players R&D Expenditure. 2023
    41. COMPANY PROFILES
      1. Google
        1. Financial Overview
    42. Products Offered
      1. Key Developments
        1. SWOT Analysis
        2. Key Strategies
      2. Unity Technologies
        1. Financial
    43. Overview
      1. Products Offered
        1. Key Developments
    44. SWOT Analysis
      1. Key Strategies
      2. Qualcomm
        1. Financial
    45. Overview
      1. Products Offered
        1. Key Developments
    46. SWOT Analysis
      1. Key Strategies
      2. DAQRI
        1. Financial
    47. Overview
      1. Products Offered
        1. Key Developments
    48. SWOT Analysis
      1. Key Strategies
      2. Blippar
        1. Financial
    49. Overview
      1. Products Offered
        1. Key Developments
    50. SWOT Analysis
      1. Key Strategies
      2. Microsoft
        1. Financial
    51. Overview
      1. Products Offered
        1. Key Developments
    52. SWOT Analysis
      1. Key Strategies
      2. PTC
        1. Financial
    53. Overview
      1. Products Offered
        1. Key Developments
    54. SWOT Analysis
      1. Key Strategies
      2. Snap
        1. Financial
    55. Overview
      1. Products Offered
        1. Key Developments
    56. SWOT Analysis
      1. Key Strategies
      2. Apple
        1. Financial
    57. Overview
      1. Products Offered
        1. Key Developments
    58. SWOT Analysis
      1. Key Strategies
      2. Zebra Technologies
    59. Financial Overview
      1. Products Offered
        1. Key Developments
        2. SWOT Analysis
        3. Key Strategies
      2. Nvidia
        1. Financial Overview
        2. Products Offered
        3. Key
    60. Developments
      1. SWOT Analysis
        1. Key Strategies
    61. Vive
      1. Financial Overview
        1. Products Offered
    62. Key Developments
      1. SWOT Analysis
        1. Key Strategies
      2. Magic Leap
        1. Financial Overview
        2. Products Offered
        3. Key Developments
        4. SWOT Analysis
        5. Key
    63. Strategies
      1. Facebook
        1. Financial Overview
    64. Products Offered
      1. Key Developments
        1. SWOT Analysis
        2. Key Strategies
      2. Samsung
        1. Financial Overview
        2. Products Offered
        3. Key Developments
        4. SWOT
    65. Analysis
      1. Key Strategies
    66. APPENDIX
      1. References
      2. Related Reports
    67. & FORECAST, BY APPLICATION, 2019-2035 (USD BILLIONS)
    68. AUGMENTED REALITY MIXED REALITY MARKET SIZE ESTIMATES & FORECAST, BY DEVICE
    69. TYPE, 2019-2035 (USD BILLIONS)
    70. REALITY MARKET SIZE ESTIMATES & FORECAST, BY TECHNOLOGY, 2019-2035 (USD BILLIONS)
    71. & FORECAST, BY END USE, 2019-2035 (USD BILLIONS)
    72. AUGMENTED REALITY MIXED REALITY MARKET SIZE ESTIMATES & FORECAST, BY REGIONAL,
    73. 2035 (USD BILLIONS)
    74. SIZE ESTIMATES & FORECAST, BY APPLICATION, 2019-2035 (USD BILLIONS)
    75. US AUGMENTED REALITY MIXED REALITY MARKET SIZE ESTIMATES & FORECAST, BY DEVICE
    76. TYPE, 2019-2035 (USD BILLIONS)
    77. MARKET SIZE ESTIMATES & FORECAST, BY TECHNOLOGY, 2019-2035 (USD BILLIONS)
    78. BY END USE, 2019-2035 (USD BILLIONS)
    79. REALITY MARKET SIZE ESTIMATES & FORECAST, BY REGIONAL, 2019-2035 (USD BILLIONS)
    80. FORECAST, BY APPLICATION, 2019-2035 (USD BILLIONS)
    81. REALITY MIXED REALITY MARKET SIZE ESTIMATES & FORECAST, BY DEVICE TYPE, 2019-2035
    82. (USD BILLIONS)
    83. ESTIMATES & FORECAST, BY TECHNOLOGY, 2019-2035 (USD BILLIONS)
    84. CANADA AUGMENTED REALITY MIXED REALITY MARKET SIZE ESTIMATES & FORECAST, BY
    85. END USE, 2019-2035 (USD BILLIONS)
    86. REALITY MARKET SIZE ESTIMATES & FORECAST, BY REGIONAL, 2019-2035 (USD BILLIONS)
    87. FORECAST, BY APPLICATION, 2019-2035 (USD BILLIONS)
    88. REALITY MIXED REALITY MARKET SIZE ESTIMATES & FORECAST, BY DEVICE TYPE, 2019-2035
    89. (USD BILLIONS)
    90. ESTIMATES & FORECAST, BY TECHNOLOGY, 2019-2035 (USD BILLIONS)
    91. EUROPE AUGMENTED REALITY MIXED REALITY MARKET SIZE ESTIMATES & FORECAST, BY
    92. END USE, 2019-2035 (USD BILLIONS)
    93. REALITY MARKET SIZE ESTIMATES & FORECAST, BY REGIONAL, 2019-2035 (USD BILLIONS)
    94. FORECAST, BY APPLICATION, 2019-2035 (USD BILLIONS)
    95. REALITY MIXED REALITY MARKET SIZE ESTIMATES & FORECAST, BY DEVICE TYPE, 2019-2035
    96. (USD BILLIONS)
    97. ESTIMATES & FORECAST, BY TECHNOLOGY, 2019-2035 (USD BILLIONS)
    98. GERMANY AUGMENTED REALITY MIXED REALITY MARKET SIZE ESTIMATES & FORECAST, BY
    99. END USE, 2019-2035 (USD BILLIONS)
    100. REALITY MARKET SIZE ESTIMATES & FORECAST, BY REGIONAL, 2019-2035 (USD BILLIONS)
    101. BY APPLICATION, 2019-2035 (USD BILLIONS)
    102. REALITY MARKET SIZE ESTIMATES & FORECAST, BY DEVICE TYPE, 2019-2035 (USD BILLIONS)
    103. BY TECHNOLOGY, 2019-2035 (USD BILLIONS)
    104. REALITY MARKET SIZE ESTIMATES & FORECAST, BY END USE, 2019-2035 (USD BILLIONS)
    105. BY REGIONAL, 2019-2035 (USD BILLIONS)
    106. REALITY MARKET SIZE ESTIMATES & FORECAST, BY APPLICATION, 2019-2035 (USD BILLIONS)
    107. FORECAST, BY DEVICE TYPE, 2019-2035 (USD BILLIONS)
    108. REALITY MIXED REALITY MARKET SIZE ESTIMATES & FORECAST, BY TECHNOLOGY, 2019-2035
    109. (USD BILLIONS)
    110. ESTIMATES & FORECAST, BY END USE, 2019-2035 (USD BILLIONS)
    111. AUGMENTED REALITY MIXED REALITY MARKET SIZE ESTIMATES & FORECAST, BY REGIONAL,
    112. 2035 (USD BILLIONS)
    113. MARKET SIZE ESTIMATES & FORECAST, BY APPLICATION, 2019-2035 (USD BILLIONS)
    114. BY DEVICE TYPE, 2019-2035 (USD BILLIONS)
    115. MIXED REALITY MARKET SIZE ESTIMATES & FORECAST, BY TECHNOLOGY, 2019-2035 (USD
    116. BILLIONS)
    117. & FORECAST, BY END USE, 2019-2035 (USD BILLIONS)
    118. REALITY MIXED REALITY MARKET SIZE ESTIMATES & FORECAST, BY REGIONAL, 2019-2035
    119. (USD BILLIONS)
    120. ESTIMATES & FORECAST, BY APPLICATION, 2019-2035 (USD BILLIONS)
    121. ITALY AUGMENTED REALITY MIXED REALITY MARKET SIZE ESTIMATES & FORECAST, BY DEVICE
    122. TYPE, 2019-2035 (USD BILLIONS)
    123. MARKET SIZE ESTIMATES & FORECAST, BY TECHNOLOGY, 2019-2035 (USD BILLIONS)
    124. BY END USE, 2019-2035 (USD BILLIONS)
    125. REALITY MARKET SIZE ESTIMATES & FORECAST, BY REGIONAL, 2019-2035 (USD BILLIONS)
    126. FORECAST, BY APPLICATION, 2019-2035 (USD BILLIONS)
    127. REALITY MIXED REALITY MARKET SIZE ESTIMATES & FORECAST, BY DEVICE TYPE, 2019-2035
    128. (USD BILLIONS)
    129. ESTIMATES & FORECAST, BY TECHNOLOGY, 2019-2035 (USD BILLIONS)
    130. SPAIN AUGMENTED REALITY MIXED REALITY MARKET SIZE ESTIMATES & FORECAST, BY END
    131. USE, 2019-2035 (USD BILLIONS)
    132. MARKET SIZE ESTIMATES & FORECAST, BY REGIONAL, 2019-2035 (USD BILLIONS)
    133. & FORECAST, BY APPLICATION, 2019-2035 (USD BILLIONS)
    134. EUROPE AUGMENTED REALITY MIXED REALITY MARKET SIZE ESTIMATES & FORECAST, BY
    135. DEVICE TYPE, 2019-2035 (USD BILLIONS)
    136. MIXED REALITY MARKET SIZE ESTIMATES & FORECAST, BY TECHNOLOGY, 2019-2035 (USD
    137. BILLIONS)
    138. SIZE ESTIMATES & FORECAST, BY END USE, 2019-2035 (USD BILLIONS)
    139. REST OF EUROPE AUGMENTED REALITY MIXED REALITY MARKET SIZE ESTIMATES & FORECAST,
    140. BY REGIONAL, 2019-2035 (USD BILLIONS)
    141. REALITY MARKET SIZE ESTIMATES & FORECAST, BY APPLICATION, 2019-2035 (USD BILLIONS)
    142. FORECAST, BY DEVICE TYPE, 2019-2035 (USD BILLIONS)
    143. REALITY MIXED REALITY MARKET SIZE ESTIMATES & FORECAST, BY TECHNOLOGY, 2019-2035
    144. (USD BILLIONS)
    145. ESTIMATES & FORECAST, BY END USE, 2019-2035 (USD BILLIONS)
    146. AUGMENTED REALITY MIXED REALITY MARKET SIZE ESTIMATES & FORECAST, BY REGIONAL,
    147. 2035 (USD BILLIONS)
    148. SIZE ESTIMATES & FORECAST, BY APPLICATION, 2019-2035 (USD BILLIONS)
    149. CHINA AUGMENTED REALITY MIXED REALITY MARKET SIZE ESTIMATES & FORECAST,
    150. BY DEVICE TYPE, 2019-2035 (USD BILLIONS)
    151. MIXED REALITY MARKET SIZE ESTIMATES & FORECAST, BY TECHNOLOGY, 2019-2035 (USD
    152. BILLIONS)
    153. & FORECAST, BY END USE, 2019-2035 (USD BILLIONS)
    154. REALITY MIXED REALITY MARKET SIZE ESTIMATES & FORECAST, BY REGIONAL, 2019-2035
    155. (USD BILLIONS)
    156. ESTIMATES & FORECAST, BY APPLICATION, 2019-2035 (USD BILLIONS)
    157. INDIA AUGMENTED REALITY MIXED REALITY MARKET SIZE ESTIMATES & FORECAST, BY DEVICE
    158. TYPE, 2019-2035 (USD BILLIONS)
    159. MARKET SIZE ESTIMATES & FORECAST, BY TECHNOLOGY, 2019-2035 (USD BILLIONS)
    160. BY END USE, 2019-2035 (USD BILLIONS)
    161. REALITY MARKET SIZE ESTIMATES & FORECAST, BY REGIONAL, 2019-2035 (USD BILLIONS)
    162. FORECAST, BY APPLICATION, 2019-2035 (USD BILLIONS)
    163. REALITY MIXED REALITY MARKET SIZE ESTIMATES & FORECAST, BY DEVICE TYPE, 2019-2035
    164. (USD BILLIONS)
    165. ESTIMATES & FORECAST, BY TECHNOLOGY, 2019-2035 (USD BILLIONS)
    166. JAPAN AUGMENTED REALITY MIXED REALITY MARKET SIZE ESTIMATES & FORECAST, BY END
    167. USE, 2019-2035 (USD BILLIONS)
    168. MARKET SIZE ESTIMATES & FORECAST, BY REGIONAL, 2019-2035 (USD BILLIONS)
    169. FORECAST, BY APPLICATION, 2019-2035 (USD BILLIONS)
    170. REALITY MIXED REALITY MARKET SIZE ESTIMATES & FORECAST, BY DEVICE TYPE, 2019-2035
    171. (USD BILLIONS)
    172. SIZE ESTIMATES & FORECAST, BY TECHNOLOGY, 2019-2035 (USD BILLIONS)
    173. SOUTH KOREA AUGMENTED REALITY MIXED REALITY MARKET SIZE ESTIMATES & FORECAST,
    174. BY END USE, 2019-2035 (USD BILLIONS)
    175. MIXED REALITY MARKET SIZE ESTIMATES & FORECAST, BY REGIONAL, 2019-2035 (USD
    176. BILLIONS)
    177. & FORECAST, BY APPLICATION, 2019-2035 (USD BILLIONS)
    178. AUGMENTED REALITY MIXED REALITY MARKET SIZE ESTIMATES & FORECAST, BY DEVICE
    179. TYPE, 2019-2035 (USD BILLIONS)
    180. REALITY MARKET SIZE ESTIMATES & FORECAST, BY TECHNOLOGY, 2019-2035 (USD BILLIONS)
    181. FORECAST, BY END USE, 2019-2035 (USD BILLIONS)
    182. REALITY MIXED REALITY MARKET SIZE ESTIMATES & FORECAST, BY REGIONAL, 2019-2035
    183. (USD BILLIONS)
    184. ESTIMATES & FORECAST, BY APPLICATION, 2019-2035 (USD BILLIONS)
    185. THAILAND AUGMENTED REALITY MIXED REALITY MARKET SIZE ESTIMATES & FORECAST, BY
    186. DEVICE TYPE, 2019-2035 (USD BILLIONS)
    187. MIXED REALITY MARKET SIZE ESTIMATES & FORECAST, BY TECHNOLOGY, 2019-2035 (USD
    188. BILLIONS)
    189. & FORECAST, BY END USE, 2019-2035 (USD BILLIONS)
    190. REALITY MIXED REALITY MARKET SIZE ESTIMATES & FORECAST, BY REGIONAL, 2019-2035
    191. (USD BILLIONS)
    192. SIZE ESTIMATES & FORECAST, BY APPLICATION, 2019-2035 (USD BILLIONS)
    193. INDONESIA AUGMENTED REALITY MIXED REALITY MARKET SIZE ESTIMATES & FORECAST,
    194. BY DEVICE TYPE, 2019-2035 (USD BILLIONS)
    195. MIXED REALITY MARKET SIZE ESTIMATES & FORECAST, BY TECHNOLOGY, 2019-2035 (USD
    196. BILLIONS)
    197. ESTIMATES & FORECAST, BY END USE, 2019-2035 (USD BILLIONS)
    198. AUGMENTED REALITY MIXED REALITY MARKET SIZE ESTIMATES & FORECAST, BY REGIONAL,
    199. 2035 (USD BILLIONS)
    200. MARKET SIZE ESTIMATES & FORECAST, BY APPLICATION, 2019-2035 (USD BILLIONS)
    201. FORECAST, BY DEVICE TYPE, 2019-2035 (USD BILLIONS)
    202. AUGMENTED REALITY MIXED REALITY MARKET SIZE ESTIMATES & FORECAST, BY TECHNOLOGY,
    203. 2035 (USD BILLIONS)
    204. MARKET SIZE ESTIMATES & FORECAST, BY END USE, 2019-2035 (USD BILLIONS)
    205. REST OF APAC AUGMENTED REALITY MIXED REALITY MARKET SIZE ESTIMATES & FORECAST,
    206. BY REGIONAL, 2019-2035 (USD BILLIONS)
    207. MIXED REALITY MARKET SIZE ESTIMATES & FORECAST, BY APPLICATION, 2019-2035 (USD
    208. BILLIONS)
    209. SIZE ESTIMATES & FORECAST, BY DEVICE TYPE, 2019-2035 (USD BILLIONS)
    210. SOUTH AMERICA AUGMENTED REALITY MIXED REALITY MARKET SIZE ESTIMATES & FORECAST,
    211. BY TECHNOLOGY, 2019-2035 (USD BILLIONS)
    212. REALITY MIXED REALITY MARKET SIZE ESTIMATES & FORECAST, BY END USE, 2019-2035
    213. (USD BILLIONS)
    214. SIZE ESTIMATES & FORECAST, BY REGIONAL, 2019-2035 (USD BILLIONS)
    215. BRAZIL AUGMENTED REALITY MIXED REALITY MARKET SIZE ESTIMATES & FORECAST,
    216. BY APPLICATION, 2019-2035 (USD BILLIONS)
    217. MIXED REALITY MARKET SIZE ESTIMATES & FORECAST, BY DEVICE TYPE, 2019-2035 (USD
    218. BILLIONS)
    219. & FORECAST, BY TECHNOLOGY, 2019-2035 (USD BILLIONS)
    220. AUGMENTED REALITY MIXED REALITY MARKET SIZE ESTIMATES & FORECAST, BY END USE,
    221. 2035 (USD BILLIONS)
    222. MARKET SIZE ESTIMATES & FORECAST, BY REGIONAL, 2019-2035 (USD BILLIONS)
    223. FORECAST, BY APPLICATION, 2019-2035 (USD BILLIONS)
    224. REALITY MIXED REALITY MARKET SIZE ESTIMATES & FORECAST, BY DEVICE TYPE, 2019-2035
    225. (USD BILLIONS)
    226. ESTIMATES & FORECAST, BY TECHNOLOGY, 2019-2035 (USD BILLIONS)
    227. MEXICO AUGMENTED REALITY MIXED REALITY MARKET SIZE ESTIMATES & FORECAST, BY
    228. END USE, 2019-2035 (USD BILLIONS)
    229. REALITY MARKET SIZE ESTIMATES & FORECAST, BY REGIONAL, 2019-2035 (USD BILLIONS)
    230. & FORECAST, BY APPLICATION, 2019-2035 (USD BILLIONS)
    231. AUGMENTED REALITY MIXED REALITY MARKET SIZE ESTIMATES & FORECAST, BY DEVICE
    232. TYPE, 2019-2035 (USD BILLIONS)
    233. REALITY MARKET SIZE ESTIMATES & FORECAST, BY TECHNOLOGY, 2019-2035 (USD BILLIONS)
    234. & FORECAST, BY END USE, 2019-2035 (USD BILLIONS)
    235. AUGMENTED REALITY MIXED REALITY MARKET SIZE ESTIMATES & FORECAST, BY REGIONAL,
    236. 2035 (USD BILLIONS)
    237. MIXED REALITY MARKET SIZE ESTIMATES & FORECAST, BY APPLICATION, 2019-2035 (USD
    238. BILLIONS)
    239. MARKET SIZE ESTIMATES & FORECAST, BY DEVICE TYPE, 2019-2035 (USD BILLIONS)
    240. & FORECAST, BY TECHNOLOGY, 2019-2035 (USD BILLIONS)
    241. SOUTH AMERICA AUGMENTED REALITY MIXED REALITY MARKET SIZE ESTIMATES & FORECAST,
    242. BY END USE, 2019-2035 (USD BILLIONS)
    243. REALITY MIXED REALITY MARKET SIZE ESTIMATES & FORECAST, BY REGIONAL, 2019-2035
    244. (USD BILLIONS)
    245. ESTIMATES & FORECAST, BY APPLICATION, 2019-2035 (USD BILLIONS)
    246. MEA AUGMENTED REALITY MIXED REALITY MARKET SIZE ESTIMATES & FORECAST, BY DEVICE
    247. TYPE, 2019-2035 (USD BILLIONS)
    248. MARKET SIZE ESTIMATES & FORECAST, BY TECHNOLOGY, 2019-2035 (USD BILLIONS)
    249. BY END USE, 2019-2035 (USD BILLIONS)
    250. REALITY MARKET SIZE ESTIMATES & FORECAST, BY REGIONAL, 2019-2035 (USD BILLIONS)
    251. & FORECAST, BY APPLICATION, 2019-2035 (USD BILLIONS)
    252. AUGMENTED REALITY MIXED REALITY MARKET SIZE ESTIMATES & FORECAST, BY DEVICE
    253. TYPE, 2019-2035 (USD BILLIONS)
    254. MIXED REALITY MARKET SIZE ESTIMATES & FORECAST, BY TECHNOLOGY, 2019-2035 (USD
    255. BILLIONS)
    256. SIZE ESTIMATES & FORECAST, BY END USE, 2019-2035 (USD BILLIONS)
    257. GCC COUNTRIES AUGMENTED REALITY MIXED REALITY MARKET SIZE ESTIMATES & FORECAST,
    258. BY REGIONAL, 2019-2035 (USD BILLIONS)
    259. MIXED REALITY MARKET SIZE ESTIMATES & FORECAST, BY APPLICATION, 2019-2035 (USD
    260. BILLIONS)
    261. ESTIMATES & FORECAST, BY DEVICE TYPE, 2019-2035 (USD BILLIONS)
    262. SOUTH AFRICA AUGMENTED REALITY MIXED REALITY MARKET SIZE ESTIMATES & FORECAST,
    263. BY TECHNOLOGY, 2019-2035 (USD BILLIONS)
    264. REALITY MIXED REALITY MARKET SIZE ESTIMATES & FORECAST, BY END USE, 2019-2035
    265. (USD BILLIONS)
    266. SIZE ESTIMATES & FORECAST, BY REGIONAL, 2019-2035 (USD BILLIONS)
    267. REST OF MEA AUGMENTED REALITY MIXED REALITY MARKET SIZE ESTIMATES & FORECAST,
    268. BY APPLICATION, 2019-2035 (USD BILLIONS)
    269. REALITY MIXED REALITY MARKET SIZE ESTIMATES & FORECAST, BY DEVICE TYPE, 2019-2035
    270. (USD BILLIONS)
    271. SIZE ESTIMATES & FORECAST, BY TECHNOLOGY, 2019-2035 (USD BILLIONS)
    272. REST OF MEA AUGMENTED REALITY MIXED REALITY MARKET SIZE ESTIMATES & FORECAST,
    273. BY END USE, 2019-2035 (USD BILLIONS)
    274. MIXED REALITY MARKET SIZE ESTIMATES & FORECAST, BY REGIONAL, 2019-2035 (USD
    275. BILLIONS)
    276. ACQUISITION/PARTNERSHIP
    277. MARKET SYNOPSIS
    278. ANALYSIS
    279. CANADA AUGMENTED REALITY MIXED REALITY MARKET ANALYSIS BY APPLICATION
    280. CANADA AUGMENTED REALITY MIXED REALITY MARKET ANALYSIS BY DEVICE TYPE
    281. CANADA AUGMENTED REALITY MIXED REALITY MARKET ANALYSIS BY TECHNOLOGY
    282. CANADA AUGMENTED REALITY MIXED REALITY MARKET ANALYSIS BY END USE
    283. CANADA AUGMENTED REALITY MIXED REALITY MARKET ANALYSIS BY REGIONAL
    284. EUROPE AUGMENTED REALITY MIXED REALITY MARKET ANALYSIS
    285. AUGMENTED REALITY MIXED REALITY MARKET ANALYSIS BY APPLICATION
    286. GERMANY AUGMENTED REALITY MIXED REALITY MARKET ANALYSIS BY DEVICE TYPE
    287. GERMANY AUGMENTED REALITY MIXED REALITY MARKET ANALYSIS BY TECHNOLOGY
    288. GERMANY AUGMENTED REALITY MIXED REALITY MARKET ANALYSIS BY END USE
    289. GERMANY AUGMENTED REALITY MIXED REALITY MARKET ANALYSIS BY REGIONAL
    290. UK AUGMENTED REALITY MIXED REALITY MARKET ANALYSIS BY APPLICATION
    291. UK AUGMENTED REALITY MIXED REALITY MARKET ANALYSIS BY DEVICE TYPE
    292. UK AUGMENTED REALITY MIXED REALITY MARKET ANALYSIS BY TECHNOLOGY
    293. UK AUGMENTED REALITY MIXED REALITY MARKET ANALYSIS BY END USE
    294. UK AUGMENTED REALITY MIXED REALITY MARKET ANALYSIS BY REGIONAL
    295. FRANCE AUGMENTED REALITY MIXED REALITY MARKET ANALYSIS BY APPLICATION
    296. FRANCE AUGMENTED REALITY MIXED REALITY MARKET ANALYSIS BY DEVICE TYPE
    297. FRANCE AUGMENTED REALITY MIXED REALITY MARKET ANALYSIS BY TECHNOLOGY
    298. FRANCE AUGMENTED REALITY MIXED REALITY MARKET ANALYSIS BY END USE
    299. FRANCE AUGMENTED REALITY MIXED REALITY MARKET ANALYSIS BY REGIONAL
    300. RUSSIA AUGMENTED REALITY MIXED REALITY MARKET ANALYSIS BY APPLICATION
    301. RUSSIA AUGMENTED REALITY MIXED REALITY MARKET ANALYSIS BY DEVICE TYPE
    302. RUSSIA AUGMENTED REALITY MIXED REALITY MARKET ANALYSIS BY TECHNOLOGY
    303. RUSSIA AUGMENTED REALITY MIXED REALITY MARKET ANALYSIS BY END USE
    304. RUSSIA AUGMENTED REALITY MIXED REALITY MARKET ANALYSIS BY REGIONAL
    305. ITALY AUGMENTED REALITY MIXED REALITY MARKET ANALYSIS BY APPLICATION
    306. ITALY AUGMENTED REALITY MIXED REALITY MARKET ANALYSIS BY DEVICE TYPE
    307. ITALY AUGMENTED REALITY MIXED REALITY MARKET ANALYSIS BY TECHNOLOGY
    308. ITALY AUGMENTED REALITY MIXED REALITY MARKET ANALYSIS BY END USE
    309. ITALY AUGMENTED REALITY MIXED REALITY MARKET ANALYSIS BY REGIONAL
    310. SPAIN AUGMENTED REALITY MIXED REALITY MARKET ANALYSIS BY APPLICATION
    311. SPAIN AUGMENTED REALITY MIXED REALITY MARKET ANALYSIS BY DEVICE TYPE
    312. SPAIN AUGMENTED REALITY MIXED REALITY MARKET ANALYSIS BY TECHNOLOGY
    313. SPAIN AUGMENTED REALITY MIXED REALITY MARKET ANALYSIS BY END USE
    314. SPAIN AUGMENTED REALITY MIXED REALITY MARKET ANALYSIS BY REGIONAL
    315. REST OF EUROPE AUGMENTED REALITY MIXED REALITY MARKET ANALYSIS BY APPLICATION
    316. BY DEVICE TYPE
    317. ANALYSIS BY TECHNOLOGY
    318. MARKET ANALYSIS BY END USE
    319. REALITY MARKET ANALYSIS BY REGIONAL
    320. REALITY MARKET ANALYSIS
    321. ANALYSIS BY APPLICATION
    322. ANALYSIS BY DEVICE TYPE
    323. ANALYSIS BY TECHNOLOGY
    324. ANALYSIS BY END USE
    325. ANALYSIS BY REGIONAL
    326. ANALYSIS BY APPLICATION
    327. ANALYSIS BY DEVICE TYPE
    328. ANALYSIS BY TECHNOLOGY
    329. ANALYSIS BY END USE
    330. ANALYSIS BY REGIONAL
    331. ANALYSIS BY APPLICATION
    332. ANALYSIS BY DEVICE TYPE
    333. ANALYSIS BY TECHNOLOGY
    334. ANALYSIS BY END USE
    335. ANALYSIS BY REGIONAL
    336. MARKET ANALYSIS BY APPLICATION
    337. REALITY MARKET ANALYSIS BY DEVICE TYPE
    338. MIXED REALITY MARKET ANALYSIS BY TECHNOLOGY
    339. REALITY MIXED REALITY MARKET ANALYSIS BY END USE
    340. REALITY MIXED REALITY MARKET ANALYSIS BY REGIONAL
    341. REALITY MIXED REALITY MARKET ANALYSIS BY APPLICATION
    342. REALITY MIXED REALITY MARKET ANALYSIS BY DEVICE TYPE
    343. REALITY MIXED REALITY MARKET ANALYSIS BY TECHNOLOGY
    344. REALITY MIXED REALITY MARKET ANALYSIS BY END USE
    345. REALITY MIXED REALITY MARKET ANALYSIS BY REGIONAL
    346. REALITY MIXED REALITY MARKET ANALYSIS BY APPLICATION
    347. REALITY MIXED REALITY MARKET ANALYSIS BY DEVICE TYPE
    348. REALITY MIXED REALITY MARKET ANALYSIS BY TECHNOLOGY
    349. REALITY MIXED REALITY MARKET ANALYSIS BY END USE
    350. REALITY MIXED REALITY MARKET ANALYSIS BY REGIONAL
    351. REALITY MIXED REALITY MARKET ANALYSIS BY APPLICATION
    352. AUGMENTED REALITY MIXED REALITY MARKET ANALYSIS BY DEVICE TYPE
    353. INDONESIA AUGMENTED REALITY MIXED REALITY MARKET ANALYSIS BY TECHNOLOGY
    354. INDONESIA AUGMENTED REALITY MIXED REALITY MARKET ANALYSIS BY END USE
    355. INDONESIA AUGMENTED REALITY MIXED REALITY MARKET ANALYSIS BY REGIONAL
    356. REST OF APAC AUGMENTED REALITY MIXED REALITY MARKET ANALYSIS BY APPLICATION
    357. DEVICE TYPE
    358. ANALYSIS BY TECHNOLOGY
    359. MARKET ANALYSIS BY END USE
    360. REALITY MARKET ANALYSIS BY REGIONAL
    361. MIXED REALITY MARKET ANALYSIS
    362. MARKET ANALYSIS BY APPLICATION
    363. MARKET ANALYSIS BY DEVICE TYPE
    364. MARKET ANALYSIS BY TECHNOLOGY
    365. MARKET ANALYSIS BY END USE
    366. MARKET ANALYSIS BY REGIONAL
    367. MARKET ANALYSIS BY APPLICATION
    368. MARKET ANALYSIS BY DEVICE TYPE
    369. MARKET ANALYSIS BY TECHNOLOGY
    370. MARKET ANALYSIS BY END USE
    371. MARKET ANALYSIS BY REGIONAL
    372. REALITY MARKET ANALYSIS BY APPLICATION
    373. MIXED REALITY MARKET ANALYSIS BY DEVICE TYPE
    374. REALITY MIXED REALITY MARKET ANALYSIS BY TECHNOLOGY
    375. AUGMENTED REALITY MIXED REALITY MARKET ANALYSIS BY END USE
    376. AUGMENTED REALITY MIXED REALITY MARKET ANALYSIS BY REGIONAL
    377. OF SOUTH AMERICA AUGMENTED REALITY MIXED REALITY MARKET ANALYSIS BY APPLICATION
    378. BY DEVICE TYPE
    379. MARKET ANALYSIS BY TECHNOLOGY
    380. REALITY MIXED REALITY MARKET ANALYSIS BY END USE
    381. AMERICA AUGMENTED REALITY MIXED REALITY MARKET ANALYSIS BY REGIONAL
    382. MEA AUGMENTED REALITY MIXED REALITY MARKET ANALYSIS
    383. AUGMENTED REALITY MIXED REALITY MARKET ANALYSIS BY APPLICATION
    384. GCC COUNTRIES AUGMENTED REALITY MIXED REALITY MARKET ANALYSIS BY DEVICE TYPE
    385. BY END USE
    386. ANALYSIS BY REGIONAL
    387. MARKET ANALYSIS BY APPLICATION
    388. MIXED REALITY MARKET ANALYSIS BY DEVICE TYPE
    389. REALITY MIXED REALITY MARKET ANALYSIS BY TECHNOLOGY
    390. AUGMENTED REALITY MIXED REALITY MARKET ANALYSIS BY END USE
    391. AFRICA AUGMENTED REALITY MIXED REALITY MARKET ANALYSIS BY REGIONAL
    392. REST OF MEA AUGMENTED REALITY MIXED REALITY MARKET ANALYSIS BY APPLICATION
    393. DEVICE TYPE
    394. ANALYSIS BY TECHNOLOGY
    395. MARKET ANALYSIS BY END USE
    396. REALITY MARKET ANALYSIS BY REGIONAL
    397. REALITY MIXED REALITY MARKET
    398. DRO ANALYSIS OF AUGMENTED REALITY MIXED REALITY MARKET
    399. IMPACT ANALYSIS: AUGMENTED REALITY MIXED REALITY MARKET
    400. IMPACT ANALYSIS: AUGMENTED REALITY MIXED REALITY MARKET
    401. / VALUE CHAIN: AUGMENTED REALITY MIXED REALITY MARKET
    402. REALITY MIXED REALITY MARKET, BY APPLICATION, 2024 (% SHARE)
    403. REALITY MIXED REALITY MARKET, BY APPLICATION, 2019 TO 2035 (USD Billions)
    404. AUGMENTED REALITY MIXED REALITY MARKET, BY DEVICE TYPE, 2024 (% SHARE)
    405. (USD Billions)
    406. (% SHARE)
    407. TO 2035 (USD Billions)
    408. BY END USE, 2024 (% SHARE)
    409. BY END USE, 2019 TO 2035 (USD Billions)
    410. REALITY MARKET, BY REGIONAL, 2024 (% SHARE)
    411. MIXED REALITY MARKET, BY REGIONAL, 2019 TO 2035 (USD Billions)
    412. BENCHMARKING OF MAJOR COMPETITORS'

    Augmented Reality Mixed Reality Market Segmentation


    • Augmented Reality Mixed Reality Market By Application (USD Billion, 2019-2035)
      • Gaming
      • Healthcare
      • Education
      • Retail
      • Military


    • Augmented Reality Mixed Reality Market By Device Type (USD Billion, 2019-2035)
      • Smartphone
      • Tablet
      • Smart Glasses
      • Head-Mounted Displays
      • Projectors


    • Augmented Reality Mixed Reality Market By Technology (USD Billion, 2019-2035)
      • Marker-Based
      • Marker-Less
      • Projection-Based
      • Superimposition-Based


    • Augmented Reality Mixed Reality Market By End Use (USD Billion, 2019-2035)
      • Consumer
      • Enterprise
      • Government


    • Augmented Reality Mixed Reality Market By Regional (USD Billion, 2019-2035)
      • North America
      • Europe
      • South America
      • Asia Pacific
      • Middle East and Africa


    Augmented Reality Mixed Reality Market Regional Outlook (USD Billion, 2019-2035)


    • North America Outlook (USD Billion, 2019-2035)
      • North America Augmented Reality Mixed Reality Market by Application Type
        • Gaming
        • Healthcare
        • Education
        • Retail
        • Military
      • North America Augmented Reality Mixed Reality Market by Device Type
        • Smartphone
        • Tablet
        • Smart Glasses
        • Head-Mounted Displays
        • Projectors
      • North America Augmented Reality Mixed Reality Market by Technology Type
        • Marker-Based
        • Marker-Less
        • Projection-Based
        • Superimposition-Based
      • North America Augmented Reality Mixed Reality Market by End Use Type
        • Consumer
        • Enterprise
        • Government
      • North America Augmented Reality Mixed Reality Market by Regional Type
        • US
        • Canada
      • US Outlook (USD Billion, 2019-2035)
      • US Augmented Reality Mixed Reality Market by Application Type
        • Gaming
        • Healthcare
        • Education
        • Retail
        • Military
      • US Augmented Reality Mixed Reality Market by Device Type
        • Smartphone
        • Tablet
        • Smart Glasses
        • Head-Mounted Displays
        • Projectors
      • US Augmented Reality Mixed Reality Market by Technology Type
        • Marker-Based
        • Marker-Less
        • Projection-Based
        • Superimposition-Based
      • US Augmented Reality Mixed Reality Market by End Use Type
        • Consumer
        • Enterprise
        • Government
      • CANADA Outlook (USD Billion, 2019-2035)
      • CANADA Augmented Reality Mixed Reality Market by Application Type
        • Gaming
        • Healthcare
        • Education
        • Retail
        • Military
      • CANADA Augmented Reality Mixed Reality Market by Device Type
        • Smartphone
        • Tablet
        • Smart Glasses
        • Head-Mounted Displays
        • Projectors
      • CANADA Augmented Reality Mixed Reality Market by Technology Type
        • Marker-Based
        • Marker-Less
        • Projection-Based
        • Superimposition-Based
      • CANADA Augmented Reality Mixed Reality Market by End Use Type
        • Consumer
        • Enterprise
        • Government
      • Europe Outlook (USD Billion, 2019-2035)
        • Europe Augmented Reality Mixed Reality Market by Application Type
          • Gaming
          • Healthcare
          • Education
          • Retail
          • Military
        • Europe Augmented Reality Mixed Reality Market by Device Type
          • Smartphone
          • Tablet
          • Smart Glasses
          • Head-Mounted Displays
          • Projectors
        • Europe Augmented Reality Mixed Reality Market by Technology Type
          • Marker-Based
          • Marker-Less
          • Projection-Based
          • Superimposition-Based
        • Europe Augmented Reality Mixed Reality Market by End Use Type
          • Consumer
          • Enterprise
          • Government
        • Europe Augmented Reality Mixed Reality Market by Regional Type
          • Germany
          • UK
          • France
          • Russia
          • Italy
          • Spain
          • Rest of Europe
        • GERMANY Outlook (USD Billion, 2019-2035)
        • GERMANY Augmented Reality Mixed Reality Market by Application Type
          • Gaming
          • Healthcare
          • Education
          • Retail
          • Military
        • GERMANY Augmented Reality Mixed Reality Market by Device Type
          • Smartphone
          • Tablet
          • Smart Glasses
          • Head-Mounted Displays
          • Projectors
        • GERMANY Augmented Reality Mixed Reality Market by Technology Type
          • Marker-Based
          • Marker-Less
          • Projection-Based
          • Superimposition-Based
        • GERMANY Augmented Reality Mixed Reality Market by End Use Type
          • Consumer
          • Enterprise
          • Government
        • UK Outlook (USD Billion, 2019-2035)
        • UK Augmented Reality Mixed Reality Market by Application Type
          • Gaming
          • Healthcare
          • Education
          • Retail
          • Military
        • UK Augmented Reality Mixed Reality Market by Device Type
          • Smartphone
          • Tablet
          • Smart Glasses
          • Head-Mounted Displays
          • Projectors
        • UK Augmented Reality Mixed Reality Market by Technology Type
          • Marker-Based
          • Marker-Less
          • Projection-Based
          • Superimposition-Based
        • UK Augmented Reality Mixed Reality Market by End Use Type
          • Consumer
          • Enterprise
          • Government
        • FRANCE Outlook (USD Billion, 2019-2035)
        • FRANCE Augmented Reality Mixed Reality Market by Application Type
          • Gaming
          • Healthcare
          • Education
          • Retail
          • Military
        • FRANCE Augmented Reality Mixed Reality Market by Device Type
          • Smartphone
          • Tablet
          • Smart Glasses
          • Head-Mounted Displays
          • Projectors
        • FRANCE Augmented Reality Mixed Reality Market by Technology Type
          • Marker-Based
          • Marker-Less
          • Projection-Based
          • Superimposition-Based
        • FRANCE Augmented Reality Mixed Reality Market by End Use Type
          • Consumer
          • Enterprise
          • Government
        • RUSSIA Outlook (USD Billion, 2019-2035)
        • RUSSIA Augmented Reality Mixed Reality Market by Application Type
          • Gaming
          • Healthcare
          • Education
          • Retail
          • Military
        • RUSSIA Augmented Reality Mixed Reality Market by Device Type
          • Smartphone
          • Tablet
          • Smart Glasses
          • Head-Mounted Displays
          • Projectors
        • RUSSIA Augmented Reality Mixed Reality Market by Technology Type
          • Marker-Based
          • Marker-Less
          • Projection-Based
          • Superimposition-Based
        • RUSSIA Augmented Reality Mixed Reality Market by End Use Type
          • Consumer
          • Enterprise
          • Government
        • ITALY Outlook (USD Billion, 2019-2035)
        • ITALY Augmented Reality Mixed Reality Market by Application Type
          • Gaming
          • Healthcare
          • Education
          • Retail
          • Military
        • ITALY Augmented Reality Mixed Reality Market by Device Type
          • Smartphone
          • Tablet
          • Smart Glasses
          • Head-Mounted Displays
          • Projectors
        • ITALY Augmented Reality Mixed Reality Market by Technology Type
          • Marker-Based
          • Marker-Less
          • Projection-Based
          • Superimposition-Based
        • ITALY Augmented Reality Mixed Reality Market by End Use Type
          • Consumer
          • Enterprise
          • Government
        • SPAIN Outlook (USD Billion, 2019-2035)
        • SPAIN Augmented Reality Mixed Reality Market by Application Type
          • Gaming
          • Healthcare
          • Education
          • Retail
          • Military
        • SPAIN Augmented Reality Mixed Reality Market by Device Type
          • Smartphone
          • Tablet
          • Smart Glasses
          • Head-Mounted Displays
          • Projectors
        • SPAIN Augmented Reality Mixed Reality Market by Technology Type
          • Marker-Based
          • Marker-Less
          • Projection-Based
          • Superimposition-Based
        • SPAIN Augmented Reality Mixed Reality Market by End Use Type
          • Consumer
          • Enterprise
          • Government
        • REST OF EUROPE Outlook (USD Billion, 2019-2035)
        • REST OF EUROPE Augmented Reality Mixed Reality Market by Application Type
          • Gaming
          • Healthcare
          • Education
          • Retail
          • Military
        • REST OF EUROPE Augmented Reality Mixed Reality Market by Device Type
          • Smartphone
          • Tablet
          • Smart Glasses
          • Head-Mounted Displays
          • Projectors
        • REST OF EUROPE Augmented Reality Mixed Reality Market by Technology Type
          • Marker-Based
          • Marker-Less
          • Projection-Based
          • Superimposition-Based
        • REST OF EUROPE Augmented Reality Mixed Reality Market by End Use Type
          • Consumer
          • Enterprise
          • Government
        • APAC Outlook (USD Billion, 2019-2035)
          • APAC Augmented Reality Mixed Reality Market by Application Type
            • Gaming
            • Healthcare
            • Education
            • Retail
            • Military
          • APAC Augmented Reality Mixed Reality Market by Device Type
            • Smartphone
            • Tablet
            • Smart Glasses
            • Head-Mounted Displays
            • Projectors
          • APAC Augmented Reality Mixed Reality Market by Technology Type
            • Marker-Based
            • Marker-Less
            • Projection-Based
            • Superimposition-Based
          • APAC Augmented Reality Mixed Reality Market by End Use Type
            • Consumer
            • Enterprise
            • Government
          • APAC Augmented Reality Mixed Reality Market by Regional Type
            • China
            • India
            • Japan
            • South Korea
            • Malaysia
            • Thailand
            • Indonesia
            • Rest of APAC
          • CHINA Outlook (USD Billion, 2019-2035)
          • CHINA Augmented Reality Mixed Reality Market by Application Type
            • Gaming
            • Healthcare
            • Education
            • Retail
            • Military
          • CHINA Augmented Reality Mixed Reality Market by Device Type
            • Smartphone
            • Tablet
            • Smart Glasses
            • Head-Mounted Displays
            • Projectors
          • CHINA Augmented Reality Mixed Reality Market by Technology Type
            • Marker-Based
            • Marker-Less
            • Projection-Based
            • Superimposition-Based
          • CHINA Augmented Reality Mixed Reality Market by End Use Type
            • Consumer
            • Enterprise
            • Government
          • INDIA Outlook (USD Billion, 2019-2035)
          • INDIA Augmented Reality Mixed Reality Market by Application Type
            • Gaming
            • Healthcare
            • Education
            • Retail
            • Military
          • INDIA Augmented Reality Mixed Reality Market by Device Type
            • Smartphone
            • Tablet
            • Smart Glasses
            • Head-Mounted Displays
            • Projectors
          • INDIA Augmented Reality Mixed Reality Market by Technology Type
            • Marker-Based
            • Marker-Less
            • Projection-Based
            • Superimposition-Based
          • INDIA Augmented Reality Mixed Reality Market by End Use Type
            • Consumer
            • Enterprise
            • Government
          • JAPAN Outlook (USD Billion, 2019-2035)
          • JAPAN Augmented Reality Mixed Reality Market by Application Type
            • Gaming
            • Healthcare
            • Education
            • Retail
            • Military
          • JAPAN Augmented Reality Mixed Reality Market by Device Type
            • Smartphone
            • Tablet
            • Smart Glasses
            • Head-Mounted Displays
            • Projectors
          • JAPAN Augmented Reality Mixed Reality Market by Technology Type
            • Marker-Based
            • Marker-Less
            • Projection-Based
            • Superimposition-Based
          • JAPAN Augmented Reality Mixed Reality Market by End Use Type
            • Consumer
            • Enterprise
            • Government
          • SOUTH KOREA Outlook (USD Billion, 2019-2035)
          • SOUTH KOREA Augmented Reality Mixed Reality Market by Application Type
            • Gaming
            • Healthcare
            • Education
            • Retail
            • Military
          • SOUTH KOREA Augmented Reality Mixed Reality Market by Device Type
            • Smartphone
            • Tablet
            • Smart Glasses
            • Head-Mounted Displays
            • Projectors
          • SOUTH KOREA Augmented Reality Mixed Reality Market by Technology Type
            • Marker-Based
            • Marker-Less
            • Projection-Based
            • Superimposition-Based
          • SOUTH KOREA Augmented Reality Mixed Reality Market by End Use Type
            • Consumer
            • Enterprise
            • Government
          • MALAYSIA Outlook (USD Billion, 2019-2035)
          • MALAYSIA Augmented Reality Mixed Reality Market by Application Type
            • Gaming
            • Healthcare
            • Education
            • Retail
            • Military
          • MALAYSIA Augmented Reality Mixed Reality Market by Device Type
            • Smartphone
            • Tablet
            • Smart Glasses
            • Head-Mounted Displays
            • Projectors
          • MALAYSIA Augmented Reality Mixed Reality Market by Technology Type
            • Marker-Based
            • Marker-Less
            • Projection-Based
            • Superimposition-Based
          • MALAYSIA Augmented Reality Mixed Reality Market by End Use Type
            • Consumer
            • Enterprise
            • Government
          • THAILAND Outlook (USD Billion, 2019-2035)
          • THAILAND Augmented Reality Mixed Reality Market by Application Type
            • Gaming
            • Healthcare
            • Education
            • Retail
            • Military
          • THAILAND Augmented Reality Mixed Reality Market by Device Type
            • Smartphone
            • Tablet
            • Smart Glasses
            • Head-Mounted Displays
            • Projectors
          • THAILAND Augmented Reality Mixed Reality Market by Technology Type
            • Marker-Based
            • Marker-Less
            • Projection-Based
            • Superimposition-Based
          • THAILAND Augmented Reality Mixed Reality Market by End Use Type
            • Consumer
            • Enterprise
            • Government
          • INDONESIA Outlook (USD Billion, 2019-2035)
          • INDONESIA Augmented Reality Mixed Reality Market by Application Type
            • Gaming
            • Healthcare
            • Education
            • Retail
            • Military
          • INDONESIA Augmented Reality Mixed Reality Market by Device Type
            • Smartphone
            • Tablet
            • Smart Glasses
            • Head-Mounted Displays
            • Projectors
          • INDONESIA Augmented Reality Mixed Reality Market by Technology Type
            • Marker-Based
            • Marker-Less
            • Projection-Based
            • Superimposition-Based
          • INDONESIA Augmented Reality Mixed Reality Market by End Use Type
            • Consumer
            • Enterprise
            • Government
          • REST OF APAC Outlook (USD Billion, 2019-2035)
          • REST OF APAC Augmented Reality Mixed Reality Market by Application Type
            • Gaming
            • Healthcare
            • Education
            • Retail
            • Military
          • REST OF APAC Augmented Reality Mixed Reality Market by Device Type
            • Smartphone
            • Tablet
            • Smart Glasses
            • Head-Mounted Displays
            • Projectors
          • REST OF APAC Augmented Reality Mixed Reality Market by Technology Type
            • Marker-Based
            • Marker-Less
            • Projection-Based
            • Superimposition-Based
          • REST OF APAC Augmented Reality Mixed Reality Market by End Use Type
            • Consumer
            • Enterprise
            • Government
          • South America Outlook (USD Billion, 2019-2035)
            • South America Augmented Reality Mixed Reality Market by Application Type
              • Gaming
              • Healthcare
              • Education
              • Retail
              • Military
            • South America Augmented Reality Mixed Reality Market by Device Type
              • Smartphone
              • Tablet
              • Smart Glasses
              • Head-Mounted Displays
              • Projectors
            • South America Augmented Reality Mixed Reality Market by Technology Type
              • Marker-Based
              • Marker-Less
              • Projection-Based
              • Superimposition-Based
            • South America Augmented Reality Mixed Reality Market by End Use Type
              • Consumer
              • Enterprise
              • Government
            • South America Augmented Reality Mixed Reality Market by Regional Type
              • Brazil
              • Mexico
              • Argentina
              • Rest of South America
            • BRAZIL Outlook (USD Billion, 2019-2035)
            • BRAZIL Augmented Reality Mixed Reality Market by Application Type
              • Gaming
              • Healthcare
              • Education
              • Retail
              • Military
            • BRAZIL Augmented Reality Mixed Reality Market by Device Type
              • Smartphone
              • Tablet
              • Smart Glasses
              • Head-Mounted Displays
              • Projectors
            • BRAZIL Augmented Reality Mixed Reality Market by Technology Type
              • Marker-Based
              • Marker-Less
              • Projection-Based
              • Superimposition-Based
            • BRAZIL Augmented Reality Mixed Reality Market by End Use Type
              • Consumer
              • Enterprise
              • Government
            • MEXICO Outlook (USD Billion, 2019-2035)
            • MEXICO Augmented Reality Mixed Reality Market by Application Type
              • Gaming
              • Healthcare
              • Education
              • Retail
              • Military
            • MEXICO Augmented Reality Mixed Reality Market by Device Type
              • Smartphone
              • Tablet
              • Smart Glasses
              • Head-Mounted Displays
              • Projectors
            • MEXICO Augmented Reality Mixed Reality Market by Technology Type
              • Marker-Based
              • Marker-Less
              • Projection-Based
              • Superimposition-Based
            • MEXICO Augmented Reality Mixed Reality Market by End Use Type
              • Consumer
              • Enterprise
              • Government
            • ARGENTINA Outlook (USD Billion, 2019-2035)
            • ARGENTINA Augmented Reality Mixed Reality Market by Application Type
              • Gaming
              • Healthcare
              • Education
              • Retail
              • Military
            • ARGENTINA Augmented Reality Mixed Reality Market by Device Type
              • Smartphone
              • Tablet
              • Smart Glasses
              • Head-Mounted Displays
              • Projectors
            • ARGENTINA Augmented Reality Mixed Reality Market by Technology Type
              • Marker-Based
              • Marker-Less
              • Projection-Based
              • Superimposition-Based
            • ARGENTINA Augmented Reality Mixed Reality Market by End Use Type
              • Consumer
              • Enterprise
              • Government
            • REST OF SOUTH AMERICA Outlook (USD Billion, 2019-2035)
            • REST OF SOUTH AMERICA Augmented Reality Mixed Reality Market by Application Type
              • Gaming
              • Healthcare
              • Education
              • Retail
              • Military
            • REST OF SOUTH AMERICA Augmented Reality Mixed Reality Market by Device Type
              • Smartphone
              • Tablet
              • Smart Glasses
              • Head-Mounted Displays
              • Projectors
            • REST OF SOUTH AMERICA Augmented Reality Mixed Reality Market by Technology Type
              • Marker-Based
              • Marker-Less
              • Projection-Based
              • Superimposition-Based
            • REST OF SOUTH AMERICA Augmented Reality Mixed Reality Market by End Use Type
              • Consumer
              • Enterprise
              • Government
            • MEA Outlook (USD Billion, 2019-2035)
              • MEA Augmented Reality Mixed Reality Market by Application Type
                • Gaming
                • Healthcare
                • Education
                • Retail
                • Military
              • MEA Augmented Reality Mixed Reality Market by Device Type
                • Smartphone
                • Tablet
                • Smart Glasses
                • Head-Mounted Displays
                • Projectors
              • MEA Augmented Reality Mixed Reality Market by Technology Type
                • Marker-Based
                • Marker-Less
                • Projection-Based
                • Superimposition-Based
              • MEA Augmented Reality Mixed Reality Market by End Use Type
                • Consumer
                • Enterprise
                • Government
              • MEA Augmented Reality Mixed Reality Market by Regional Type
                • GCC Countries
                • South Africa
                • Rest of MEA
              • GCC COUNTRIES Outlook (USD Billion, 2019-2035)
              • GCC COUNTRIES Augmented Reality Mixed Reality Market by Application Type
                • Gaming
                • Healthcare
                • Education
                • Retail
                • Military
              • GCC COUNTRIES Augmented Reality Mixed Reality Market by Device Type
                • Smartphone
                • Tablet
                • Smart Glasses
                • Head-Mounted Displays
                • Projectors
              • GCC COUNTRIES Augmented Reality Mixed Reality Market by Technology Type
                • Marker-Based
                • Marker-Less
                • Projection-Based
                • Superimposition-Based
              • GCC COUNTRIES Augmented Reality Mixed Reality Market by End Use Type
                • Consumer
                • Enterprise
                • Government
              • SOUTH AFRICA Outlook (USD Billion, 2019-2035)
              • SOUTH AFRICA Augmented Reality Mixed Reality Market by Application Type
                • Gaming
                • Healthcare
                • Education
                • Retail
                • Military
              • SOUTH AFRICA Augmented Reality Mixed Reality Market by Device Type
                • Smartphone
                • Tablet
                • Smart Glasses
                • Head-Mounted Displays
                • Projectors
              • SOUTH AFRICA Augmented Reality Mixed Reality Market by Technology Type
                • Marker-Based
                • Marker-Less
                • Projection-Based
                • Superimposition-Based
              • SOUTH AFRICA Augmented Reality Mixed Reality Market by End Use Type
                • Consumer
                • Enterprise
                • Government
              • REST OF MEA Outlook (USD Billion, 2019-2035)
              • REST OF MEA Augmented Reality Mixed Reality Market by Application Type
                • Gaming
                • Healthcare
                • Education
                • Retail
                • Military
              • REST OF MEA Augmented Reality Mixed Reality Market by Device Type
                • Smartphone
                • Tablet
                • Smart Glasses
                • Head-Mounted Displays
                • Projectors
              • REST OF MEA Augmented Reality Mixed Reality Market by Technology Type
                • Marker-Based
                • Marker-Less
                • Projection-Based
                • Superimposition-Based
              • REST OF MEA Augmented Reality Mixed Reality Market by End Use Type
                • Consumer
                • Enterprise
                • Government


    Report Infographic
    Free Sample Request

    Kindly complete the form below to receive a free sample of this Report

    Customer Strories

    “I am very pleased with how market segments have been defined in a relevant way for my purposes (such as "Portable Freezers & refrigerators" and "last-mile"). In general the report is well structured. Thanks very much for your efforts.”

    Victoria Milne Founder
    Case Study

    Chemicals and Materials