• Cat-intel
  • MedIntelliX
  • Resources
  • About Us
  • Request Free Sample ×

    Kindly complete the form below to receive a free sample of this Report

    Leading companies partner with us for data-driven Insights

    clients tt-cursor

    Visual Positioning System Market

    ID: MRFR/ICT/10356-HCR
    160 Pages
    Aarti Dhapte
    September 2025

    Visual Positioning System Market Research Report Information By Component (Sensors, Camera, Systems, Markers, and Others), Location (Indoor Positioning System and Outdoor Positioning System), Type (1D, 2D, and 3D), Solution (Navigation, Analytics, Tracking, Industrial Solutions, and Others), Platform (UAVs/Drones, AGV, Robotics, AUV, and Others), Application (Commercial Application and Defense Application) And By Region (North America, Europe, Asia-Pacific, And Rest Of The World) –Market Forecast Till 2032

    Share:
    Download PDF ×

    We do not share your information with anyone. However, we may send you emails based on your report interest from time to time. You may contact us at any time to opt-out.

    Visual Positioning System Market Research Report—Global Forecast till 2032 Infographic
    Purchase Options
    $ 4,950.0
    $ 5,950.0
    $ 7,250.0
    Table of Contents

    Visual Positioning System Market Summary

    As per Market Research Future Analysis, the Visual Positioning System (VPS) market was valued at USD 9,320.3 million in 2022 and is projected to grow to USD 27,419.6 million by 2032, with a CAGR of 11.7% from 2023 to 2032. The VPS utilizes computer vision and machine learning to determine the location and orientation of devices in real environments. Key drivers include the rise of AI-enabled optical sensors and the increasing use of commercial drones across various sectors. The market is characterized by significant growth in indoor VPS applications, driven by industrial automation and the demand for precise positioning in environments where GPS is ineffective.

    Key Market Trends & Highlights

    Key trends influencing the Visual Positioning System market include advancements in technology and increasing applications across industries.

    • Market Size in 2022: USD 9,320.3 million; projected to reach USD 27,419.6 million by 2032.
    • CAGR during 2023-2032: 11.7%; driven by AI-enabled optical sensors and commercial drone usage.
    • Major Component: Camera Systems held ~51.8% market share in 2022.
    • North America accounted for 35.6% of the market share in 2022, expected to maintain dominance.

    Market Size & Forecast

    2022 Market Size USD 9,320.3 million
    2032 Market Size USD 27,419.6 million
    CAGR 11.7%

    Major Players

    Key players include Google, Apple, Huawei, Samsung, Sony, Qualcomm, MediaTek, Infineon, STMicroelectronics, Broadcom, Texas Instruments, NXP Semiconductors, Epson, and Zebra Technologies.

    Visual Positioning System Market Trends

      • Increasing trend of Industrial Automation

    Indoor Visual Positioning System (VPS) is a technology that determines the location and orientation of a device or vehicle within an indoor environment using computer vision and machine learning techniques. The growing need for artificial intelligence (AI)-enabled optical sensors, as well as the increased use of commercial drones for security, law enforcement, and agricultural uses, is propelling the visual positioning system market forward.

    The increasing rate of industrial automation and the increasing use of smart robots in commercial and defense applications both have an impact on the visual positioning system market.  Furthermore, the increased use of technology in applications related to safety and security, research and development activities, and an increase in investment by the commercial and public sectors all have a beneficial impact on the visual positioning system market. Furthermore, in the forecast period of 2023 to 2032, the growth in demand for sensors equipped with artificial intelligence and technological developments provides profitable prospects to visual positioning system market competitors.

    Indoor VPS can be used to develop immersive and interactive training experiences for a wide range of industries, including healthcare, manufacturing, and the military. It can improve training efficacy and efficiency by offering a realistic and dynamic learning environment. Indoor VPS can boost efficiency and productivity by allowing accurate positioning and orientation of industrial equipment like as robotic arms and conveyor belts. By delivering real-time position and orientation information, it can also improve the safety and dependability of industrial processes.

    Indoor VPS allows robots to navigate and interact with their surroundings in a more natural and intuitive manner, boosting robotic task precision and accuracy.

    The integration of visual positioning systems into various sectors is poised to enhance operational efficiency and accuracy, reflecting a transformative shift in how spatial data is utilized.

    U.S. Department of Commerce

    Visual Positioning System Market Drivers

    Market Growth Projections

    Technological Advancements

    The Global Visual Positioning System Market Industry is experiencing rapid technological advancements, particularly in artificial intelligence and machine learning. These innovations enhance the accuracy and efficiency of visual positioning systems, enabling applications in various sectors such as retail, logistics, and autonomous vehicles. For instance, AI algorithms can process visual data in real-time, allowing for precise navigation and location tracking. As a result, the market is projected to reach 11.4 USD Billion in 2024, reflecting a growing demand for sophisticated positioning solutions that leverage cutting-edge technology.

    Increased Adoption in Retail

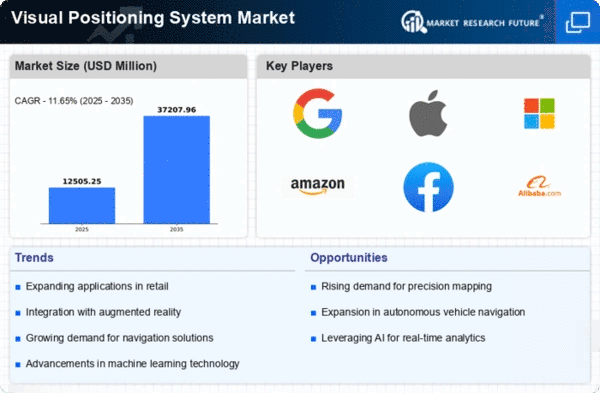
    The Global Visual Positioning System Market Industry is witnessing increased adoption in the retail sector, driven by the need for enhanced customer experiences. Retailers are utilizing visual positioning systems to provide personalized shopping experiences, such as augmented reality applications that guide customers through stores. This trend is supported by the growing emphasis on customer engagement and satisfaction. As retailers invest in these technologies, the market is expected to grow significantly, with projections indicating a rise to 38.2 USD Billion by 2035, underscoring the potential of visual positioning systems in transforming retail environments.

    Integration with IoT Devices

    The Global Visual Positioning System Market Industry is benefiting from the integration of visual positioning systems with Internet of Things (IoT) devices. This convergence allows for enhanced data collection and analysis, enabling businesses to optimize operations and improve decision-making processes. For example, IoT-enabled visual positioning systems can provide real-time insights into asset locations and movements, which is particularly valuable in logistics and supply chain management. As organizations increasingly adopt IoT technologies, the demand for integrated visual positioning solutions is expected to rise, further driving market growth.

    Growth in Autonomous Vehicles

    The Global Visual Positioning System Market Industry is significantly influenced by the growth of autonomous vehicles. As the automotive sector increasingly integrates visual positioning systems for navigation and obstacle detection, the demand for these technologies is likely to surge. Companies are investing heavily in research and development to enhance the capabilities of visual positioning systems in self-driving cars. This trend aligns with the broader shift towards automation in transportation, suggesting a robust market trajectory. The anticipated compound annual growth rate of 11.64% from 2025 to 2035 indicates the potential for substantial growth in this segment.

    Urbanization and Smart Cities

    The Global Visual Positioning System Market Industry is also propelled by urbanization and the development of smart cities. As urban areas expand, the need for efficient navigation and location-based services becomes increasingly critical. Visual positioning systems play a vital role in smart city initiatives, facilitating traffic management, public safety, and infrastructure development. Governments are investing in these technologies to enhance urban living conditions and improve service delivery. This growing focus on smart city solutions is likely to contribute to the market's expansion, with significant investments expected in the coming years.

    Market Segment Insights

    Get more detailed insights about Visual Positioning System Market Research Report—Global Forecast till 2032

    Regional Insights

    By Region, the study provides market insights into North America, Europe, Asia-Pacific, and the Rest of the World. In terms of revenue, North America held the largest share of 35.6% in the Visual Positioning Systems market in 2022 and is expected to maintain its dominance during the forecast period. This is because the region has big players as well as a vast consumer base. Furthermore, there has been a considerable increase in the usage of UAVs, AGVs, industrial robots, and space vehicles.

    Because of its strong adoption of UAVs, AGVs, industrial robots, and space vehicles, the United States accounts for a significant revenue share in the region. Furthermore, several of the key companies involved in offering these solutions are headquartered in North America.

    Companies such as Google, Apple, and Qualcomm are substantially investing in the development of VPS technology, and they are projected to dominate the market in the next years. The United States government has been a major contributor of research and development. The US Department of Defense awarded the University of California, Berkeley a $10 million grant in 2016 to build a VPS system for military uses.

    Also driving the market for visual positioning systems in North America are factors such as the leader in technology development and strong expenditure in R&D for the creation of efficient manufacturing processes. Furthermore, due to the early adoption of industrial automation and the presence of a sizable number of market vendors with local roots, the regional market is expected to grow significantly throughout the projection period.

    Figure3: VISUAL POSITIONING SYSTEM MARKET SIZE BY REGION 2022 VS 2032

    VISUAL POSITIONING SYSTEM MARKET SIZE BY REGION 2022 VS 2032

    Source: Secondary Research, Primary Research, Market Research Future Database, and Analyst Review

    Further, the major countries studied in the market report are the U.S., Canada, Germany, France, the UK, Italy, Spain, China, Japan, India, Australia, South Korea, and Brazil.

    Asia Pacific and the Middle East and Africa (MEA) are likely to emerge as market-growth-friendly regions. DJI, a Chinese drone manufacturer, is a global leader in the development of high-precision positioning systems. Its "Guidance" product is a visual sensing system that includes ultrasonic sensors, integrated visual cameras, and a sophisticated computer vision algorithm. A central CPU and five sensor modules are included in the package. It can detect any barrier in real-time and offer position-based information over any terrain because of its high-precision stereo algorithms. Developers can construct customized applications for its ultrasonic and visual sensors to meet unique needs.

    With international firms significantly investing in the Chinese drone market, manufacturers such as Yuneec International and Hover Camera are expected to see increased demand for positioning devices in future.

    Europe is also predicted to grow significantly between 2023 and 2032 due to the presence of key companies, technological advancement, and more foreign investment in the region.

    Key Players and Competitive Insights

    With a strong presence across different verticals and geographies, the Visual Positioning System market is highly competitive and dominated by established, pure-play vendors. Over 30 vendors cater to this market, and they continually innovate their solutions to meet the evolving needs of businesses by adopting new technologies to make business more effective. These vendors have a robust geographic footprint and partner ecosystem to cater to diverse customer segments. The Visual Positioning System market is highly competitive, with many vendors offering similar products and services.

    The major players in the market include Google, Apple, Huawei, Samsung, Sony, Qualcomm, MediaTek, Infineon, STMicroelectronics, Broadcom, Texas Instruments, NXP Semiconductors, Infineon Technologies, Epson, and Zebra Technologies. Qualcomm Vision Enhanced Precise Positioning (VEPP) software combines the output of multiple currently implemented automotive sensors Global Navigation Satellite Services (GNSS), camera, Inertial Measurement Unit (IMU), and wheel sensors — to provide highly accurate and cost-effective global vehicle positioning to less than one meter.

    The Visual Positioning System Market is a consolidated market due to increasing competition, acquisitions, mergers, and other strategic market developments and decisions to improve operational effectiveness.

    Key Companies in the Visual Positioning System Market market include

    Industry Developments

    • Q1 2024: ABB acquires Sevensense to expand its autonomous mobile robot offering ABB announced the acquisition of Sevensense, a Swiss startup specializing in AI-driven 3D visual navigation technology for autonomous mobile robots (AMRs), aiming to enhance its robotics portfolio with advanced visual positioning capabilities.[3]

    Future Outlook

    Visual Positioning System Market Future Outlook

    The Global Visual Positioning System Market is projected to grow at 11.64% CAGR from 2024 to 2035, driven by advancements in AI, increased demand for automation, and enhanced navigation technologies.

    New opportunities lie in:

    • Develop AI-driven algorithms for real-time positioning accuracy.
    • Expand partnerships with mobile device manufacturers for integrated solutions.
    • Invest in R&D for augmented reality applications in navigation.

    By 2035, the market is expected to achieve substantial growth, reflecting its critical role in navigation technologies.

    Market Segmentation

    Visual Positioning System Type Outlook

    • 1D
    • 2D
    • 3D

    Visual Positioning System Location Outlook

    • Indoor Positioning System
    • Outdoor Positioning System

    Visual Positioning System Platform Outlook

    • UAVs/Drones
    • AGV
    • Robotics
    • AUV
    • Others

    Visual Positioning System Regional Outlook

    • US
    • Canada

    Visual Positioning System Solution Outlook

    • Navigation
    • Analytics
    • Tracking
    • Industrial Solutions
    • Others

    Visual Positioning System Component Outlook

    • Sensors
    • Camera Systems
    • Markers
    • Others

    Visual Positioning System Application Outlook

    • Commercial Application
    • Retail
    • Healthcare
    • Industrial
    • Transportation & Logistics
    • Hospitality
    • Others
    • Defense Application

    Visual Positioning System Market SegmentationVisual Positioning System Component Outlook

    • Sensors
    • Camera Systems
    • Markers
    • Others

    Report Scope

    Report Attribute/Metric Details
    Market Size2022 USD 9,320.3 million
    Market Size 2023 USD 10,123.2 million
    Market Size 2032 USD 27,419.6 million
    Compound Annual Growth Rate (CAGR) 11.7 % (2023-2032)
    Base Year 2022
    Market Forecast Period 2023-2032
    Historical Data 2019- 2021
    Market Forecast Units Value (USD Million)
    Report Coverage Revenue Forecast, Market Competitive Landscape, Growth Factors, and Trends
    Segments Covered Component, Location , Type , Solution , Platform, Application, and Region
    Geographies Covered Europe, North America, Asia-Pacific, and the Rest of the World
    Countries Covered The U.S, Germany, Canada, U.K., Italy, France, Spain, Japan, China, Australia, India, South Korea, and Brazil
    Key Companies Profiled Google, Apple, Huawei, Samsung, Sony, Qualcomm, MediaTek, Infineon, STMicroelectronics, Broadcom, Texas Instruments, NXP Semiconductors, Infineon Technologies, Epson, Zebra Technologies, and Niantic
    Key Market Opportunities VPS can be used for power AR applications, which can overlay digital information on top of the real world.
    Key Market Dynamics Growing market for artificial intelligence (AI)-enabled optical sensors, as well as increased use of commercial drones for security, law enforcement, and agricultural uses worldwide

    Market Highlights

    Author
    Aarti Dhapte
    Team Lead - Research

    She holds an experience of about 6+ years in Market Research and Business Consulting, working under the spectrum of Information Communication Technology, Telecommunications and Semiconductor domains. Aarti conceptualizes and implements a scalable business strategy and provides strategic leadership to the clients. Her expertise lies in market estimation, competitive intelligence, pipeline analysis, customer assessment, etc.

    Leave a Comment

    FAQs

    How much is the Visual Positioning System market?

    The Visual Positioning System Market size is expected to be valued at USD 9,320.3 Million in 2022.

    What is the growth rate of the Visual Positioning System market?

    The global market is projected to grow at a CAGR of 11.7% during the forecast period, 2023-2032.

    Which region held the largest market share in the Visual Positioning System market?

    North America had the largest share of the global market.

    Who are the key players in the Visual Positioning System market?

    The key players in the market are Google, Apple, Huawei, Samsung, Sony, Qualcomm, MediaTek, Infineon, STMicroelectronics, Broadcom, Texas Instruments, NXP Semiconductors, Infineon Technologies, Epson, Zebra Technologies, and Niantic.

    Which Component led the Visual Positioning System market?

    The Camera Systems Component category dominated the market in 2022.

    1. 'TABLE
    2. OF CONTENTS
    3. EXECUTIVE SUMMARY
      1. Market Attractiveness Analysis
    4. Global Visual Positioning System Market, by Component
      1. Global Visual Positioning
    5. System Market, by Location
      1. Global Visual Positioning System Market,
    6. by Type
      1. Global Visual Positioning System Market, by Solution
        1. Global
    7. Visual Positioning System Market, by Platform
      1. Global Visual Positioning
    8. System Market, by Application
      1. Global Visual Positioning System Market,
    9. by Region
    10. MARKET INTRODUCTION
      1. Definition
      2. Scope of the Study
    11. Market Structure
      1. Key Buying Criteria
      2. Macro Factor Indicator Analysis
    12. RESEARCH METHODOLOGY
      1. Research Process
      2. Primary Research
    13. Secondary Research
      1. Market Size Estimation
      2. Forecast Model
    14. MARKET DYNAMICS
      1. Introduction
      2. Drivers
        1. Rising
    15. demand for artificial intelligence (AI)-enabled optical sensors
      1. Increasing
    16. use of commercial drones for security and law enforcement as well as agricultural
    17. purposes around the world
      1. Drivers Impact Analysis
      2. Restraints
    18. Expensive installation and maintenance costs
      1. Need for a secure and dependable
    19. communication infrastructure
      1. Restraints Impact Analysis
      2. Opportunities
    20. VPS can be used for power AR applications, which can overlay digital information
    21. on top of the real world
      1. Challenges
        1. Implementing government
    22. rules on drone use
      1. Competition Among Regional Players
      2. Impact
    23. of COVID-19
      1. Impact on Visual Positioning System Providers
    24. Impact on the End Use
    25. MARKET FACTOR ANALYSIS
      1. Value Chain Analysis/Supply
    26. Chain Analysis
      1. Porter’s Five Forces Model
      2. Bargaining Power of Suppliers
    27. Bargaining Power of Buyers
      1. Threat of New Entrants
      2. Threat of Substitutes
    28. Intensity of Rivalry
    29. GLOBAL VISUAL POSITIONING SYSTEM MARKET, BY COMPONENT
    30. Introduction
      1. Sensors
      2. Camera Systems
      3. Markers
      4. Others
    31. GLOBAL VISUAL POSITIONING SYSTEM MARKET, BY LOCATION
      1. Introduction
      2. Indoor
    32. Positioning System
      1. Outdoor Positioning System
    33. GLOBAL VISUAL POSITIONING SYSTEM
    34. MARKET, BY TYPE
      1. Introduction
      2. 1D
      3. 2D
      4. 3D
    35. GLOBAL VISUAL POSITIONING SYSTEM
    36. MARKET, BY SOLUTION
      1. Introduction
      2. Navigation
      3. Analytics
      4. Tracking
    37. Industrial Solutions
      1. Others
    38. GLOBAL VISUAL POSITIONING SYSTEM MARKET, BY
    39. PLATFORM
      1. Introduction
      2. UAVs/Drones
      3. AGV
      4. Robotics
      5. AUV
    40. Others
    41. GLOBAL VISUAL POSITIONING SYSTEM MARKET, BY APPLICATION
      1. Introduction
    42. Commercial Application
      1. Retail
        1. Healthcare
        2. Industrial
    43. Transportation & Logistics
      1. Hospitality
        1. Others
      2. Defense
    44. Application
    45. GLOBAL VISUAL POSITIONING SYSTEM MARKET SIZE ESTIMATION
    46. & FORECAST, BY REGION
      1. Introduction
      2. North America
    47. Market Estimates & Forecast, by Country, 2019-2032
      1. Market Estimates &
    48. Forecast, by Component, 2019-2032
      1. Market Estimates & Forecast, by Location,
        1. Market Estimates & Forecast, by Type, 2019-2032
        2. Market
    49. Estimates & Forecast, by Solution, 2019-2032
      1. Market Estimates &
    50. Forecast, by Platform, 2019-2032
      1. Market Estimates & Forecast, by Application,
        1. US
    51. Market Estimates & Forecast, by Location, 2019-2032
      1. Market Estimates &
    52. Forecast, by Type, 2019-2032
      1. Market Estimates & Forecast, by Solution,
        1. Market Estimates & Forecast, by Platform, 2019-2032
    53. Market Estimates & Forecast, by Application, 2019-2032
      1. Canada
    54. Market Estimates & Forecast, by Component, 2019-2032
      1. Market Estimates &
    55. Forecast, by Location, 2019-2032
      1. Market Estimates & Forecast, by Type,
        1. Market Estimates & Forecast, by Solution, 2019-2032
    56. Market Estimates & Forecast, by Platform, 2019-2032
      1. Market Estimates &
    57. Forecast, by Application, 2019-2032
      1. Mexico
        1. Market Estimates &
    58. Forecast, by Component, 2019-2032
      1. Market Estimates & Forecast, by Location,
        1. Market Estimates & Forecast, by Type, 2019-2032
    59. Market Estimates & Forecast, by Solution, 2019-2032
      1. Market Estimates &
    60. Forecast, by Platform, 2019-2032
      1. Market Estimates & Forecast, by Application,
      2. Europe
        1. Market Estimates & Forecast, by Country, 2019-2032
    61. Market Estimates & Forecast, by Component, 2019-2032
      1. Market Estimates &
    62. Forecast, by Location, 2019-2032
      1. Market Estimates & Forecast, by Type,
        1. Market Estimates & Forecast, by Solution, 2019-2032
    63. Market Estimates & Forecast, by Platform, 2019-2032
      1. Market Estimates &
    64. Forecast, by Application, 2019-2032
      1. UK
        1. Market Estimates &
    65. Forecast, by Component, 2019-2032
      1. Market Estimates & Forecast, by Location,
        1. Market Estimates & Forecast, by Type, 2019-2032
    66. Market Estimates & Forecast, by Solution, 2019-2032
      1. Market Estimates &
    67. Forecast, by Platform, 2019-2032
      1. Market Estimates & Forecast, by Application,
        1. Germany
    68. Market Estimates & Forecast, by Type, 2019-2032
      1. Market Estimates &
    69. Forecast, by Solution, 2019-2032
      1. Market Estimates & Forecast, by Platform,
        1. Market Estimates & Forecast, by Application, 2019-2032
    70. France
      1. Market Estimates & Forecast, by Component, 2019-2032
    71. Market Estimates & Forecast, by Location, 2019-2032
      1. Market Estimates &
    72. Forecast, by Type, 2019-2032
      1. Market Estimates & Forecast, by Solution,
        1. Market Estimates & Forecast, by Platform, 2019-2032
    73. Market Estimates & Forecast, by Application, 2019-2032
      1. Rest of Europe
    74. Market Estimates & Forecast, by Component, 2019-2032
      1. Market Estimates &
    75. Forecast, by Location, 2019-2032
      1. Market Estimates & Forecast, by Type,
        1. Market Estimates & Forecast, by Solution, 2019-2032
    76. Market Estimates & Forecast, by Platform, 2019-2032
      1. Market Estimates &
    77. Forecast, by Application, 2019-2032
      1. Asia-Pacific
        1. Market
    78. Estimates & Forecast, by Country, 2019-2032
      1. Market Estimates &
    79. Forecast, by Component, 2019-2032
      1. Market Estimates & Forecast, by Location,
        1. Market Estimates & Forecast, by Type, 2019-2032
        2. Market
    80. Estimates & Forecast, by Solution, 2019-2032
      1. Market Estimates &
    81. Forecast, by Platform, 2019-2032
      1. Market Estimates & Forecast, by Application,
        1. China
    82. Market Estimates & Forecast, by Location, 2019-2032
      1. Market Estimates &
    83. Forecast, by Type, 2019-2032
      1. Market Estimates & Forecast, by Solution,
        1. Market Estimates & Forecast, by Platform, 2019-2032
    84. Market Estimates & Forecast, by Application, 2019-2032
      1. Japan
    85. Market Estimates & Forecast, by Component, 2019-2032
      1. Market Estimates &
    86. Forecast, by Location, 2019-2032
      1. Market Estimates & Forecast, by Type,
        1. Market Estimates & Forecast, by Solution, 2019-2032
    87. Market Estimates & Forecast, by Platform, 2019-2032
      1. Market Estimates &
    88. Forecast, by Application, 2019-2032
      1. India
        1. Market Estimates &
    89. Forecast, by Component, 2019-2032
      1. Market Estimates & Forecast, by Location,
        1. Market Estimates & Forecast, by Type, 2019-2032
    90. Market Estimates & Forecast, by Solution, 2019-2032
      1. Market Estimates &
    91. Forecast, by Platform, 2019-2032
      1. Market Estimates & Forecast, by Application,
        1. Rest of Asia-Pacific
    92. by Component, 2019-2032
      1. Market Estimates & Forecast, by Location,
        1. Market Estimates & Forecast, by Type, 2019-2032
    93. Market Estimates & Forecast, by Solution, 2019-2032
      1. Market Estimates &
    94. Forecast, by Platform, 2019-2032
      1. Market Estimates & Forecast, by Application,
      2. Rest of the World
        1. Middle East & Africa
    95. Market Estimates & Forecast, by Component, 2019-2032
      1. Market Estimates &
    96. Forecast, by Location, 2019-2032
      1. Market Estimates & Forecast, by Type,
        1. Market Estimates & Forecast, by Solution, 2019-2032
    97. Market Estimates & Forecast, by Platform, 2019-2032
      1. Market Estimates &
    98. Forecast, by Application, 2019-2032
      1. South America
    99. Market Estimates & Forecast, by Component, 2019-2032
      1. Market Estimates &
    100. Forecast, by Location, 2019-2032
      1. Market Estimates & Forecast, by Type,
        1. Market Estimates & Forecast, by Solution, 2019-2032
    101. Market Estimates & Forecast, by Platform, 2019-2032
      1. Market Estimates &
    102. Forecast, by Application, 2019-2032
    103. COMPETITIVE LANDSCAPE
      1. Introduction
    104. Key Developments & Growth Strategies
      1. Competitor Benchmarking
    105. Vendor Share Analysis, 2022 (% Share)
    106. COMPANY PROFILES
      1. Google
    107. Apple
      1. Huawei
      2. Samsung
      3. Sony
      4. Qualcomm
      5. MediaTek
    108. Infineon
      1. STMicroelectronics
      2. Broadcom
      3. Texas Instruments
    109. NXP Semiconductors
      1. Infineon Technologies
      2. Epson
      3. Zebra
    110. Technologies
      1. Company Overview
        1. Financial Overview
    111. Solution/Services Offered
      1. Key Developments
        1. SWOT Analysis
    112. Key Strategies
    113. NOTE:
    114. This table of content is tentative and subject to
    115. change as the research progresses.
    116.  In section 14, only the top 15 companies
    117. will be profiled. Each company will be profiled based on the Market Overview, Financials,
    118. Service Portfolio, Business Strategies, and Recent Developments parameters.
    119. The companies are selected based on two broad criteria¬– strength of product
    120. portfolio and excellence in business strategies.
    121.  Key parameters considered for
    122. evaluating strength of the vendor’s product portfolio are industry experience,
    123. product capabilities/features, innovations/R&D investment, flexibility to customize
    124. the product, ability to integrate with other Platforms, pre- and post-sale services,
    125. and customer ratings/feedback.
    126.  Key parameters considered for evaluating a vendor’s
    127. excellence in business strategy are its market share, global presence, customer
    128. base, partner ecoPlatform (technology alliances/resellers/distributors), acquisitions,
    129. and marketing strategies/investments.
    130.  The financial details of the company
    131. cannot be provided if the information is not available in the public domain and
    132. or from reliable sources.  '

    Visual Positioning System Market Segmentation

    • Global Visual Positioning System, By Component Outlook (USD Million, 2019-2032)

      • Sensors
      • Camera Systems
      • Markers
      • Others
    • Global Visual Positioning System, By Location Outlook (USD Million, 2019-2032)

      • Indoor Positioning System
      • Outdoor Positioning System
    • Global Visual Positioning System, By Type Outlook (USD Million, 2019-2032)

      • 1D
      • 2D
      • 3D
    • Global Visual Positioning System, By Solution Outlook (USD Million, 2019-2032)

      • Navigation
      • Analytics
      • Tracking
      • Industrial Solutions
      • Others
    • Global Visual Positioning System, By Platform Outlook (USD Million, 2019-2032)

      • UAVs/Drones
      • AGV
      • Robotics
      • AUV
      • Others
    • Global Visual Positioning System, By Application Outlook (USD Million, 2019-2032)

      • Commercial Application

        • Retail
        • Healthcare
        • Industrial
        • Transportation & Logistics
        • Hospitality
        • Others
      • Defense Application

    Global Visual Positioning System Regional Outlook (USD Million, 2019-2032)

    • North America Outlook (USD Million, 2019-2032)

    • North America Visual Positioning System, By Component Outlook (USD Million, 2019-2032)

      • Sensors
      • Camera Systems
      • Markers
      • Others
    • North America Visual Positioning System, By Location Outlook (USD Million, 2019-2032)

      • Indoor Positioning System
      • Outdoor Positioning System
    • North America Visual Positioning System, By Type Outlook (USD Million, 2019-2032)

      • 1D
      • 2D
      • 3D
    • North America Visual Positioning System, By Solution Outlook (USD Million, 2019-2032)

      • Navigation
      • Analytics
      • Tracking
      • Industrial Solutions
      • Others
    • North America Visual Positioning System, By Platform Outlook (USD Million, 2019-2032)

      • UAVs/Drones
      • AGV
      • Robotics
      • AUV
      • Others
    • North America Visual Positioning System, By Application Outlook (USD Million, 2019-2032)

      • Commercial Application

        • Retail
        • Healthcare
        • Industrial
        • Transportation & Logistics
        • Hospitality
        • Others
      • Defense Application

      • US Outlook (USD Million, 2019-2032)

      • US Visual Positioning System, By Component Outlook (USD Million, 2019-2032)

        • Sensors
        • Camera Systems
        • Markers
        • Others
      • US Visual Positioning System, By Location Outlook (USD Million, 2019-2032)

        • Indoor Positioning System
        • Outdoor Positioning System
      • US Visual Positioning System, By Type Outlook (USD Million, 2019-2032)

        • 1D
        • 2D
        • 3D
      • US Visual Positioning System, By Solution Outlook (USD Million, 2019-2032)

        • Navigation
        • Analytics
        • Tracking
        • Industrial Solutions
        • Others
      • US Visual Positioning System, By Platform Outlook (USD Million, 2019-2032)

        • UAVs/Drones
        • AGV
        • Robotics
        • AUV
        • Others
      • US Visual Positioning System, By Application Outlook (USD Million, 2019-2032)

        • Commercial Application

          • Retail
          • Healthcare
          • Industrial
          • Transportation & Logistics
          • Hospitality
          • Others
        • Defense Application
      • Canada Outlook (USD Million, 2019-2032)

      • Canada Visual Positioning System, By Component Outlook (USD Million, 2019-2032)

        • Sensors
        • Camera Systems
        • Markers
        • Others
      • Canada Visual Positioning System, By Location Outlook (USD Million, 2019-2032)

        • Indoor Positioning System
        • Outdoor Positioning System
      • Canada Visual Positioning System, By Type Outlook (USD Million, 2019-2032)

        • 1D
        • 2D
        • 3D
      • Canada Visual Positioning System, By Solution Outlook (USD Million, 2019-2032)

        • Navigation
        • Analytics
        • Tracking
        • Industrial Solutions
        • Others
      • Canada Visual Positioning System, By Platform Outlook (USD Million, 2019-2032)

        • UAVs/Drones
        • AGV
        • Robotics
        • AUV
        • Others
      • Canada Visual Positioning System, By Application Outlook (USD Million, 2019-2032)

        • Commercial Application

          • Retail
          • Healthcare
          • Industrial
          • Transportation & Logistics
          • Hospitality
          • Others
        • Defense Application
      • Mexico Outlook (USD Million, 2019-2032)

      • Mexico Visual Positioning System, By Component Outlook (USD Million, 2019-2032)

        • Sensors
        • Camera Systems
        • Markers
        • Others
      • Mexico Visual Positioning System, By Location Outlook (USD Million, 2019-2032)

        • Indoor Positioning System
        • Outdoor Positioning System
      • Mexico Visual Positioning System, By Type Outlook (USD Million, 2019-2032)

        • 1D
        • 2D
        • 3D
      • Mexico Visual Positioning System, By Solution Outlook (USD Million, 2019-2032)

        • Navigation
        • Analytics
        • Tracking
        • Industrial Solutions
        • Others
      • Mexico Visual Positioning System, By Platform Outlook (USD Million, 2019-2032)

        • UAVs/Drones
        • AGV
        • Robotics
        • AUV
        • Others
      • Mexico Visual Positioning System, By Application Outlook (USD Million, 2019-2032)

        • Commercial Application

          • Retail
          • Healthcare
          • Industrial
          • Transportation & Logistics
          • Hospitality
          • Others
        • Defense Application
    • Europe Outlook (USD Million, 2019-2032)

    • Europe Visual Positioning System, By Component Outlook (USD Million, 2019-2032)

      • Sensors
      • Camera Systems
      • Markers
      • Others
    • Europe Visual Positioning System, By Location Outlook (USD Million, 2019-2032)

      • Indoor Positioning System
      • Outdoor Positioning System
    • Europe Visual Positioning System, By Type Outlook (USD Million, 2019-2032)

      • 1D
      • 2D
      • 3D
    • Europe Visual Positioning System, By Solution Outlook (USD Million, 2019-2032)

      • Navigation
      • Analytics
      • Tracking
      • Industrial Solutions
      • Others
    • Europe Visual Positioning System, By Platform Outlook (USD Million, 2019-2032)

      • UAVs/Drones
      • AGV
      • Robotics
      • AUV
      • Others
    • Europe Visual Positioning System, By Application Outlook (USD Million, 2019-2032)

      • Commercial Application

        • Retail
        • Healthcare
        • Industrial
        • Transportation & Logistics
        • Hospitality
        • Others
      • Defense Application

      • Germany Outlook (USD Million, 2019-2032)

      • Germany Visual Positioning System, By Component Outlook (USD Million, 2019-2032)

        • Sensors
        • Camera Systems
        • Markers
        • Others
      • Germany Visual Positioning System, By Location Outlook (USD Million, 2019-2032)

        • Indoor Positioning System
        • Outdoor Positioning System
      • Germany Visual Positioning System, By Type Outlook (USD Million, 2019-2032)

        • 1D
        • 2D
        • 3D
      • Germany Visual Positioning System, By Solution Outlook (USD Million, 2019-2032)

        • Navigation
        • Analytics
        • Tracking
        • Industrial Solutions
        • Others
      • Germany Visual Positioning System, By Platform Outlook (USD Million, 2019-2032)

        • UAVs/Drones
        • AGV
        • Robotics
        • AUV
        • Others
      • Germany Visual Positioning System, By Application Outlook (USD Million, 2019-2032)

        • Commercial Application

          • Retail
          • Healthcare
          • Industrial
          • Transportation & Logistics
          • Hospitality
          • Others
        • Defense Application
      • France Outlook (USD Million, 2019-2032)

      • France Visual Positioning System, By Component Outlook (USD Million, 2019-2032)

        • Sensors
        • Camera Systems
        • Markers
        • Others
      • France Visual Positioning System, By Location Outlook (USD Million, 2019-2032)

        • Indoor Positioning System
        • Outdoor Positioning System
      • France Visual Positioning System, By Type Outlook (USD Million, 2019-2032)

        • 1D
        • 2D
        • 3D
      • France Visual Positioning System, By Solution Outlook (USD Million, 2019-2032)

        • Navigation
        • Analytics
        • Tracking
        • Industrial Solutions
        • Others
      • France Visual Positioning System, By Platform Outlook (USD Million, 2019-2032)

        • UAVs/Drones
        • AGV
        • Robotics
        • AUV
        • Others
      • France Visual Positioning System, By Application Outlook (USD Million, 2019-2032)

        • Commercial Application

          • Retail
          • Healthcare
          • Industrial
          • Transportation & Logistics
          • Hospitality
          • Others
        • Defense Application
      • UK Outlook (USD Million, 2019-2032)

      • UK Visual Positioning System, By Component Outlook (USD Million, 2019-2032)

        • Sensors
        • Camera Systems
        • Markers
        • Others
      • UK Visual Positioning System, By Location Outlook (USD Million, 2019-2032)

        • Indoor Positioning System
        • Outdoor Positioning System
      • UK Visual Positioning System, By Type Outlook (USD Million, 2019-2032)

        • 1D
        • 2D
        • 3D
      • UK Visual Positioning System, By Solution Outlook (USD Million, 2019-2032)

        • Navigation
        • Analytics
        • Tracking
        • Industrial Solutions
        • Others
      • UK Visual Positioning System, By Platform Outlook (USD Million, 2019-2032)

        • UAVs/Drones
        • AGV
        • Robotics
        • AUV
        • Others
      • UK Visual Positioning System, By Application Outlook (USD Million, 2019-2032)

        • Commercial Application

          • Retail
          • Healthcare
          • Industrial
          • Transportation & Logistics
          • Hospitality
          • Others
        • Defense Application

      • Rest of Europe Outlook (USD Million, 2019-2032)

      • Rest of Europe Visual Positioning System, By Component Outlook (USD Million, 2019-2032)

        • Sensors
        • Camera Systems
        • Markers
        • Others
      • Rest of Europe Visual Positioning System, By Location Outlook (USD Million, 2019-2032)

        • Indoor Positioning System
        • Outdoor Positioning System
      • Rest of Europe Visual Positioning System, By Type Outlook (USD Million, 2019-2032)

        • 1D
        • 2D
        • 3D
      • Rest of Europe Visual Positioning System, By Solution Outlook (USD Million, 2019-2032)

        • Navigation
        • Analytics
        • Tracking
        • Industrial Solutions
        • Others
      • Rest of Europe Visual Positioning System, By Platform Outlook (USD Million, 2019-2032)

        • UAVs/Drones
        • AGV
        • Robotics
        • AUV
        • Others
      • Rest of Europe Visual Positioning System, By Application Outlook (USD Million, 2019-2032)

        • Commercial Application

          • Retail
          • Healthcare
          • Industrial
          • Transportation & Logistics
          • Hospitality
          • Others
        • Defense Application

    • Asia-Pacific Outlook (USD Million, 2019-2032)

    • Asia-Pacific Visual Positioning System, By Component Outlook (USD Million, 2019-2032)

      • Sensors
      • Camera Systems
      • Markers
      • Others
    • Asia-Pacific Visual Positioning System, By Location Outlook (USD Million, 2019-2032)

      • Indoor Positioning System
      • Outdoor Positioning System
    • Asia-Pacific Visual Positioning System, By Type Outlook (USD Million, 2019-2032)

      • 1D
      • 2D
      • 3D
    • Asia-Pacific Visual Positioning System, By Solution Outlook (USD Million, 2019-2032)

      • Navigation
      • Analytics
      • Tracking
      • Industrial Solutions
      • Others
    • Asia-Pacific Visual Positioning System, By Platform Outlook (USD Million, 2019-2032)

      • UAVs/Drones
      • AGV
      • Robotics
      • AUV
      • Others
    • Asia-Pacific Visual Positioning System, By Application Outlook (USD Million, 2019-2032)

      • Commercial Application

        • Retail
        • Healthcare
        • Industrial
        • Transportation & Logistics
        • Hospitality
        • Others
      • Defense Application

      • China Outlook (USD Million, 2019-2032)

      • China Visual Positioning System, By Component Outlook (USD Million, 2019-2032)

        • Sensors
        • Camera Systems
        • Markers
        • Others
      • China Visual Positioning System, By Location Outlook (USD Million, 2019-2032)

        • Indoor Positioning System
        • Outdoor Positioning System
      • China Visual Positioning System, By Type Outlook (USD Million, 2019-2032)

        • 1D
        • 2D
        • 3D
      • China Visual Positioning System, By Solution Outlook (USD Million, 2019-2032)

        • Navigation
        • Analytics
        • Tracking
        • Industrial Solutions
        • Others
      • China Visual Positioning System, By Platform Outlook (USD Million, 2019-2032)

        • UAVs/Drones
        • AGV
        • Robotics
        • AUV
        • Others
      • China Visual Positioning System, By Application Outlook (USD Million, 2019-2032)

        • Commercial Application

          • Retail
          • Healthcare
          • Industrial
          • Transportation & Logistics
          • Hospitality
          • Others
        • Defense Application

      • India Outlook (USD Million, 2019-2032)

      • India Visual Positioning System, By Component Outlook (USD Million, 2019-2032)

        • Sensors
        • Camera Systems
        • Markers
        • Others
      • India Visual Positioning System, By Location Outlook (USD Million, 2019-2032)

        • Indoor Positioning System
        • Outdoor Positioning System
      • India Visual Positioning System, By Type Outlook (USD Million, 2019-2032)

        • 1D
        • 2D
        • 3D
      • India Visual Positioning System, By Solution Outlook (USD Million, 2019-2032)

        • Navigation
        • Analytics
        • Tracking
        • Industrial Solutions
        • Others
      • India Visual Positioning System, By Platform Outlook (USD Million, 2019-2032)

        • UAVs/Drones
        • AGV
        • Robotics
        • AUV
        • Others
      • India Visual Positioning System, By Application Outlook (USD Million, 2019-2032)

        • Commercial Application

          • Retail
          • Healthcare
          • Industrial
          • Transportation & Logistics
          • Hospitality
          • Others
        • Defense Application

      • Japan Outlook (USD Million, 2019-2032)

      • Japan Visual Positioning System, By Component Outlook (USD Million, 2019-2032)

        • Sensors
        • Camera Systems
        • Markers
        • Others
      • Japan Visual Positioning System, By Location Outlook (USD Million, 2019-2032)

        • Indoor Positioning System
        • Outdoor Positioning System
      • Japan Visual Positioning System, By Type Outlook (USD Million, 2019-2032)

        • 1D
        • 2D
        • 3D
      • Japan Visual Positioning System, By Solution Outlook (USD Million, 2019-2032)

        • Navigation
        • Analytics
        • Tracking
        • Industrial Solutions
        • Others
      • Japan Visual Positioning System, By Platform Outlook (USD Million, 2019-2032)

        • UAVs/Drones
        • AGV
        • Robotics
        • AUV
        • Others
      • Japan Visual Positioning System, By Application Outlook (USD Million, 2019-2032)

        • Commercial Application

          • Retail
          • Healthcare
          • Industrial
          • Transportation & Logistics
          • Hospitality
          • Others
        • Defense Application

      • Rest of Asia-Pacific Outlook (USD Million, 2019-2032)

      • Rest of Asia-Pacific Visual Positioning System, By Component Outlook (USD Million, 2019-2032)

        • Sensors
        • Camera Systems
        • Markers
        • Others
      • Rest of Asia-Pacific Visual Positioning System, By Location Outlook (USD Million, 2019-2032)

        • Indoor Positioning System
        • Outdoor Positioning System
      • Rest of Asia-Pacific Visual Positioning System, By Type Outlook (USD Million, 2019-2032)

        • 1D
        • 2D
        • 3D
      • Rest of Asia-Pacific Visual Positioning System, By Solution Outlook (USD Million, 2019-2032)

        • Navigation
        • Analytics
        • Tracking
        • Industrial Solutions
        • Others
      • Rest of Asia-Pacific Visual Positioning System, By Platform Outlook (USD Million, 2019-2032)

        • UAVs/Drones
        • AGV
        • Robotics
        • AUV
        • Others
      • Rest of Asia-Pacific Visual Positioning System, By Application Outlook (USD Million, 2019-2032)

        • Commercial Application

          • Retail
          • Healthcare
          • Industrial
          • Transportation & Logistics
          • Hospitality
          • Others
        • Defense Application
    • Rest of the World Outlook (USD Million, 2019-2032)

      • Middle East & Africa Outlook (USD Million, 2019-2032)

      • Middle East & Africa Visual Positioning System, By Component Outlook (USD Million, 2019-2032)

        • Sensors
        • Camera Systems
        • Markers
        • Others
      • Middle East & Africa Visual Positioning System, By Location Outlook (USD Million, 2019-2032)

        • Indoor Positioning System
        • Outdoor Positioning System
      • Middle East & Africa Visual Positioning System, By Type Outlook (USD Million, 2019-2032)

        • 1D
        • 2D
        • 3D
      • Middle East & Africa Visual Positioning System, By Solution Outlook (USD Million, 2019-2032)

        • Navigation
        • Analytics
        • Tracking
        • Industrial Solutions
        • Others
      • Middle East & Africa Visual Positioning System, By Platform Outlook (USD Million, 2019-2032)

        • UAVs/Drones
        • AGV
        • Robotics
        • AUV
        • Others
      • Middle East & Africa Visual Positioning System, By Application Outlook (USD Million, 2019-2032)

        • Commercial Application

          • Retail
          • Healthcare
          • Industrial
          • Transportation & Logistics
          • Hospitality
          • Others
        • Defense Application
      • South America Outlook (USD Million, 2019-2032)

      • South America Visual Positioning System, By Component Outlook (USD Million, 2019-2032)

        • Sensors
        • Camera Systems
        • Markers
        • Others
      • South America Visual Positioning System, By Location Outlook (USD Million, 2019-2032)

        • Indoor Positioning System
        • Outdoor Positioning System
      • South America Visual Positioning System, By Type Outlook (USD Million, 2019-2032)

        • 1D
        • 2D
        • 3D
      • South America Visual Positioning System, By Solution Outlook (USD Million, 2019-2032)

        • Navigation
        • Analytics
        • Tracking
        • Industrial Solutions
        • Others
      • South America Visual Positioning System, By Platform Outlook (USD Million, 2019-2032)

        • UAVs/Drones
        • AGV
        • Robotics
        • AUV
        • Others
      • South America Visual Positioning System, By Application Outlook (USD Million, 2019-2032)

        • Commercial Application

          • Retail
          • Healthcare
          • Industrial
          • Transportation & Logistics
          • Hospitality
          • Others
        • Defense Application
    Report Infographic
    Free Sample Request

    Kindly complete the form below to receive a free sample of this Report

    Customer Strories

    “I am very pleased with how market segments have been defined in a relevant way for my purposes (such as "Portable Freezers & refrigerators" and "last-mile"). In general the report is well structured. Thanks very much for your efforts.”

    Victoria Milne Founder
    Case Study

    Chemicals and Materials