info@marketresearchfuture.com   📞  +1 (855) 661-4441(US)   📞  +44 1720 412 167(UK)
Certified Global Research Member
Isomar fd.webp Wcrc 57.webp
Key Questions Answered
  • Global Market Outlook
  • In-depth analysis of global and regional trends
  • Analyze and identify the major players in the market, their market share, key developments, etc.
  • To understand the capability of the major players based on products offered, financials, and strategies.
  • Identify disrupting products, companies, and trends.
  • To identify opportunities in the market.
  • Analyze the key challenges in the market.
  • Analyze the regional penetration of players, products, and services in the market.
  • Comparison of major players’ financial performance.
  • Evaluate strategies adopted by major players.
  • Recommendations
Why Choose Market Research Future?
  • Vigorous research methodologies for specific market.
  • Knowledge partners across the globe
  • Large network of partner consultants.
  • Ever-increasing/ Escalating data base with quarterly monitoring of various markets
  • Trusted by fortune 500 companies/startups/ universities/organizations
  • Large database of 5000+ markets reports.
  • Effective and prompt pre- and post-sales support.

Visual Analytics Market Analysis

ID: MRFR//3392-HCR | 100 Pages | Author: Aarti Dhapte| December 2024

The Visual Analytics market went through a big growth and movement recently, fuelled by the increased necessity of information management and big data across different businesses. This market area is concerned with usage of pioneering graphical and intuitive tools for deep analysis of complex datasets that provides key takeaways which leads to rational decision-making. One interesting factor of the market factors is the magnificent evolution of the big data which organizations accumulate the vast amounts of data that are beyond the capability of traditional analytical approaches to process properly. The Visual Analytics question is countered by a non-verbal presentation of information in eye-catching figures, hence making it simpler for users to comprehend and extract critical data.

Along with the vibrant atmosphere of the market, the recent rapid progress in machine learning and AI fields is another vital factor adding to that. These mechanical features have enhanced the capabilities of Vision Analytics devices that imitate human cognitive sense, making more accurate information assessment and predictive modelling possible. Therefore, the Visual Analytics in reference to data plays a notable role as it helps organizations understand the patterns, cases and relations within their data sets. The integration of AI calculations into the phases of Visual Analytics has in addition made the client more influential in potentially suing natural intelligence that would have stayed hidden using the traditional analytical techniques.

The navigation of the world of information based decision making is also a contributing factor in the expansion of visual analytics and henceforth the market. Convictions from different topic, say finance, healthcare, retailing, and engineering, realize the benefit of data for strategic planning and business transformation. Visual Analytics acts along with information complexities investigation and gives a solution for improving communication processes by making knowledge more attractive in visual way. This results in easier learning and follow-up to the discoveries of the partners at all levels thus facilitating the additional information-based team leadership culture.

Besides, aside from market elements of visual analytics, the rising demand for analytics is increasing its buzz too. With the current frenetic economy on top, beautiful leadership is crucial to keep a competitive edge. With visual tools, the clients can interact with information more dynamically, resulting in their speedy movement across the information space, making their decisions informed. The speed at which the data is collected and stored presents enormous opportunities, notably for companies that are in business sectors where time to react in the face of emerging market trends or incidences are of the utmost importance.

Covered Aspects:

Report Attribute/Metric Details
Segment Outlook Component, Deployment, Industry and Region

Visual Analytics Market Overview


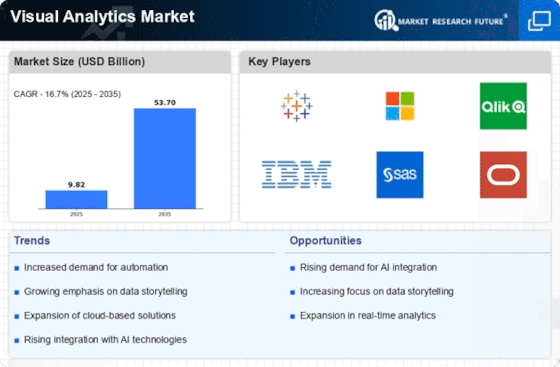
The Visual Analytics Market is projected to grow from USD 9.82 billion in 2024 to USD 33.77 billion by 2032, exhibiting a compound annual growth rate (CAGR) of 16.70% during the forecast period (2024 - 2032). Additionally, the market size for visual analytics was valued at USD 8.23 billion in 2023.


Increased usage of visually driven data and growing demand for analytical tools among enterprises are the key market drivers enhancing market growth.


Figure 1: Visual Analytics Market Size, 2024-2032 (USD Billion)


 Visual Analytics Market Overview


Source: Secondary Research, Primary Research, MRFR Database and Analyst Review


Visual Analytics Market Trends


Rising adoption of cloud technology is driving the market growth


The visual analytics market is seeing a rising adoption of cloud technology. This is due to cloud-based visual analytics solutions' many benefits, such as scalability, flexibility, and cost-effectiveness. Cloud-based visual analytics solutions allow businesses to scale their visual analytics capabilities up or down as needed, which is ideal for businesses with fluctuating data volumes. Additionally, cloud-based visual analytics solutions are typically more flexible than on-premises solutions, as they can be accessed from anywhere with an internet connection. Finally, cloud-based visual analytics solutions are often more cost-effective than on-premises solutions, as businesses do not have to invest in the hardware and software necessary to run a visual analytics solution on-premises. Furthermore, the adoption of cloud technology in the visual analytics market is expected to grow in the coming years. Businesses of all sizes are driving this trend as they look for ways to improve their decision-making capabilities by leveraging the power of visual analytics. This factor drives the market CAGR.


Additionally, the amount of data generated through various technologies, such as the Internet of Things (IoT) and other data sources, is increasing globally, owing to better operation management and correct investments. Moreover, visual analytics helps analyze substantial data pools like structured and unstructured data that require additional services. Furthermore, companies prefer visual analytics software with advanced technologies, such as artificial intelligence (AI), big data, machine learning (ML), and others, to handle the amount of data and generate a better and more knowledgeable interpretation of statistics. For instance, in July 2021, Atos acquired Visual BI to enhance its ability to address customers' increasing need for BI and analytics in cloud environments. Such demands are driving the growth of the visual analytics industry. Thus, driving the Visual Analytics market revenue.


Visual Analytics Market Segment Insights


Visual Analytics Component Insights


Based on Components, the global Visual Analytics market segmentation includes Software and Services. The software segment dominated the market because software is the core component of any visual analytics solution. Software is the core component of any visual analytics solution. The software provides the tools and functionality necessary to visualize and analyze data. The software can be customized to meet the specific needs of businesses.


Visual Analytics Deployment Insights


Based on Deployment, the global Visual Analytics market segmentation includes On-Demand, On-Premise. The on-demand segment dominated the market because on-demand visual analytics solutions offer several advantages over on-premises solutions. On-demand visual analytics solutions can be scaled up or down as needed, which is ideal for businesses with fluctuating data volumes. On-demand visual analytics solutions can be accessed from anywhere with an internet connection, which gives businesses more flexibility. On-demand visual analytics solutions are ideal for businesses with fluctuating data volumes or that need to access visual analytics solutions from anywhere.


Figure 2: Visual Analytics Market, by Deployment, 2022 & 2032 (USD billion)


Visual Analytics Market


Source: Secondary Research, Primary Research, MRFR Database and Analyst ReviewVisual Analytics Industry Insights


The global Visual Analytics market segmentation, based on Industry, includes IT, Retail, BFSI, Manufacturing, Military & Defense, Transportation & Logistics, and Others. The IT segment dominated the market because the IT industry is a major user of data and analytics, and visual analytics is a valuable tool for making sense of complex data sets. The IT industry is a major user of data and analytics, and visual analytics is a valuable tool for making sense of complex data sets. Furthermore, Visual analytics can help businesses to stay ahead of the curve by providing insights into customer behavior, market trends, and competitive landscape.


Visual Analytics Regional Insights


By Region, the study provides market insights into North America, Europe, Asia-Pacific and the Rest of the World. The North American Visual Analytics market area will dominate this market due to the technological advancements and early adoption of analytical solutions in this Region.


Further, the major countries studied in the market report are The U.S., Canada, German, France, the UK, Italy, Spain, China, Japan, India, Australia, South Korea, and Brazil.


Figure 3: VISUAL ANALYTICS MARKET SHARE BY REGION 2022 (%)


Visual Analytics Market


Source: Secondary Research, Primary Research, MRFR Database and Analyst Review


Europe's Visual Analytics market accounts for the second-largest market share due to the increasing technological adoption and huge opportunities across industries in this Region. Further, the German Visual Analytics market held the largest market share, and the UK Visual Analytics market was the fastest-growing market in the European Region.


The Asia-Pacific Visual Analytics Market is expected to grow fastest from 2023 to 2032. This is due to increasing technological adoption and huge opportunities across industries in this Region. Moreover, China’s Visual Analytics market held the largest market share, and the Indian Visual Analytics market was the fastest-growing market in the Asia-Pacific region.


Visual Analytics Key Market Players& Competitive Insights


Leading market players are investing heavily in research and development to expand their product lines, which will help the Visual Analytics market grow even more. Market participants are also undertaking various strategic activities to expand their global footprint, with important market developments including new product launches, contractual agreements, mergers and acquisitions, higher investments, and collaboration with other organizations. To expand and survive in a more competitive and rising market climate, the Visual Analytics industry must offer cost-effective items.


Manufacturing locally to minimize operational costs is one of the key business tactics manufacturers use in the global Visual Analytics industry to benefit clients and increase the market sector. In recent years, the Visual Analytics industry has offered some of the most significant advantages to medicine. Major players in the Visual Analytics market, including IBM Corporation (U.S.), Oracle (U.S.), SAP (Germany), SAS Institute (U.S.), Tableau Software (U.S.), Microsoft (U.S.), MicroStrategy (U.S.), TIBCO Software (U.S.), Qlik (U.S.), and Alteryx (U.S.)., and others, are attempting to increase market demand by investing in research and development operations.


Rapid Miner Inc. is a software company that develops and sells data science and machine learning software. The Company is headquartered in Vienna, Austria, and has offices in the United States, Europe, and Asia. Businesses, governments, and academic institutions use the Company's software to build and deploy data science and machine learning models. RapidMiner Inc. partnered with Hivecell to allow users to rapidly generate and operate models with streaming data from the edge.


Microsoft Corporation is an American multinational technology corporation headquartered in Redmond, Washington. Microsoft's best-known software products are the Windows line of operating systems, the Microsoft 365 suite of productivity applications, and the Internet Explorer and Edge web browsers. Microsoft Corporation announced a collaboration with Consumer Value Store (CVS) Health to develop innovative solutions to help consumers improve their health.


Key Companies in the Visual Analytics market include


  • G IBM Corporation (U.S.)


  • Oracle (U.S.)


  • SAP (Germany)


  • SAS Institute (U.S.)


  • Tableau Software (U.S.)


  • Microsoft (U.S.)


  • MicroStrategy (U.S.)


  • TIBCO Software (U.S.)


  • Qlik (U.S.)


  • Alteryx (U.S.)


Visual Analytics Industry Developments


February 2021: RapidMiner Inc. partnered with Hivecell to allow users to rapidly generate and operate models with streaming data from the edge.


December 2021: Microsoft Corporation announced a collaboration with Consumer Value Store (CVS) Health to develop innovative solutions to help consumers improve their health.


Visual Analytics Market Segmentation


Visual Analytics Component Outlook


  • Software


  • Services


Visual Analytics Deployment Outlook


  • On-Demand


  • On-Premise


Visual Analytics Industry Outlook


  • IT


  • Retail


  • BFSI


  • Manufacturing


  • Military & Defense


  • Transportation & Logistics


  • Others


Visual Analytics Regional Outlook


  • North America


  • US


  • Canada


  • Europe


  • Germany


  • France


  • UK


  • Italy


  • Spain


  • Rest of Europe


  • Asia-Pacific


    • China


    • Japan


    • India


    • Australia


    • South Korea


    • Australia


    • Rest of Asia-Pacific


  • Rest of the World


    • Middle East


    • Africa


    • Latin America


Leading companies partner with us for data-driven Insights
client_1 client_2 client_3 client_4 client_5 client_6 client_7 client_8 client_9 client_10
Kindly complete the form below to receive a free sample of this Report
Please fill in Business Email for Quick Response

We do not share your information with anyone. However, we may send you emails based on your report interest from time to time. You may contact us at any time to opt-out.

Purchase Option
Single User $ 4,950
Multiuser License $ 5,950
Enterprise User $ 7,250
Compare Licenses
Tailored for You
  • Dedicated Research on any specifics segment or region.
  • Focused Research on specific players in the market.
  • Custom Report based only on your requirements.
  • Flexibility to add or subtract any chapter in the study.
  • Historic data from 2014 and forecasts outlook till 2040.
  • Flexibility of providing data/insights in formats (PDF, PPT, Excel).
  • Provide cross segmentation in applicable scenario/markets.