Market Trends
Key Emerging Trends in the Visual Analytics Market
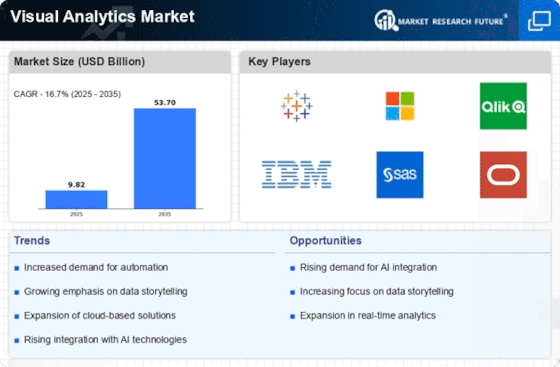
Visual analytics market has experienced a remarkable acceleration over the period due to the strong interests for data-driven knowledge in different industries. Since organizations feel being in proximity with information visualization is paramount, they have acknowledged an increase in uptake of visual analytics. On the other hand a major pattern shaping this market is a developing combination of the fundamentals of new technology embodied, for instance, intelligent systems and AI into visual tools. Thus, these improvements enable more in-depth and keen approach to visual analytics since they offer more precise and prophetic analysis of the amazing volumes of data.
For instance, another growing trend is increasingly in-depth data analysis. There are many factors that are making speed the major differentiator among businesses today. Instantaneous responses are needed by companies to effectively address the market dynamics. The growth of visual analytics systems that allow operations with continuous data visualization and investigation tools is now popular since they help companies decide on the “spot” things. When trying to find something that exemplifies this pattern the most, there are several directions that stand out above the rest such as money, medical care and e-commerce, where fast decision making is very vital for a success.
Also there are visual analytics programs based on the cloud which are gaining popularity. With the transition into the distributed computing domain, the end-users of the visual analytics market are able to enjoy the benefits of scalability, flexibility and low-cost services being the rudiments of this change. Changes from traditional visual reports to the cloud-based visual analysis stage means customers have accessibility and capability to get and examine information from anywhere so this influences cooperation among participants and sharing the burden of IT infrastructure.
Furthermore, the visual analytics market now involves trending engaging modes of communications. The technological advancement that produced cell phones and tablets has resulted in the need for more visual and easily navigated analytics tools that can be used on the go. Vibrant connection spots and interactive renderings are the elements in standard regarding presenting information visuals on a regular basis across devices.
Another influential theme to the visual analytics market share is self-administration analytics. With the affiliates, the nontechnical users and hard to understand interfaces are now a thing of the past and the consumers are able to create their reports and visualizations on their own without the need for tech division in their respective organizations. This style of information conveyance via official channels individualizes the access to and promotion of information by initiating an “information culture” within these associations.
Be it information’s maintaining and security, it is becoming the pivotal theme upon which the whole field of visual analytics turns. Providers of such delicate data are under increased surveillance and they have to be responsible regarding showing integrity and safety of the information displayed. Due to the fact vendors’ security enhanced graphics instruments have been used more and more, sellers are now using them to address those challenges. These features include encryption, access management, and performance of security policies.









Leave a Comment