• Cat-intel
  • MedIntelliX
  • Resources
  • About Us
  • Request Free Sample ×

    Kindly complete the form below to receive a free sample of this Report

    Leading companies partner with us for data-driven Insights

    clients tt-cursor

    US Sand Screen Market

    ID: MRFR/E&P/13619-HCR
    100 Pages
    Snehal Singh
    September 2025

    US Sand Screen Market Research Report By Type (Stand Alone, Remedial, Artificial Lift Protection), By Well Type (Land, Offshore), By Application (Oil and Gas, Mining, Construction, Water Treatment, Others), By Mesh Size (Fine, Medium, Coarse), By Material (Steel, Polyurethane, Plastic, Others) and By Installation (New Installation, Retrofit) - Forecast to 2035

    Share:
    Download PDF ×

    We do not share your information with anyone. However, we may send you emails based on your report interest from time to time. You may contact us at any time to opt-out.

    US Sand Screen Market Research Report — Global Forecast till 2035 Infographic
    Purchase Options
    $ 4,950.0
    $ 5,950.0
    $ 7,250.0
    Table of Contents

    US Sand Screen Market Summary

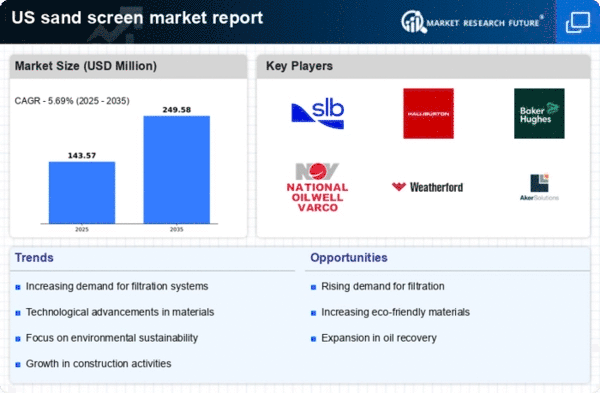
    The US Sand Screen market is projected to grow significantly from 1250 USD Million in 2024 to 2750 USD Million by 2035.

    Key Market Trends & Highlights

    US Sand Screen Key Trends and Highlights

    • The US Sand Screen market is expected to achieve a valuation of 2750 USD Million by 2035, reflecting robust growth.
    • From 2025 to 2035, the market is anticipated to expand at a compound annual growth rate of 7.43 percent.
    • In 2024, the market is valued at 1250 USD Million, indicating a strong foundation for future growth.
    • Growing adoption of advanced filtration technologies due to increasing demand for efficient sand management is a major market driver.

    Market Size & Forecast

    2024 Market Size 1250 (USD Million)
    2035 Market Size 2750 (USD Million)
    CAGR (2025 - 2035) 7.43%

    Major Players

    Apple Inc (US), Microsoft Corp (US), Amazon.com Inc (US), Alphabet Inc (US), Berkshire Hathaway Inc (US), Meta Platforms Inc (US), Tesla Inc (US), Johnson & Johnson (US), Visa Inc (US), Procter & Gamble Co (US)

    US Sand Screen Market Trends

    The US Sand Screen Market is experiencing significant trends driven by the increasing demand for efficient extraction techniques in the oil and gas sector. Utilization of sand screens is growing, especially with the expansion of shale gas and tight oil production. As the US continues to invest in energy independence, the need for advanced completion technologies such as sand screens that prevent sand production and enhance hydrocarbon recovery is becoming pivotal.

    There are numerous opportunities to be explored, particularly in enhancing sand screen technology. With the ongoing innovations in materials, such as composite and high-strength alloys, manufacturers are focusing on creating more durable and efficient products.The focus is also shifting toward customizable solutions that cater to specific site conditions and operational challenges. The push for sustainable practices is encouraging companies to develop sand screen products that support eco-friendly operations while improving overall performance.

    Recent trends show that there is a growing emphasis on automation and monitoring systems, which allow operators to optimize their sand control strategies in real time. Additionally, there’s an increasing trend toward integrated solutions that combine sand control with other completion services. The move towards digitalization in the industry facilitates better data analysis and decision-making, further enhancing the effectiveness of sand screen technologies. Overall, the US Sand Screen Market is evolving with a clear focus on technological advancements, customization, and automation to meet the needs of a changing energy landscape.

    As exploration and production activities expand, the market is poised for continued growth driven by these significant trends.

    US Sand Screen Market Drivers

    Market Segment Insights

    US Sand Screen Market Segment Insights:

    US Sand Screen Market Segment Insights:

    Sand Screen Market Type Insights

    Sand Screen Market Type Insights

    The US Sand Screen Market has shown considerable growth in recent years, attributed to the increasing demand for enhanced oil and gas recovery processes. Among the various segments, the Type segment plays a crucial role in addressing specific industry needs. This market is comprised of different types of sand screens, including Stand Alone, Remedial, and Artificial Lift Protection. Stand Alone screens are significant due to their ability to operate independently in various well conditions, providing reliable filtration that enhances production efficiency while mitigating sand production.

    The versatility of Stand Alone systems allows them to be employed in a wide variety of applications, thereby elevating their usage across different drilling environments.In contrast, Remedial screens focus on intervention strategies aimed at resolving issues related to well productivity and integrity. These systems are vital in providing solutions to existing wells facing operational difficulties, thus allowing for continued resource extraction and minimizing losses caused by downtime. Their relevance in the market stems from the ever-present need for effective maintenance strategies to extend the lifespan of existing oil and gas assets.

    Finally, the Artificial Lift Protection category is particularly critical as it guards expensive artificial lift equipment, such as pumps, against premature failure due to sand production. This is increasingly important in challenging extraction environments where sand can significantly impact overall production efficiency. As the US Sand Screen Market continues to evolve, advancements in technology across these types enhance their effectiveness, leading to improved recovery rates and cost efficiency in oil and gas production. The segment also highlights the broader trends in the energy sector where sustainable practices drive innovation and solutions designed to optimize the lifecycle management of resources.

    Get more detailed insights about US Sand Screen Market Research Report — Global Forecast till 2035

    Regional Insights

    Key Players and Competitive Insights

    The US Sand Screen Market showcases a dynamic landscape characterized by diverse players, innovations, and varying strategies. As a crucial component in the oil and gas industry, sand screens are essential for enhancing well productivity and maintaining well integrity. The competition within this market includes companies that are continually striving to leverage technological advancements and optimize product offerings to meet the increasing demand for effective and durable sand control solutions.

    The insights into this competitive arena reveal significant trends such as an emphasis on research and development, collaboration with end-users for better product designs, and a growing focus on expanding market reach through strategic partnerships and acquisitions.Carbo Ceramics stands out as a key player in the US Sand Screen Market, known for its innovative approaches and high-quality products. The company has integrated advanced technology into its sand screen solutions, which has allowed it to cater to various market needs effectively.

    With a strong focus on customer satisfaction, Carbo Ceramics differentiates itself by emphasizing its commitment to sustainability and environmental responsibility in its manufacturing processes. Their expertise in ceramic proppants and other related materials complements their sand screen offerings, enhancing their overall market presence and appeal. The company's strong reputation for quality and reliability bolsters its position within the market while contributing to a robust customer base in the United States.National Oilwell Varco is another significant entity in the US Sand Screen Market, widely recognized for its extensive range of products and services tailored for the energy sector.

    The company offers a diverse portfolio that includes innovative sand control solutions designed to optimize oil and gas recovery. National Oilwell Varco's strong market presence is supplemented by its ability to provide comprehensive services, including installation, maintenance, and technical support, ensuring that clients receive holistic solutions to their sand screen needs. The company's strategic mergers and acquisitions over the years have further enhanced its capabilities, allowing it to expand its product offerings and improve operational efficiencies.

    By continuously investing in research and development, National Oilwell Varco maintains a competitive edge, constantly evolving its products to meet the dynamic demands of the market in the US.

    Key Companies in the US Sand Screen Market market include

    Industry Developments

    Recent developments in the US Sand Screen Market have shown robust activity, particularly with rising demand in the oil and gas industry as economic recovery takes hold. Companies such as Carbo Ceramics and Baker Hughes have reported significant growth in their market valuations, indicating a positive shift in operational capacity and increased investment in oil exploration and production. Additionally, major players like Schlumberger and Halliburton have expanded their services through technological advancements in sand screen solutions, enhancing efficiency in hydraulic fracturing processes.

    In terms of mergers and acquisitions, March 2023 saw National Oilwell Varco announce its acquisition of a smaller competitor, bolstering its position in the market and expanding its technological portfolio. Similarly, Weatherford International completed a merger with MI SWACO in July 2022, aimed at improving resource management in deep-water drilling projects. The market’s trajectory over the past few years, especially from mid-2021 to 2023, has been characterized by innovation and consolidation among major industry players, reflecting a strategic focus on sustainability and optimized performance in sand management operations.

    Market Segmentation

    Outlook

    • New Installation
    • Retrofit

    Report Scope

    Report Attribute/Metric Source: Details
    MARKET SIZE 2018 116.71(USD Million)
    MARKET SIZE 2024 150.0(USD Million)
    MARKET SIZE 2035 270.0(USD Million)
    COMPOUND ANNUAL GROWTH RATE (CAGR) 5.489% (2025 - 2035)
    REPORT COVERAGE Revenue Forecast, Competitive Landscape, Growth Factors, and Trends
    BASE YEAR 2024
    MARKET FORECAST PERIOD 2025 - 2035
    HISTORICAL DATA 2019 - 2024
    MARKET FORECAST UNITS USD Million
    KEY COMPANIES PROFILED Carbo Ceramics, National Oilwell Varco, Baker Hughes, Cameron International, Pioneer Natural Resources, Target Energy, Tetra Technologies, EPI Group, Oasis Petroleum, Vertex Energy, Weatherford International, Schlumberger, Halliburton, MI SWACO
    SEGMENTS COVERED Type, Well Type, Application, Mesh Size, Material, Installation
    KEY MARKET OPPORTUNITIES Growing hydraulic fracturing demand, Expansion of shale gas production, Increased environmental regulations, Enhanced oil recovery technologies, Rising renewable energy integration
    KEY MARKET DYNAMICS increasing oil demand, technological advancements, regulatory challenges, rising environmental concerns, competitive pricing strategies
    COUNTRIES COVERED US

    Market Highlights

    Author
    Snehal Singh
    Assistant Manager - Research

    High acumen in analyzing complex macro & micro markets with more than 6 years of work experience in the field of market research. By implementing her analytical skills in forecasting and estimation into market research reports, she has expertise in Packaging, Construction, and Equipment domains. She handles a team size of 20-25 resources and ensures smooth running of the projects, associated marketing activities, and client servicing.

    Leave a Comment

    FAQs

    What is the expected market size of the US Sand Screen Market in 2024?

    The US Sand Screen Market is expected to be valued at 150.0 million USD in 2024.

    What will the market size of the US Sand Screen Market be in 2035?

    By 2035, the US Sand Screen Market is anticipated to grow to 270.0 million USD.

    What is the compound annual growth rate (CAGR) for the US Sand Screen Market from 2025 to 2035?

    The CAGR for the US Sand Screen Market during the forecast period from 2025 to 2035 is projected to be 5.489%.

    What are the dominant types in the US Sand Screen Market?

    The dominant types in the market include Stand Alone, Remedial, and Artificial Lift Protection.

    How much is the Stand Alone type projected to be valued in 2035?

    The Stand Alone type in the US Sand Screen Market is projected to be valued at 100.0 million USD in 2035.

    What is the estimated value of the Remedial type in 2024?

    The Remedial type is estimated to be valued at 45.0 million USD in 2024.

    Who are the key players in the US Sand Screen Market?

    Key players in the US Sand Screen Market include Carbo Ceramics, National Oilwell Varco, Baker Hughes, and Schlumberger.

    What will be the value of the Artificial Lift Protection type in 2035?

    The value of the Artificial Lift Protection type in the market is expected to reach 90.0 million USD in 2035.

    What are the main growth drivers for the US Sand Screen Market?

    Main growth drivers include increasing demand for oil and gas exploration and advancements in sand control technologies.

    How do current market trends impact the US Sand Screen Market?

    Current trends towards enhanced oil recovery and sustainable solutions are positively impacting the growth of the US Sand Screen Market.

    1. EXECUTIVE SUMMARY
    2. Market Overview
    3. Key Findings
    4. Market Segmentation
    5. Competitive Landscape
    6. Challenges and Opportunities
    7. Future Outlook
    8. MARKET INTRODUCTION
    9. Definition
    10. Scope of the study
    11. Research Objective
    12. Assumption
    13. Limitations
    14. RESEARCH METHODOLOGY
    15. Overview
    16. Data Mining
    17. Secondary Research
    18. Primary Research
    19. Primary Interviews and Information Gathering Process
    20. Breakdown of Primary Respondents
    21. Forecasting Model
    22. Market Size Estimation
    23. Bottom-Up Approach
    24. Top-Down Approach
    25. Data Triangulation
    26. Validation
    27. MARKET DYNAMICS
    28. Overview
    29. Drivers
    30. Restraints
    31. Opportunities
    32. MARKET FACTOR ANALYSIS
    33. Value chain Analysis
    34. Porter's Five Forces Analysis
    35. Bargaining Power of Suppliers
    36. Bargaining Power of Buyers
    37. Threat of New Entrants
    38. Threat of Substitutes
    39. Intensity of Rivalry
    40. COVID-19 Impact Analysis
    41. Market Impact Analysis
    42. Regional Impact
    43. Opportunity and Threat Analysis
    44. US Sand Screen Market, BY Type (USD Million)
    45. Stand Alone
    46. Remedial
    47. Artificial Lift Protection
    48. US Sand Screen Market, BY Well Type (USD Million)
    49. Land
    50. Offshore
    51. US Sand Screen Market, BY Application (USD Million)
    52. Oil and Gas
    53. Mining
    54. Construction
    55. Water Treatment
    56. Others
    57. US Sand Screen Market, BY Mesh Size (USD Million)
    58. Fine
    59. Medium
    60. Coarse
    61. US Sand Screen Market, BY Material (USD Million)
    62. Steel
    63. Polyurethane
    64. Plastic
    65. Others
    66. US Sand Screen Market, BY Installation (USD Million)
    67. New Installation
    68. Retrofit
    69. Competitive Landscape
    70. Overview
    71. Competitive Analysis
    72. Market share Analysis
    73. Major Growth Strategy in the Sand Screen Market
    74. Competitive Benchmarking
    75. Leading Players in Terms of Number of Developments in the Sand Screen Market
    76. Key developments and growth strategies
    77. New Product Launch/Service Deployment
    78. Merger & Acquisitions
    79. Joint Ventures
    80. Major Players Financial Matrix
    81. Sales and Operating Income
    82. Major Players R&D Expenditure. 2023
    83. Company Profiles
    84. Carbo Ceramics
    85. Financial Overview
    86. Products Offered
    87. Key Developments
    88. SWOT Analysis
    89. Key Strategies
    90. National Oilwell Varco
    91. Financial Overview
    92. Products Offered
    93. Key Developments
    94. SWOT Analysis
    95. Key Strategies
    96. Baker Hughes
    97. Financial Overview
    98. Products Offered
    99. Key Developments
    100. SWOT Analysis
    101. Key Strategies
    102. Cameron International
    103. Financial Overview
    104. Products Offered
    105. Key Developments
    106. SWOT Analysis
    107. Key Strategies
    108. Pioneer Natural Resources
    109. Financial Overview
    110. Products Offered
    111. Key Developments
    112. SWOT Analysis
    113. Key Strategies
    114. Target Energy
    115. Financial Overview
    116. Products Offered
    117. Key Developments
    118. SWOT Analysis
    119. Key Strategies
    120. Tetra Technologies
    121. Financial Overview
    122. Products Offered
    123. Key Developments
    124. SWOT Analysis
    125. Key Strategies
    126. EPI Group
    127. Financial Overview
    128. Products Offered
    129. Key Developments
    130. SWOT Analysis
    131. Key Strategies
    132. Oasis Petroleum
    133. Financial Overview
    134. Products Offered
    135. Key Developments
    136. SWOT Analysis
    137. Key Strategies
    138. Vertex Energy
    139. Financial Overview
    140. Products Offered
    141. Key Developments
    142. SWOT Analysis
    143. Key Strategies
    144. Weatherford International
    145. Financial Overview
    146. Products Offered
    147. Key Developments
    148. SWOT Analysis
    149. Key Strategies
    150. Schlumberger
    151. Financial Overview
    152. Products Offered
    153. Key Developments
    154. SWOT Analysis
    155. Key Strategies
    156. Halliburton
    157. Financial Overview
    158. Products Offered
    159. Key Developments
    160. SWOT Analysis
    161. Key Strategies
    162. MI SWACO
    163. Financial Overview
    164. Products Offered
    165. Key Developments
    166. SWOT Analysis
    167. Key Strategies
    168. References
    169. Related Reports
    170. US Sand Screen Market SIZE ESTIMATES & FORECAST, BY TYPE, 2019-2035 (USD Billions)
    171. US Sand Screen Market SIZE ESTIMATES & FORECAST, BY WELL TYPE, 2019-2035 (USD Billions)
    172. US Sand Screen Market SIZE ESTIMATES & FORECAST, BY APPLICATION, 2019-2035 (USD Billions)
    173. US Sand Screen Market SIZE ESTIMATES & FORECAST, BY MESH SIZE, 2019-2035 (USD Billions)
    174. US Sand Screen Market SIZE ESTIMATES & FORECAST, BY MATERIAL, 2019-2035 (USD Billions)
    175. US Sand Screen Market SIZE ESTIMATES & FORECAST, BY INSTALLATION, 2019-2035 (USD Billions)
    176. PRODUCT LAUNCH/PRODUCT DEVELOPMENT/APPROVAL
    177. ACQUISITION/PARTNERSHIP
    178. MARKET SYNOPSIS
    179. US SAND SCREEN MARKET ANALYSIS BY TYPE
    180. US SAND SCREEN MARKET ANALYSIS BY WELL TYPE
    181. US SAND SCREEN MARKET ANALYSIS BY APPLICATION
    182. US SAND SCREEN MARKET ANALYSIS BY MESH SIZE
    183. US SAND SCREEN MARKET ANALYSIS BY MATERIAL
    184. US SAND SCREEN MARKET ANALYSIS BY INSTALLATION
    185. KEY BUYING CRITERIA OF SAND SCREEN MARKET
    186. RESEARCH PROCESS OF MRFR
    187. DRO ANALYSIS OF SAND SCREEN MARKET
    188. DRIVERS IMPACT ANALYSIS: SAND SCREEN MARKET
    189. RESTRAINTS IMPACT ANALYSIS: SAND SCREEN MARKET
    190. SUPPLY / VALUE CHAIN: SAND SCREEN MARKET
    191. SAND SCREEN MARKET, BY TYPE, 2025 (% SHARE)
    192. SAND SCREEN MARKET, BY TYPE, 2019 TO 2035 (USD Billions)
    193. SAND SCREEN MARKET, BY WELL TYPE, 2025 (% SHARE)
    194. SAND SCREEN MARKET, BY WELL TYPE, 2019 TO 2035 (USD Billions)
    195. SAND SCREEN MARKET, BY APPLICATION, 2025 (% SHARE)
    196. SAND SCREEN MARKET, BY APPLICATION, 2019 TO 2035 (USD Billions)
    197. SAND SCREEN MARKET, BY MESH SIZE, 2025 (% SHARE)
    198. SAND SCREEN MARKET, BY MESH SIZE, 2019 TO 2035 (USD Billions)
    199. SAND SCREEN MARKET, BY MATERIAL, 2025 (% SHARE)
    200. SAND SCREEN MARKET, BY MATERIAL, 2019 TO 2035 (USD Billions)
    201. SAND SCREEN MARKET, BY INSTALLATION, 2025 (% SHARE)
    202. SAND SCREEN MARKET, BY INSTALLATION, 2019 TO 2035 (USD Billions)
    203. BENCHMARKING OF MAJOR COMPETITORS

    US Sand Screen Market Segmentation


    • Sand Screen Market By Type (USD Million, 2019-2035)

      • Stand Alone
      • Remedial
      • Artificial Lift Protection


    • Sand Screen Market By Well Type (USD Million, 2019-2035)

      • Land
      • Offshore


    • Sand Screen Market By Application (USD Million, 2019-2035)

      • Oil and Gas
      • Mining
      • Construction
      • Water Treatment
      • Others


    • Sand Screen Market By Mesh Size (USD Million, 2019-2035)

      • Fine
      • Medium
      • Coarse


    • Sand Screen Market By Material (USD Million, 2019-2035)

      • Steel
      • Polyurethane
      • Plastic
      • Others


    • Sand Screen Market By Installation (USD Million, 2019-2035)

      • New Installation
      • Retrofit


    Report Infographic
    Free Sample Request

    Kindly complete the form below to receive a free sample of this Report

    Customer Strories

    “I am very pleased with how market segments have been defined in a relevant way for my purposes (such as "Portable Freezers & refrigerators" and "last-mile"). In general the report is well structured. Thanks very much for your efforts.”

    Victoria Milne Founder
    Case Study

    Chemicals and Materials