Rising Incidence of Skin Cancer
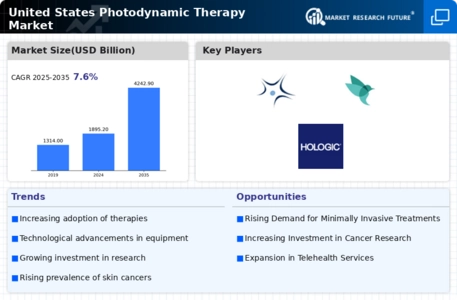
The US Photodynamic Therapy Market is experiencing growth due to the increasing incidence of skin cancer, particularly melanoma. According to the American Cancer Society, skin cancer remains the most common form of cancer in the United States, with over 5 million cases treated annually. This alarming trend has prompted healthcare providers to seek effective treatment options, including photodynamic therapy, which offers a minimally invasive approach with fewer side effects compared to traditional methods. As awareness of skin cancer rises, patients are more likely to explore innovative treatments, thereby driving demand within the US Photodynamic Therapy Market. Furthermore, the potential for photodynamic therapy to be used in combination with other treatments may enhance its appeal, suggesting a promising future for this sector.
Advancements in Photodynamic Agents
Innovations in photodynamic agents are significantly influencing the US Photodynamic Therapy Market. Recent developments have led to the creation of more effective and targeted photosensitizers, which enhance the efficacy of photodynamic therapy. For instance, new agents are being designed to selectively accumulate in cancerous tissues, thereby minimizing damage to surrounding healthy cells. This advancement not only improves treatment outcomes but also reduces recovery times for patients. As a result, healthcare providers are increasingly adopting these advanced agents, contributing to the growth of the US Photodynamic Therapy Market. The ongoing research and development in this area indicate a strong potential for further enhancements, which could lead to broader applications of photodynamic therapy in various cancer types.
Regulatory Approvals and Guidelines
The US Photodynamic Therapy Market is positively impacted by regulatory approvals and guidelines that facilitate the adoption of photodynamic therapy. The US Food and Drug Administration (FDA) has approved several photodynamic agents and devices for clinical use, which has bolstered confidence among healthcare providers and patients alike. These approvals not only validate the safety and efficacy of photodynamic therapy but also encourage further research and development in the field. Additionally, the establishment of clinical guidelines by professional organizations promotes the standardization of treatment protocols, ensuring that patients receive optimal care. As regulatory support continues to evolve, it is expected that the US Photodynamic Therapy Market will expand, with more healthcare facilities integrating photodynamic therapy into their cancer treatment offerings.
Increased Investment in Cancer Treatment
The US Photodynamic Therapy Market is benefiting from increased investment in cancer treatment research and development. Government initiatives, such as the National Cancer Institute's funding programs, are aimed at fostering innovation in cancer therapies, including photodynamic therapy. This financial support encourages collaboration between academic institutions and industry players, leading to the development of novel treatment modalities. Moreover, venture capital investments in biotechnology firms focused on photodynamic therapy are on the rise, reflecting a growing confidence in the market's potential. As funding continues to flow into this sector, it is likely that advancements in photodynamic therapy will accelerate, further solidifying its position within the US Photodynamic Therapy Market.
Growing Demand for Minimally Invasive Procedures
The US Photodynamic Therapy Market is witnessing a surge in demand for minimally invasive procedures, driven by patient preferences for less traumatic treatment options. Photodynamic therapy, which utilizes light to activate photosensitizing agents, offers a non-surgical alternative for treating various cancers, particularly skin and superficial tumors. Patients are increasingly seeking therapies that promise quicker recovery times and reduced pain, making photodynamic therapy an attractive option. This shift in patient expectations is prompting healthcare providers to incorporate photodynamic therapy into their treatment protocols, thereby expanding its presence in the US Photodynamic Therapy Market. As the trend towards minimally invasive treatments continues, the market is likely to experience sustained growth.


