• Cat-intel
  • MedIntelliX
  • Resources
  • About Us
  • Request Free Sample ×

    Kindly complete the form below to receive a free sample of this Report

    Leading companies partner with us for data-driven Insights

    clients tt-cursor

    Supply Chain Visibility Software Market

    ID: MRFR/AM/39251-HCR
    100 Pages
    Swapnil Palwe
    September 2025

    Supply Chain Visibility Software Market Research Report By Deployment Type (Cloud-Based, On-Premises, Hybrid), By Functionality (Transportation Management, Inventory Management, Order Management, Data Management), By End User (Manufacturing, Retail, Logistics, Healthcare), By Subscription Model (Monthly, Annual, One-Time License) and By Regional (North America, Europe, South America, Asia Pacific, Middle East and Africa) - Forecast to 2032

    Share:
    Download PDF ×

    We do not share your information with anyone. However, we may send you emails based on your report interest from time to time. You may contact us at any time to opt-out.

    Supply Chain Visibility Software Market Research Report – Global Forecast till 2032 Infographic
    Purchase Options
    $ 4,950.0
    $ 5,950.0
    $ 7,250.0
    Table of Contents

    Supply Chain Visibility Software Market Summary

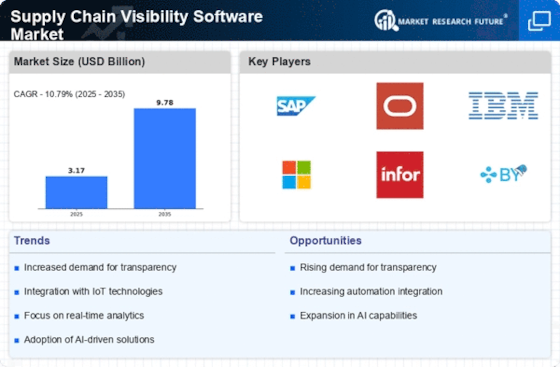
    The Global Supply Chain Visibility Software Market is projected to grow from 3.13 USD Billion in 2024 to 9.79 USD Billion by 2035, reflecting a robust growth trajectory.

    Key Market Trends & Highlights

    Supply Chain Visibility Software Key Trends and Highlights

    • The market is expected to experience a compound annual growth rate (CAGR) of 10.92% from 2025 to 2035.
    • By 2035, the market valuation is anticipated to reach 9.79 USD Billion, indicating substantial growth potential.
    • In 2024, the market is valued at 3.13 USD Billion, laying a solid foundation for future expansion.
    • Growing adoption of advanced analytics due to the increasing need for real-time data visibility is a major market driver.

    Market Size & Forecast

    2024 Market Size 3.13 (USD Billion)
    2035 Market Size 9.79 (USD Billion)
    CAGR (2025-2035) 10.92%

    Major Players

    Oracle, Infor, Parcel Pending, FourKites, Transporeon, Manhattan Associates, SAP Ariba, SAP, Shipwell, ClearMetal, IBM, Blue Yonder, Project44, Logility, JDA Software

    Supply Chain Visibility Software Market Trends

    The growing need for real-time data and more transparency among supply chain participants is propelling the Supply Chain Visibility Software Market's notable expansion. Businesses are realizing that increased visibility can result in better risk management and decision-making.

    Businesses are looking for solutions that can track shipments, keep an eye on inventory levels, and anticipate any interruptions as international trade grows more complicated. Businesses are managing their supply chains differently as a result of this increased emphasis on responsiveness and efficiency, which is streamlining processes.

    This changing environment offers a number of opportunities, especially when cutting-edge technology like blockchain and artificial intelligence are integrated. Companies can use these technologies to improve supply chain accountability and traceability even more.

    As businesses work to satisfy consumer demands for quicker delivery times and more transparency about the origins of products, the advent of e-commerce and shifts in consumer behavior also offer growth opportunities.

    There's an increasing push for sustainability, prompting businesses to adopt software solutions that help monitor the environmental impact of their supply chains. Recent trends indicate a shift toward more collaborative platforms that facilitate better communication between suppliers, manufacturers, and logistics providers.

    The focus is shifting from mere tracking to comprehensive management, allowing businesses to gain insights and adapt their strategies quickly. There is also an emphasis on mobile access, enabling stakeholders to monitor supply chain activities on the go.

    Moreover, the growing importance placed on customer experience is pushing companies to invest in tools that provide end-to-end visibility. As these trends continue to evolve, organizations must adapt to harness the full potential of global supply chain visibility software in an increasingly connected world.

    The increasing complexity of global supply chains necessitates enhanced visibility solutions to mitigate risks and improve operational efficiency.

    U.S. Department of Commerce

    Supply Chain Visibility Software Market Drivers

    Rising Demand for Real-Time Data

    The Global Supply Chain Visibility Software Market Industry experiences a notable surge in demand for real-time data analytics. Companies increasingly seek to enhance their operational efficiency and responsiveness to market changes. This demand is driven by the need for timely insights into supply chain performance, enabling organizations to make informed decisions. For instance, businesses that implement real-time visibility solutions report a reduction in lead times by up to 30 percent. As of 2024, the market is valued at approximately 3.13 USD Billion, indicating a robust growth trajectory as organizations prioritize data-driven strategies.

    Market Segment Insights

    Supply Chain Visibility Software Market Segment Insights

    Supply Chain Visibility Software Market Segment Insights

    Supply Chain Visibility Software Market Deployment Type Insights

    Supply Chain Visibility Software Market Deployment Type Insights

    The Supply Chain Visibility Software Market showed a robust landscape characterized by its Deployment Type segment, which encompassed Cloud-Based, On-Premises, and Hybrid models.

    This segmentation highlighted the Cloud-Based solutions, valued at 1.14 USD Billion in 2023, which are gaining traction due to their scalability, flexibility, and lower upfront costs. As businesses prioritized agility in their supply chain operations, Cloud-Based deployment is poised for significant growth, reaching an expected valuation of 3.01 USD Billion in 2032.

    Cloud solutions dominated the Deployment Type segment primarily because they support real-time data access and collaboration, which was essential for effective supply chain management.

    On the other hand, the On-Premises segment, valued at 1.07 USD Billion in 2023, provided organizations with greater control over their data and infrastructure, making it a significant choice for industries where data security is paramount. The anticipated rise to 2.68 USD Billion in 2032 signifies that while this segment is witnessing stable demand, it may be eclipsed by Cloud-Based models due to changing organizational paradigms toward remote capabilities and streamlining costs.

    Collectively, the Deployment Type insights from the Supply Chain Visibility Software Market data provided a compelling overview of how businesses are adapting their strategies in response to the dynamic requirements of supply chain management, fostering an environment for growth and innovation.

    Source: Primary Research, Secondary Research, Market Research Future Database and Analyst Review

    Supply Chain Visibility Software Market Functionality Insights

    Supply Chain Visibility Software Market Functionality Insights

    The Supply Chain Visibility Software Market, particularly within the Functionality segment, has demonstrated notable growth. This segment encompasses critical functionalities such as Transportation Management, Inventory Management, Order Management, and Data Management, which collectively enhance operational efficiency in supply chains.

    Transportation Management plays a vital role in optimizing logistics and reducing transit times, catering to the increasing demand for swift deliveries. Inventory Management ensures better stock control, aligning supply with consumer demand, thus minimizing excess inventory costs.

    Order Management systems streamline order processing, improving customer satisfaction through timely deliveries and notifications. Data Management serves as the backbone of these functionalities, facilitating data-driven decision-making and transparency across the supply chain.

    The combination of these capabilities positions the Functionality segment as a major component of the overall market growth, reflecting the increasing emphasis on operational efficiency and customer-centric approaches across industries.

    Supply Chain Visibility Software Market End User Insights

    Supply Chain Visibility Software Market End User Insights

    The Supply Chain Visibility Software Market is characterized by diverse end users, including Manufacturing, Retail, Logistics, and Healthcare. The Manufacturing sector plays a vital role, driven by the need for efficiency and real-time tracking, effectively optimizing supply chains and reducing costs.

    The Retail industry significantly contributes to the market as well, where transparency through visibility software is essential for managing inventory and enhancing customer satisfaction. In Logistics, the demand for visibility solutions has surged, enabling businesses to streamline operations and improve delivery accuracy, thereby enhancing overall customer experiences.

    The Healthcare sector, too, is increasingly adopting supply chain visibility solutions to ensure compliance, monitor product integrity, and maintain essential stock levels.

    As the market evolves, the segmentation reflects various industry needs, challenges, and opportunities, contributing to its robust growth trajectory. It underscores the increasing dependence on technology across these sectors for improved operational efficiency and decision-making effectiveness.

    Supply Chain Visibility Software Market Subscription Model Insights

    Supply Chain Visibility Software Market Subscription Model Insights

    The Subscription Model within the Supply Chain Visibility Software Market has evolved significantly. This segment has gained traction due to its flexibility and cost-effectiveness, appealing to businesses aiming for efficient management of their supply chains.

    Monthly and Annual plans are particularly popular, as they allow organizations to adjust their expenses based on operational needs and economic conditions, fostering better financial planning. The One-Time License model, while less common, remains significant for companies preferring long-term ownership without ongoing payments, thereby catering to varying business strategies.

    The market's growth is supported by trends such as the increasing demand for real-time data sharing, advancements in technology, and a greater focus on operational transparency. Challenges include the initial setup costs and the need for continual software updates, which require investment.

    However, opportunities abound as businesses recognize the value of enhanced visibility in minimizing risks and improving decision-making through real-time insights. As the Supply Chain Visibility Software Market continues to expand, these subscription models will play a crucial role in meeting diverse customer needs, ultimately driving market growth.

    Get more detailed insights about Supply Chain Visibility Software Market Research Report – Global Forecast till 2032

    Regional Insights

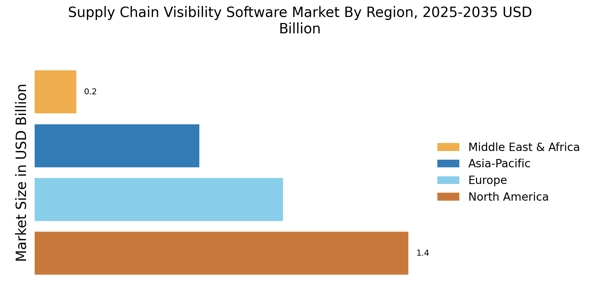
    North America dominated this landscape, holding a valuation of 1.1 USD Billion in 2023, reflecting its critical role in driving industry innovation and demand. Europe followed with a valuation of 0.66 USD Billion, contributing significantly to the market's expansion through enhanced regulatory compliance and sustainability initiatives.

    The APAC region, valued at 0.587 USD Billion, showcased the rapid adoption of supply chain technologies driven by emerging economies.

     South America, while smaller with a valuation of 0.293 USD Billion, offered growth potential due to increasing investments in infrastructure. MEA, valued at 0.22 USD Billion, presented unique opportunities, particularly through advancements in logistics and supply chain management.

    Collectively, these statistics showcased the varied landscape of the Supply Chain Visibility Software Market revenue, highlighting key regional dynamics and their implications for future market growth. Each region's distinct needs and investments underlined the importance of tailored solutions in addressing local challenges and opportunities within the supply chain visibility framework.

    Supply Chain Visibility Software Market Regional Insights

    Source: Primary Research, Secondary Research, Market Research Future Database and Analyst Review

    Key Players and Competitive Insights

    The Supply Chain Visibility Software Market is an increasingly vital segment shaping the landscape of modern logistics and supply chain management. As organizations face the complexities of global trade, changing consumer demands, and the need for increased transparency, the demand for robust supply chain visibility software has surged. This software enables businesses to track products, monitor inventory levels, and enhance overall operational efficiency.

    With various players in the market, companies strive to differentiate themselves through innovative features, superior performance, and effective integration with existing systems. An analysis of competitive dynamics reveals diverse strategies employed by key market players, highlighting their strengths, weaknesses, and market positioning, which are crucial for stakeholders and decision-makers looking to optimize their supply chain operations.

    Oracle stands as a formidable player in the Supply Chain Visibility Software Market, boasting a comprehensive suite of solutions that cater to various supply chain needs. Its strength lies in its advanced analytics and real-time visibility features, which empower organizations to make data-driven decisions.

    Oracle's robust integration capabilities allow seamless connectivity with other enterprise applications, enhancing the overall effectiveness of supply chain management. The company provides an extensive range of cloud-based services that facilitate scalable solutions for businesses of all sizes, fostering adaptability in a dynamic market.

    Oracle's commitment to innovation is evident in its regular updates and feature enhancements, ensuring that customers have access to cutting-edge technology to respond to evolving market challenges.

    Infor presents a strong presence in the Supply Chain Visibility Software Market with its specialized solutions tailored for various industries, including manufacturing, wholesale distribution, and healthcare.

    The company's strengths lie in its focus on user-friendly interfaces and industry-specific functionality, enabling businesses to implement software solutions that cater to their unique operational requirements. Infor emphasizes the importance of collaboration and integration throughout the supply chain, offering tools that enhance communication and coordination among stakeholders.

    Its cloud-based offerings provide flexibility and scalability, allowing companies to grow and adapt their supply chain strategies in response to shifting market dynamics. Infor's commitment to leveraging advanced technologies, such as artificial intelligence and machine learning, positions the company as a forward-thinking competitor dedicated to enhancing supply chain visibility and efficiency.

    Key Companies in the Supply Chain Visibility Software Market market include

    Industry Developments

    The Supply Chain Visibility Software Market has been witnessing significant developments recently, particularly with key players such as Oracle, IBM, and SAP enhancing their offerings. Oracle has been focusing on expanding its cloud capabilities to improve visibility across the supply chain.

    IBM's Watson Supply Chain is also gaining traction, offering AI-driven insights that improve decision-making. FourKites has raised substantial funding to enhance its real-time visibility solutions, while Project44 continues to expand its network to provide comprehensive visibility across various modes of transportation.

    In terms of mergers and acquisitions, Manhattan Associates has announced its acquisition of a supply chain analytics firm to bolster its software capabilities. Similarly, SAP Ariba is partnering with Blue Yonder to integrate advanced forecasting functionalities, aiming to provide users with better predictive insights.

    Furthermore, market growth is fueled by the increasing need for real-time data and the demand for improved collaboration across supply chains, reflecting a robust market valuation that is expected to escalate further as companies invest in technology-driven solutions.

    Future Outlook

    Supply Chain Visibility Software Market Future Outlook

    The Supply Chain Visibility Software Market is projected to grow at a 10.92% CAGR from 2024 to 2035, driven by technological advancements, increased demand for transparency, and regulatory compliance.

    New opportunities lie in:

    • Leverage AI-driven analytics to enhance predictive capabilities for supply chain disruptions.
    • Develop integration solutions for IoT devices to improve real-time data visibility.
    • Focus on sustainability features to meet growing regulatory and consumer demands.

    By 2035, the market is expected to be robust, reflecting substantial growth and innovation.

    Market Segmentation

    Supply Chain Visibility Software Market End User Outlook

    • Monthly
    • Annual
    • One-Time License

    Supply Chain Visibility Software Market Regional Outlook

    • North America
    • Europe
    • South America
    • Asia Pacific
    • Middle East and Africa

    Supply Chain Visibility Software Market Functionality Outlook

    • Manufacturing
    • Retail
    • Logistics
    • Healthcare

    Supply Chain Visibility Software Market Deployment Type Outlook

    • Transportation Management
    • Inventory Management
    • Order Management
    • Data Management

    Supply Chain Visibility Software Market Subscription Model Outlook

    • North America
    • Europe
    • South America
    • Asia Pacific
    • Middle East and Africa

    Report Scope

    Report Attribute/Metric Details
    Market Size 2022 2.58 (USD Billion)
    Market Size 2023 2.86 (USD Billion)
    Market Size 2032 7.2 (USD Billion)
    Compound Annual Growth Rate (CAGR) 10.79% (2024 - 2032)
    Report Coverage Revenue Forecast, Competitive Landscape, Growth Factors, and Trends
    Base Year 2023
    Market Forecast Period 2024 - 2032
    Historical Data 2019 - 2023
    Market Forecast Units USD Billion
    Key Companies Profiled Oracle, Infor, Parcel Pending, FourKites, Transporeon, Manhattan Associates, SAP Ariba, SAP, Shipwell, ClearMetal, IBM, Blue Yonder, Project44, Logility, JDA Software
    Segments Covered Deployment Type, Functionality, End User, Subscription Model, Regional
    Key Market Opportunities Increased demand for real-time tracking, Adoption of IoT and AI technologies, Growing e-commerce logistics needs, Rising regulatory compliance requirements, Expansion into emerging markets
    Key Market Dynamics Increased demand for real-time tracking, Integration of AI and IoT technologies, Growing regulatory compliance requirements, Rising need for operational efficiency, Expansion of e-commerce logistics solutions
    Countries Covered North America, Europe, APAC, South America, MEA

    Market Highlights

    Author
    Swapnil Palwe
    Team Lead - Research

    With a technical background as Bachelor's in Mechanical Engineering, with MBA in Operations Management , Swapnil has 6+ years of experience in market research, consulting and analytics with the tasks of data mining, analysis, and project execution. He is the POC for our clients, for their consulting projects running under the Automotive/A&D domain. Swapnil has worked on major projects in verticals such as Aerospace & Defense, Automotive and many other domain projects. He has worked on projects for fortune 500 companies' syndicate and consulting projects along with several government projects.

    Leave a Comment

    FAQs

    What is the projected market size of the Supply Chain Visibility Software Market by 2032?

    The Supply Chain Visibility Software Market is projected to reach a value of 7.2 USD Billion by 2032.

    What is the expected compound annual growth rate (CAGR) for the Supply Chain Visibility Software Market from 2024 to 2032?

    The expected CAGR for the Supply Chain Visibility Software Market is 10.79% from 2024 to 2032.

    Which region is expected to have the highest market value in 2032?

    North America is expected to have the highest market value, reaching 2.682 USD Billion in 2032.

    What will the market value for Cloud-Based deployment be by 2032?

    The market value for Cloud-Based deployment is expected to reach 3.01 USD Billion by 2032.

    How much is the On-Premises segment valued in 2023, and what is its projected value in 2032?

    The On-Premises segment was valued at 1.07 USD Billion in 2023 and is projected to be 2.68 USD Billion in 2032.

    Who are the key players in the Supply Chain Visibility Software Market?

    Key players in the Supply Chain Visibility Software Market include Oracle, IBM, SAP, and Manhattan Associates.

    What is the anticipated market growth in the APAC region from 2023 to 2032?

    The APAC region is expected to grow from 0.587 USD Billion in 2023 to 1.553 USD Billion in 2032.

    What are some emerging trends impacting the Supply Chain Visibility Software Market?

    Emerging trends include increased adoption of cloud solutions and enhanced data analytics capabilities.

    What is the estimated market value for the Hybrid deployment type by 2032?

    The Hybrid deployment type is estimated to reach a market value of 1.61 USD Billion by 2032.

    What is the market size for South America by the year 2032?

    The market size for South America is projected to be 0.706 USD Billion by 2032.

    1. 'TABLE OF CONTENTS
    2. EXECUTIVE SUMMARY
    3. Market Overview
      1. Key Findings
      2. Market Segmentation
    4. Competitive Landscape
      1. Challenges and Opportunities
      2. Future Outlook
    5. MARKET INTRODUCTION
      1. Definition
      2. Scope of the study
        1. Research Objective
        2. Assumption
        3. Limitations
    6. RESEARCH METHODOLOGY
      1. Overview
    7. Data Mining
      1. Secondary Research
      2. Primary Research
    8. Primary Interviews and Information Gathering Process
      1. Breakdown of Primary
    9. Respondents
      1. Forecasting Model
      2. Market Size Estimation
    10. Bottom-Up Approach
      1. Top-Down Approach
      2. Data Triangulation
      3. Validation
    11. MARKET DYNAMICS
      1. Overview
      2. Drivers
      3. Restraints
      4. Opportunities
    12. MARKET FACTOR ANALYSIS
      1. Value chain Analysis
      2. Porter''s Five Forces
    13. Analysis
      1. Bargaining Power of Suppliers
        1. Bargaining Power
    14. of Buyers
      1. Threat of New Entrants
        1. Threat of Substitutes
        2. Intensity of Rivalry
      2. COVID-19 Impact Analysis
    15. Market Impact Analysis
      1. Regional Impact
        1. Opportunity and
    16. Threat Analysis
    17. SUPPLY CHAIN VISIBILITY SOFTWARE MARKET,
    18. BY DEPLOYMENT TYPE (USD BILLION)
      1. Cloud-Based
      2. On-Premises
      3. Hybrid
    19. SUPPLY CHAIN VISIBILITY SOFTWARE MARKET, BY FUNCTIONALITY
    20. (USD BILLION)
      1. Transportation Management
      2. Inventory Management
      3. Order Management
      4. Data Management
    21. SUPPLY CHAIN VISIBILITY
    22. SOFTWARE MARKET, BY END USER (USD BILLION)
      1. Manufacturing
      2. Retail
      3. Logistics
      4. Healthcare
    23. SUPPLY CHAIN VISIBILITY SOFTWARE
    24. MARKET, BY SUBSCRIPTION MODEL (USD BILLION)
      1. Monthly
      2. Annual
      3. One-Time License
    25. SUPPLY CHAIN VISIBILITY SOFTWARE MARKET, BY
    26. REGIONAL (USD BILLION)
      1. North America
        1. US
    27. Canada
      1. Europe
        1. Germany
        2. UK
        3. France
        4. Russia
        5. Italy
        6. Spain
        7. Rest
    28. of Europe
      1. APAC
        1. China
        2. India
    29. Japan
      1. South Korea
        1. Malaysia
        2. Thailand
        3. Indonesia
        4. Rest of APAC
      2. South America
    30. Brazil
      1. Mexico
        1. Argentina
        2. Rest of South
    31. America
      1. MEA
        1. GCC Countries
        2. South Africa
        3. Rest of MEA
    32. COMPETITIVE LANDSCAPE
    33. Overview
      1. Competitive Analysis
      2. Market share Analysis
      3. Major Growth Strategy in the Supply Chain Visibility Software Market
      4. Competitive Benchmarking
      5. Leading Players in Terms of Number
    34. of Developments in the Supply Chain Visibility Software Market
      1. Key developments
    35. and growth strategies
      1. New Product Launch/Service Deployment
    36. Merger & Acquisitions
      1. Joint Ventures
      2. Major Players
    37. Financial Matrix
      1. Sales and Operating Income
        1. Major Players
    38. R&D Expenditure. 2023
    39. COMPANY PROFILES
      1. Oracle
    40. Financial Overview
      1. Products Offered
        1. Key Developments
        2. SWOT Analysis
        3. Key Strategies
      2. Infor
    41. Financial Overview
      1. Products Offered
        1. Key Developments
        2. SWOT Analysis
        3. Key Strategies
      2. Parcel Pending
        1. Financial Overview
        2. Products Offered
        3. Key
    42. Developments
      1. SWOT Analysis
        1. Key Strategies
    43. FourKites
      1. Financial Overview
        1. Products Offered
    44. Key Developments
      1. SWOT Analysis
        1. Key Strategies
    45. Transporeon
      1. Financial Overview
        1. Products Offered
        2. Key Developments
        3. SWOT Analysis
        4. Key Strategies
      2. Manhattan Associates
        1. Financial Overview
    46. Products Offered
      1. Key Developments
        1. SWOT Analysis
        2. Key Strategies
      2. SAP Ariba
        1. Financial Overview
        2. Products Offered
        3. Key Developments
        4. SWOT
    47. Analysis
      1. Key Strategies
      2. SAP
        1. Financial Overview
        2. Products Offered
        3. Key Developments
        4. SWOT
    48. Analysis
      1. Key Strategies
      2. Shipwell
        1. Financial
    49. Overview
      1. Products Offered
        1. Key Developments
    50. SWOT Analysis
      1. Key Strategies
      2. ClearMetal
    51. Financial Overview
      1. Products Offered
        1. Key Developments
        2. SWOT Analysis
        3. Key Strategies
      2. IBM
        1. Financial Overview
        2. Products Offered
        3. Key
    52. Developments
      1. SWOT Analysis
        1. Key Strategies
    53. Blue Yonder
      1. Financial Overview
        1. Products Offered
        2. Key Developments
        3. SWOT Analysis
        4. Key Strategies
      2. Project44
        1. Financial Overview
        2. Products
    54. Offered
      1. Key Developments
        1. SWOT Analysis
    55. Key Strategies
      1. Logility
        1. Financial Overview
    56. Products Offered
      1. Key Developments
        1. SWOT Analysis
        2. Key Strategies
      2. JDA Software
        1. Financial Overview
        2. Products Offered
        3. Key Developments
        4. SWOT
    57. Analysis
      1. Key Strategies
    58. APPENDIX
      1. References
      2. Related Reports
    59. & FORECAST, BY DEPLOYMENT TYPE, 2019-2032 (USD BILLIONS)
    60. AMERICA SUPPLY CHAIN VISIBILITY SOFTWARE MARKET SIZE ESTIMATES & FORECAST, BY
    61. FUNCTIONALITY, 2019-2032 (USD BILLIONS)
    62. VISIBILITY SOFTWARE MARKET SIZE ESTIMATES & FORECAST, BY END USER, 2019-2032
    63. (USD BILLIONS)
    64. SIZE ESTIMATES & FORECAST, BY SUBSCRIPTION MODEL, 2019-2032 (USD BILLIONS)
    65. & FORECAST, BY REGIONAL, 2019-2032 (USD BILLIONS)
    66. VISIBILITY SOFTWARE MARKET SIZE ESTIMATES & FORECAST, BY DEPLOYMENT TYPE, 2019-2032
    67. (USD BILLIONS)
    68. & FORECAST, BY FUNCTIONALITY, 2019-2032 (USD BILLIONS)
    69. CHAIN VISIBILITY SOFTWARE MARKET SIZE ESTIMATES & FORECAST, BY END USER, 2019-2032
    70. (USD BILLIONS)
    71. & FORECAST, BY SUBSCRIPTION MODEL, 2019-2032 (USD BILLIONS)
    72. US SUPPLY CHAIN VISIBILITY SOFTWARE MARKET SIZE ESTIMATES & FORECAST, BY REGIONAL,
    73. 2032 (USD BILLIONS)
    74. MARKET SIZE ESTIMATES & FORECAST, BY DEPLOYMENT TYPE, 2019-2032 (USD BILLIONS)
    75. FORECAST, BY FUNCTIONALITY, 2019-2032 (USD BILLIONS)
    76. CHAIN VISIBILITY SOFTWARE MARKET SIZE ESTIMATES & FORECAST, BY END USER, 2019-2032
    77. (USD BILLIONS)
    78. ESTIMATES & FORECAST, BY SUBSCRIPTION MODEL, 2019-2032 (USD BILLIONS)
    79. CANADA SUPPLY CHAIN VISIBILITY SOFTWARE MARKET SIZE ESTIMATES & FORECAST,
    80. BY REGIONAL, 2019-2032 (USD BILLIONS)
    81. SOFTWARE MARKET SIZE ESTIMATES & FORECAST, BY DEPLOYMENT TYPE, 2019-2032 (USD
    82. BILLIONS)
    83. & FORECAST, BY FUNCTIONALITY, 2019-2032 (USD BILLIONS)
    84. SUPPLY CHAIN VISIBILITY SOFTWARE MARKET SIZE ESTIMATES & FORECAST, BY END USER,
    85. 2032 (USD BILLIONS)
    86. MARKET SIZE ESTIMATES & FORECAST, BY SUBSCRIPTION MODEL, 2019-2032 (USD BILLIONS)
    87. FORECAST, BY REGIONAL, 2019-2032 (USD BILLIONS)
    88. VISIBILITY SOFTWARE MARKET SIZE ESTIMATES & FORECAST, BY DEPLOYMENT TYPE, 2019-2032
    89. (USD BILLIONS)
    90. ESTIMATES & FORECAST, BY FUNCTIONALITY, 2019-2032 (USD BILLIONS)
    91. GERMANY SUPPLY CHAIN VISIBILITY SOFTWARE MARKET SIZE ESTIMATES & FORECAST,
    92. BY END USER, 2019-2032 (USD BILLIONS)
    93. SOFTWARE MARKET SIZE ESTIMATES & FORECAST, BY SUBSCRIPTION MODEL, 2019-2032
    94. (USD BILLIONS)
    95. ESTIMATES & FORECAST, BY REGIONAL, 2019-2032 (USD BILLIONS)
    96. UK SUPPLY CHAIN VISIBILITY SOFTWARE MARKET SIZE ESTIMATES & FORECAST, BY DEPLOYMENT
    97. TYPE, 2019-2032 (USD BILLIONS)
    98. MARKET SIZE ESTIMATES & FORECAST, BY FUNCTIONALITY, 2019-2032 (USD BILLIONS)
    99. FORECAST, BY END USER, 2019-2032 (USD BILLIONS)
    100. VISIBILITY SOFTWARE MARKET SIZE ESTIMATES & FORECAST, BY SUBSCRIPTION MODEL,
    101. 2032 (USD BILLIONS)
    102. SIZE ESTIMATES & FORECAST, BY REGIONAL, 2019-2032 (USD BILLIONS)
    103. FRANCE SUPPLY CHAIN VISIBILITY SOFTWARE MARKET SIZE ESTIMATES & FORECAST,
    104. BY DEPLOYMENT TYPE, 2019-2032 (USD BILLIONS)
    105. VISIBILITY SOFTWARE MARKET SIZE ESTIMATES & FORECAST, BY FUNCTIONALITY, 2019-2032
    106. (USD BILLIONS)
    107. ESTIMATES & FORECAST, BY END USER, 2019-2032 (USD BILLIONS)
    108. FRANCE SUPPLY CHAIN VISIBILITY SOFTWARE MARKET SIZE ESTIMATES & FORECAST, BY
    109. SUBSCRIPTION MODEL, 2019-2032 (USD BILLIONS)
    110. VISIBILITY SOFTWARE MARKET SIZE ESTIMATES & FORECAST, BY REGIONAL, 2019-2032
    111. (USD BILLIONS)
    112. ESTIMATES & FORECAST, BY DEPLOYMENT TYPE, 2019-2032 (USD BILLIONS)
    113. RUSSIA SUPPLY CHAIN VISIBILITY SOFTWARE MARKET SIZE ESTIMATES & FORECAST,
    114. BY FUNCTIONALITY, 2019-2032 (USD BILLIONS)
    115. SOFTWARE MARKET SIZE ESTIMATES & FORECAST, BY END USER, 2019-2032 (USD BILLIONS)
    116. FORECAST, BY SUBSCRIPTION MODEL, 2019-2032 (USD BILLIONS)
    117. SUPPLY CHAIN VISIBILITY SOFTWARE MARKET SIZE ESTIMATES & FORECAST, BY REGIONAL,
    118. 2032 (USD BILLIONS)
    119. MARKET SIZE ESTIMATES & FORECAST, BY DEPLOYMENT TYPE, 2019-2032 (USD BILLIONS)
    120. FORECAST, BY FUNCTIONALITY, 2019-2032 (USD BILLIONS)
    121. CHAIN VISIBILITY SOFTWARE MARKET SIZE ESTIMATES & FORECAST, BY END USER, 2019-2032
    122. (USD BILLIONS)
    123. ESTIMATES & FORECAST, BY SUBSCRIPTION MODEL, 2019-2032 (USD BILLIONS)
    124. ITALY SUPPLY CHAIN VISIBILITY SOFTWARE MARKET SIZE ESTIMATES & FORECAST,
    125. BY REGIONAL, 2019-2032 (USD BILLIONS)
    126. SOFTWARE MARKET SIZE ESTIMATES & FORECAST, BY DEPLOYMENT TYPE, 2019-2032 (USD
    127. BILLIONS)
    128. & FORECAST, BY FUNCTIONALITY, 2019-2032 (USD BILLIONS)
    129. SUPPLY CHAIN VISIBILITY SOFTWARE MARKET SIZE ESTIMATES & FORECAST, BY END USER,
    130. 2032 (USD BILLIONS)
    131. MARKET SIZE ESTIMATES & FORECAST, BY SUBSCRIPTION MODEL, 2019-2032 (USD BILLIONS)
    132. FORECAST, BY REGIONAL, 2019-2032 (USD BILLIONS)
    133. CHAIN VISIBILITY SOFTWARE MARKET SIZE ESTIMATES & FORECAST, BY DEPLOYMENT TYPE,
    134. 2032 (USD BILLIONS)
    135. SOFTWARE MARKET SIZE ESTIMATES & FORECAST, BY FUNCTIONALITY, 2019-2032 (USD
    136. BILLIONS)
    137. SIZE ESTIMATES & FORECAST, BY END USER, 2019-2032 (USD BILLIONS)
    138. REST OF EUROPE SUPPLY CHAIN VISIBILITY SOFTWARE MARKET SIZE ESTIMATES &
    139. FORECAST, BY SUBSCRIPTION MODEL, 2019-2032 (USD BILLIONS)
    140. EUROPE SUPPLY CHAIN VISIBILITY SOFTWARE MARKET SIZE ESTIMATES & FORECAST, BY
    141. REGIONAL, 2019-2032 (USD BILLIONS)
    142. SOFTWARE MARKET SIZE ESTIMATES & FORECAST, BY DEPLOYMENT TYPE, 2019-2032 (USD
    143. BILLIONS)
    144. & FORECAST, BY FUNCTIONALITY, 2019-2032 (USD BILLIONS)
    145. SUPPLY CHAIN VISIBILITY SOFTWARE MARKET SIZE ESTIMATES & FORECAST, BY END USER,
    146. 2032 (USD BILLIONS)
    147. SIZE ESTIMATES & FORECAST, BY SUBSCRIPTION MODEL, 2019-2032 (USD BILLIONS)
    148. BY REGIONAL, 2019-2032 (USD BILLIONS)
    149. SOFTWARE MARKET SIZE ESTIMATES & FORECAST, BY DEPLOYMENT TYPE, 2019-2032 (USD
    150. BILLIONS)
    151. & FORECAST, BY FUNCTIONALITY, 2019-2032 (USD BILLIONS)
    152. SUPPLY CHAIN VISIBILITY SOFTWARE MARKET SIZE ESTIMATES & FORECAST, BY END USER,
    153. 2032 (USD BILLIONS)
    154. MARKET SIZE ESTIMATES & FORECAST, BY SUBSCRIPTION MODEL, 2019-2032 (USD BILLIONS)
    155. FORECAST, BY REGIONAL, 2019-2032 (USD BILLIONS)
    156. VISIBILITY SOFTWARE MARKET SIZE ESTIMATES & FORECAST, BY DEPLOYMENT TYPE, 2019-2032
    157. (USD BILLIONS)
    158. ESTIMATES & FORECAST, BY FUNCTIONALITY, 2019-2032 (USD BILLIONS)
    159. INDIA SUPPLY CHAIN VISIBILITY SOFTWARE MARKET SIZE ESTIMATES & FORECAST,
    160. BY END USER, 2019-2032 (USD BILLIONS)
    161. SOFTWARE MARKET SIZE ESTIMATES & FORECAST, BY SUBSCRIPTION MODEL, 2019-2032
    162. (USD BILLIONS)
    163. ESTIMATES & FORECAST, BY REGIONAL, 2019-2032 (USD BILLIONS)
    164. JAPAN SUPPLY CHAIN VISIBILITY SOFTWARE MARKET SIZE ESTIMATES & FORECAST, BY
    165. DEPLOYMENT TYPE, 2019-2032 (USD BILLIONS)
    166. SOFTWARE MARKET SIZE ESTIMATES & FORECAST, BY FUNCTIONALITY, 2019-2032 (USD
    167. BILLIONS)
    168. & FORECAST, BY END USER, 2019-2032 (USD BILLIONS)
    169. CHAIN VISIBILITY SOFTWARE MARKET SIZE ESTIMATES & FORECAST, BY SUBSCRIPTION
    170. MODEL, 2019-2032 (USD BILLIONS)
    171. MARKET SIZE ESTIMATES & FORECAST, BY REGIONAL, 2019-2032 (USD BILLIONS)
    172. FORECAST, BY DEPLOYMENT TYPE, 2019-2032 (USD BILLIONS)
    173. SUPPLY CHAIN VISIBILITY SOFTWARE MARKET SIZE ESTIMATES & FORECAST, BY FUNCTIONALITY,
    174. 2032 (USD BILLIONS)
    175. MARKET SIZE ESTIMATES & FORECAST, BY END USER, 2019-2032 (USD BILLIONS)
    176. FORECAST, BY SUBSCRIPTION MODEL, 2019-2032 (USD BILLIONS)
    177. KOREA SUPPLY CHAIN VISIBILITY SOFTWARE MARKET SIZE ESTIMATES & FORECAST, BY
    178. REGIONAL, 2019-2032 (USD BILLIONS)
    179. SOFTWARE MARKET SIZE ESTIMATES & FORECAST, BY DEPLOYMENT TYPE, 2019-2032 (USD
    180. BILLIONS)
    181. ESTIMATES & FORECAST, BY FUNCTIONALITY, 2019-2032 (USD BILLIONS)
    182. MALAYSIA SUPPLY CHAIN VISIBILITY SOFTWARE MARKET SIZE ESTIMATES & FORECAST,
    183. BY END USER, 2019-2032 (USD BILLIONS)
    184. SOFTWARE MARKET SIZE ESTIMATES & FORECAST, BY SUBSCRIPTION MODEL, 2019-2032
    185. (USD BILLIONS)
    186. SIZE ESTIMATES & FORECAST, BY REGIONAL, 2019-2032 (USD BILLIONS)
    187. THAILAND SUPPLY CHAIN VISIBILITY SOFTWARE MARKET SIZE ESTIMATES & FORECAST,
    188. BY DEPLOYMENT TYPE, 2019-2032 (USD BILLIONS)
    189. VISIBILITY SOFTWARE MARKET SIZE ESTIMATES & FORECAST, BY FUNCTIONALITY, 2019-2032
    190. (USD BILLIONS)
    191. SIZE ESTIMATES & FORECAST, BY END USER, 2019-2032 (USD BILLIONS)
    192. THAILAND SUPPLY CHAIN VISIBILITY SOFTWARE MARKET SIZE ESTIMATES & FORECAST,
    193. BY SUBSCRIPTION MODEL, 2019-2032 (USD BILLIONS)
    194. CHAIN VISIBILITY SOFTWARE MARKET SIZE ESTIMATES & FORECAST, BY REGIONAL, 2019-2032
    195. (USD BILLIONS)
    196. SIZE ESTIMATES & FORECAST, BY DEPLOYMENT TYPE, 2019-2032 (USD BILLIONS)
    197. FORECAST, BY FUNCTIONALITY, 2019-2032 (USD BILLIONS)
    198. CHAIN VISIBILITY SOFTWARE MARKET SIZE ESTIMATES & FORECAST, BY END USER, 2019-2032
    199. (USD BILLIONS)
    200. SIZE ESTIMATES & FORECAST, BY SUBSCRIPTION MODEL, 2019-2032 (USD BILLIONS)
    201. FORECAST, BY REGIONAL, 2019-2032 (USD BILLIONS)
    202. CHAIN VISIBILITY SOFTWARE MARKET SIZE ESTIMATES & FORECAST, BY DEPLOYMENT TYPE,
    203. 2032 (USD BILLIONS)
    204. MARKET SIZE ESTIMATES & FORECAST, BY FUNCTIONALITY, 2019-2032 (USD BILLIONS)
    205. & FORECAST, BY END USER, 2019-2032 (USD BILLIONS)
    206. SUPPLY CHAIN VISIBILITY SOFTWARE MARKET SIZE ESTIMATES & FORECAST, BY SUBSCRIPTION
    207. MODEL, 2019-2032 (USD BILLIONS)
    208. SOFTWARE MARKET SIZE ESTIMATES & FORECAST, BY REGIONAL, 2019-2032 (USD BILLIONS)
    209. & FORECAST, BY DEPLOYMENT TYPE, 2019-2032 (USD BILLIONS)
    210. AMERICA SUPPLY CHAIN VISIBILITY SOFTWARE MARKET SIZE ESTIMATES & FORECAST, BY
    211. FUNCTIONALITY, 2019-2032 (USD BILLIONS)
    212. VISIBILITY SOFTWARE MARKET SIZE ESTIMATES & FORECAST, BY END USER, 2019-2032
    213. (USD BILLIONS)
    214. SIZE ESTIMATES & FORECAST, BY SUBSCRIPTION MODEL, 2019-2032 (USD BILLIONS)
    215. & FORECAST, BY REGIONAL, 2019-2032 (USD BILLIONS)
    216. CHAIN VISIBILITY SOFTWARE MARKET SIZE ESTIMATES & FORECAST, BY DEPLOYMENT TYPE,
    217. 2032 (USD BILLIONS)
    218. MARKET SIZE ESTIMATES & FORECAST, BY FUNCTIONALITY, 2019-2032 (USD BILLIONS)
    219. FORECAST, BY END USER, 2019-2032 (USD BILLIONS)
    220. VISIBILITY SOFTWARE MARKET SIZE ESTIMATES & FORECAST, BY SUBSCRIPTION MODEL,
    221. 2032 (USD BILLIONS)
    222. MARKET SIZE ESTIMATES & FORECAST, BY REGIONAL, 2019-2032 (USD BILLIONS)
    223. FORECAST, BY DEPLOYMENT TYPE, 2019-2032 (USD BILLIONS)
    224. CHAIN VISIBILITY SOFTWARE MARKET SIZE ESTIMATES & FORECAST, BY FUNCTIONALITY,
    225. 2032 (USD BILLIONS)
    226. MARKET SIZE ESTIMATES & FORECAST, BY END USER, 2019-2032 (USD BILLIONS)
    227. FORECAST, BY SUBSCRIPTION MODEL, 2019-2032 (USD BILLIONS)
    228. SUPPLY CHAIN VISIBILITY SOFTWARE MARKET SIZE ESTIMATES & FORECAST, BY REGIONAL,
    229. 2032 (USD BILLIONS)
    230. MARKET SIZE ESTIMATES & FORECAST, BY DEPLOYMENT TYPE, 2019-2032 (USD BILLIONS)
    231. & FORECAST, BY FUNCTIONALITY, 2019-2032 (USD BILLIONS)
    232. SUPPLY CHAIN VISIBILITY SOFTWARE MARKET SIZE ESTIMATES & FORECAST, BY END USER,
    233. 2032 (USD BILLIONS)
    234. MARKET SIZE ESTIMATES & FORECAST, BY SUBSCRIPTION MODEL, 2019-2032 (USD BILLIONS)
    235. & FORECAST, BY REGIONAL, 2019-2032 (USD BILLIONS)
    236. AMERICA SUPPLY CHAIN VISIBILITY SOFTWARE MARKET SIZE ESTIMATES & FORECAST, BY
    237. DEPLOYMENT TYPE, 2019-2032 (USD BILLIONS)
    238. SUPPLY CHAIN VISIBILITY SOFTWARE MARKET SIZE ESTIMATES & FORECAST, BY FUNCTIONALITY,
    239. 2032 (USD BILLIONS)
    240. SOFTWARE MARKET SIZE ESTIMATES & FORECAST, BY END USER, 2019-2032 (USD BILLIONS)
    241. ESTIMATES & FORECAST, BY SUBSCRIPTION MODEL, 2019-2032 (USD BILLIONS)
    242. REST OF SOUTH AMERICA SUPPLY CHAIN VISIBILITY SOFTWARE MARKET SIZE ESTIMATES
    243. & FORECAST, BY REGIONAL, 2019-2032 (USD BILLIONS)
    244. CHAIN VISIBILITY SOFTWARE MARKET SIZE ESTIMATES & FORECAST, BY DEPLOYMENT TYPE,
    245. 2032 (USD BILLIONS)
    246. SIZE ESTIMATES & FORECAST, BY FUNCTIONALITY, 2019-2032 (USD BILLIONS)
    247. MEA SUPPLY CHAIN VISIBILITY SOFTWARE MARKET SIZE ESTIMATES & FORECAST,
    248. BY END USER, 2019-2032 (USD BILLIONS)
    249. SOFTWARE MARKET SIZE ESTIMATES & FORECAST, BY SUBSCRIPTION MODEL, 2019-2032
    250. (USD BILLIONS)
    251. ESTIMATES & FORECAST, BY REGIONAL, 2019-2032 (USD BILLIONS)
    252. GCC COUNTRIES SUPPLY CHAIN VISIBILITY SOFTWARE MARKET SIZE ESTIMATES & FORECAST,
    253. BY DEPLOYMENT TYPE, 2019-2032 (USD BILLIONS)
    254. CHAIN VISIBILITY SOFTWARE MARKET SIZE ESTIMATES & FORECAST, BY FUNCTIONALITY,
    255. 2032 (USD BILLIONS)
    256. SOFTWARE MARKET SIZE ESTIMATES & FORECAST, BY END USER, 2019-2032 (USD BILLIONS)
    257. & FORECAST, BY SUBSCRIPTION MODEL, 2019-2032 (USD BILLIONS)
    258. GCC COUNTRIES SUPPLY CHAIN VISIBILITY SOFTWARE MARKET SIZE ESTIMATES & FORECAST,
    259. BY REGIONAL, 2019-2032 (USD BILLIONS)
    260. VISIBILITY SOFTWARE MARKET SIZE ESTIMATES & FORECAST, BY DEPLOYMENT TYPE, 2019-2032
    261. (USD BILLIONS)
    262. SIZE ESTIMATES & FORECAST, BY FUNCTIONALITY, 2019-2032 (USD BILLIONS)
    263. SOUTH AFRICA SUPPLY CHAIN VISIBILITY SOFTWARE MARKET SIZE ESTIMATES & FORECAST,
    264. BY END USER, 2019-2032 (USD BILLIONS)
    265. VISIBILITY SOFTWARE MARKET SIZE ESTIMATES & FORECAST, BY SUBSCRIPTION MODEL,
    266. 2032 (USD BILLIONS)
    267. MARKET SIZE ESTIMATES & FORECAST, BY REGIONAL, 2019-2032 (USD BILLIONS)
    268. & FORECAST, BY DEPLOYMENT TYPE, 2019-2032 (USD BILLIONS)
    269. OF MEA SUPPLY CHAIN VISIBILITY SOFTWARE MARKET SIZE ESTIMATES & FORECAST, BY
    270. FUNCTIONALITY, 2019-2032 (USD BILLIONS)
    271. VISIBILITY SOFTWARE MARKET SIZE ESTIMATES & FORECAST, BY END USER, 2019-2032
    272. (USD BILLIONS)
    273. SIZE ESTIMATES & FORECAST, BY SUBSCRIPTION MODEL, 2019-2032 (USD BILLIONS)
    274. & FORECAST, BY REGIONAL, 2019-2032 (USD BILLIONS)
    275. DEVELOPMENT/APPROVAL
    276. CHAIN VISIBILITY SOFTWARE MARKET ANALYSIS
    277. SOFTWARE MARKET ANALYSIS BY DEPLOYMENT TYPE
    278. SOFTWARE MARKET ANALYSIS BY FUNCTIONALITY
    279. SOFTWARE MARKET ANALYSIS BY END USER
    280. SOFTWARE MARKET ANALYSIS BY SUBSCRIPTION MODEL
    281. SOFTWARE MARKET ANALYSIS BY REGIONAL
    282. SOFTWARE MARKET ANALYSIS BY DEPLOYMENT TYPE
    283. VISIBILITY SOFTWARE MARKET ANALYSIS BY FUNCTIONALITY
    284. CHAIN VISIBILITY SOFTWARE MARKET ANALYSIS BY END USER
    285. CHAIN VISIBILITY SOFTWARE MARKET ANALYSIS BY SUBSCRIPTION MODEL
    286. CANADA SUPPLY CHAIN VISIBILITY SOFTWARE MARKET ANALYSIS BY REGIONAL
    287. EUROPE SUPPLY CHAIN VISIBILITY SOFTWARE MARKET ANALYSIS
    288. SUPPLY CHAIN VISIBILITY SOFTWARE MARKET ANALYSIS BY DEPLOYMENT TYPE
    289. GERMANY SUPPLY CHAIN VISIBILITY SOFTWARE MARKET ANALYSIS BY FUNCTIONALITY
    290. MODEL
    291. BY REGIONAL
    292. BY DEPLOYMENT TYPE
    293. BY FUNCTIONALITY
    294. BY END USER
    295. BY SUBSCRIPTION MODEL
    296. ANALYSIS BY REGIONAL
    297. ANALYSIS BY DEPLOYMENT TYPE
    298. MARKET ANALYSIS BY FUNCTIONALITY
    299. SOFTWARE MARKET ANALYSIS BY END USER
    300. SOFTWARE MARKET ANALYSIS BY SUBSCRIPTION MODEL
    301. VISIBILITY SOFTWARE MARKET ANALYSIS BY REGIONAL
    302. VISIBILITY SOFTWARE MARKET ANALYSIS BY DEPLOYMENT TYPE
    303. CHAIN VISIBILITY SOFTWARE MARKET ANALYSIS BY FUNCTIONALITY
    304. SUPPLY CHAIN VISIBILITY SOFTWARE MARKET ANALYSIS BY END USER
    305. SUPPLY CHAIN VISIBILITY SOFTWARE MARKET ANALYSIS BY SUBSCRIPTION MODEL
    306. RUSSIA SUPPLY CHAIN VISIBILITY SOFTWARE MARKET ANALYSIS BY REGIONAL
    307. ITALY SUPPLY CHAIN VISIBILITY SOFTWARE MARKET ANALYSIS BY DEPLOYMENT TYPE
    308. MODEL
    309. REGIONAL
    310. BY DEPLOYMENT TYPE
    311. ANALYSIS BY FUNCTIONALITY
    312. MARKET ANALYSIS BY END USER
    313. MARKET ANALYSIS BY SUBSCRIPTION MODEL
    314. SOFTWARE MARKET ANALYSIS BY REGIONAL
    315. VISIBILITY SOFTWARE MARKET ANALYSIS BY DEPLOYMENT TYPE
    316. EUROPE SUPPLY CHAIN VISIBILITY SOFTWARE MARKET ANALYSIS BY FUNCTIONALITY
    317. REST OF EUROPE SUPPLY CHAIN VISIBILITY SOFTWARE MARKET ANALYSIS BY END USER
    318. BY SUBSCRIPTION MODEL
    319. MARKET ANALYSIS BY REGIONAL
    320. MARKET ANALYSIS
    321. BY DEPLOYMENT TYPE
    322. ANALYSIS BY FUNCTIONALITY
    323. MARKET ANALYSIS BY END USER
    324. MARKET ANALYSIS BY SUBSCRIPTION MODEL
    325. SOFTWARE MARKET ANALYSIS BY REGIONAL
    326. SOFTWARE MARKET ANALYSIS BY DEPLOYMENT TYPE
    327. VISIBILITY SOFTWARE MARKET ANALYSIS BY FUNCTIONALITY
    328. CHAIN VISIBILITY SOFTWARE MARKET ANALYSIS BY END USER
    329. CHAIN VISIBILITY SOFTWARE MARKET ANALYSIS BY SUBSCRIPTION MODEL
    330. INDIA SUPPLY CHAIN VISIBILITY SOFTWARE MARKET ANALYSIS BY REGIONAL
    331. JAPAN SUPPLY CHAIN VISIBILITY SOFTWARE MARKET ANALYSIS BY DEPLOYMENT TYPE
    332. MODEL
    333. REGIONAL
    334. BY DEPLOYMENT TYPE
    335. MARKET ANALYSIS BY FUNCTIONALITY
    336. SOFTWARE MARKET ANALYSIS BY END USER
    337. SOFTWARE MARKET ANALYSIS BY SUBSCRIPTION MODEL
    338. CHAIN VISIBILITY SOFTWARE MARKET ANALYSIS BY REGIONAL
    339. SUPPLY CHAIN VISIBILITY SOFTWARE MARKET ANALYSIS BY DEPLOYMENT TYPE
    340. MALAYSIA SUPPLY CHAIN VISIBILITY SOFTWARE MARKET ANALYSIS BY FUNCTIONALITY
    341. MODEL
    342. BY REGIONAL
    343. BY DEPLOYMENT TYPE
    344. ANALYSIS BY FUNCTIONALITY
    345. MARKET ANALYSIS BY END USER
    346. MARKET ANALYSIS BY SUBSCRIPTION MODEL
    347. SOFTWARE MARKET ANALYSIS BY REGIONAL
    348. SOFTWARE MARKET ANALYSIS BY DEPLOYMENT TYPE
    349. VISIBILITY SOFTWARE MARKET ANALYSIS BY FUNCTIONALITY
    350. SUPPLY CHAIN VISIBILITY SOFTWARE MARKET ANALYSIS BY END USER
    351. SUPPLY CHAIN VISIBILITY SOFTWARE MARKET ANALYSIS BY SUBSCRIPTION MODEL
    352. INDONESIA SUPPLY CHAIN VISIBILITY SOFTWARE MARKET ANALYSIS BY REGIONAL
    353. REST OF APAC SUPPLY CHAIN VISIBILITY SOFTWARE MARKET ANALYSIS BY DEPLOYMENT
    354. TYPE
    355. BY FUNCTIONALITY
    356. MARKET ANALYSIS BY END USER
    357. SOFTWARE MARKET ANALYSIS BY SUBSCRIPTION MODEL
    358. CHAIN VISIBILITY SOFTWARE MARKET ANALYSIS BY REGIONAL
    359. SUPPLY CHAIN VISIBILITY SOFTWARE MARKET ANALYSIS
    360. CHAIN VISIBILITY SOFTWARE MARKET ANALYSIS BY DEPLOYMENT TYPE
    361. SUPPLY CHAIN VISIBILITY SOFTWARE MARKET ANALYSIS BY FUNCTIONALITY
    362. BRAZIL SUPPLY CHAIN VISIBILITY SOFTWARE MARKET ANALYSIS BY END USER
    363. BRAZIL SUPPLY CHAIN VISIBILITY SOFTWARE MARKET ANALYSIS BY SUBSCRIPTION MODEL
    364. TYPE
    365. FUNCTIONALITY
    366. BY END USER
    367. BY SUBSCRIPTION MODEL
    368. MARKET ANALYSIS BY REGIONAL
    369. SOFTWARE MARKET ANALYSIS BY DEPLOYMENT TYPE
    370. VISIBILITY SOFTWARE MARKET ANALYSIS BY FUNCTIONALITY
    371. SUPPLY CHAIN VISIBILITY SOFTWARE MARKET ANALYSIS BY END USER
    372. SUPPLY CHAIN VISIBILITY SOFTWARE MARKET ANALYSIS BY SUBSCRIPTION MODEL
    373. ARGENTINA SUPPLY CHAIN VISIBILITY SOFTWARE MARKET ANALYSIS BY REGIONAL
    374. BY DEPLOYMENT TYPE
    375. SOFTWARE MARKET ANALYSIS BY FUNCTIONALITY
    376. SUPPLY CHAIN VISIBILITY SOFTWARE MARKET ANALYSIS BY END USER
    377. OF SOUTH AMERICA SUPPLY CHAIN VISIBILITY SOFTWARE MARKET ANALYSIS BY SUBSCRIPTION
    378. MODEL
    379. ANALYSIS BY REGIONAL
    380. ANALYSIS
    381. ANALYSIS BY DEPLOYMENT TYPE
    382. SOFTWARE MARKET ANALYSIS BY FUNCTIONALITY
    383. CHAIN VISIBILITY SOFTWARE MARKET ANALYSIS BY END USER
    384. SUPPLY CHAIN VISIBILITY SOFTWARE MARKET ANALYSIS BY SUBSCRIPTION MODEL
    385. GCC COUNTRIES SUPPLY CHAIN VISIBILITY SOFTWARE MARKET ANALYSIS BY REGIONAL
    386. BY DEPLOYMENT TYPE
    387. MARKET ANALYSIS BY FUNCTIONALITY
    388. SOFTWARE MARKET ANALYSIS BY END USER
    389. VISIBILITY SOFTWARE MARKET ANALYSIS BY SUBSCRIPTION MODEL
    390. AFRICA SUPPLY CHAIN VISIBILITY SOFTWARE MARKET ANALYSIS BY REGIONAL
    391. REST OF MEA SUPPLY CHAIN VISIBILITY SOFTWARE MARKET ANALYSIS BY DEPLOYMENT
    392. TYPE
    393. BY FUNCTIONALITY
    394. MARKET ANALYSIS BY END USER
    395. SOFTWARE MARKET ANALYSIS BY SUBSCRIPTION MODEL
    396. CHAIN VISIBILITY SOFTWARE MARKET ANALYSIS BY REGIONAL
    397. CRITERIA OF SUPPLY CHAIN VISIBILITY SOFTWARE MARKET
    398. OF MRFR
    399. (% SHARE)
    400. TYPE, 2019 TO 2032 (USD Billions)
    401. MARKET, BY FUNCTIONALITY, 2024 (% SHARE)
    402. SOFTWARE MARKET, BY FUNCTIONALITY, 2019 TO 2032 (USD Billions)
    403. SUPPLY CHAIN VISIBILITY SOFTWARE MARKET, BY END USER, 2024 (% SHARE)
    404. SUPPLY CHAIN VISIBILITY SOFTWARE MARKET, BY END USER, 2019 TO 2032 (USD Billions)
    405. (% SHARE)
    406. MODEL, 2019 TO 2032 (USD Billions)
    407. MARKET, BY REGIONAL, 2024 (% SHARE)
    408. MARKET, BY REGIONAL, 2019 TO 2032 (USD Billions)
    409. OF MAJOR COMPETITORS'

    Supply Chain Visibility Software Market Segmentation


    • Supply Chain Visibility Software Market By Deployment Type (USD Billion, 2019-2032)
      • Cloud-Based
      • On-Premises
      • Hybrid


    • Supply Chain Visibility Software Market By Functionality (USD Billion, 2019-2032)
      • Transportation Management
      • Inventory Management
      • Order Management
      • Data Management


    • Supply Chain Visibility Software Market By End User (USD Billion, 2019-2032)
      • Manufacturing
      • Retail
      • Logistics
      • Healthcare


    • Supply Chain Visibility Software Market By Subscription Model (USD Billion, 2019-2032)
      • Monthly
      • Annual
      • One-Time License


    • Supply Chain Visibility Software Market By Regional (USD Billion, 2019-2032)
      • North America
      • Europe
      • South America
      • Asia Pacific
      • Middle East and Africa


    Supply Chain Visibility Software Market Regional Outlook (USD Billion, 2019-2032)


    • North America Outlook (USD Billion, 2019-2032)
      • North America Supply Chain Visibility Software Market by Deployment Type
        • Cloud-Based
        • On-Premises
        • Hybrid
      • North America Supply Chain Visibility Software Market by Functionality Type
        • Transportation Management
        • Inventory Management
        • Order Management
        • Data Management
      • North America Supply Chain Visibility Software Market by End User Type
        • Manufacturing
        • Retail
        • Logistics
        • Healthcare
      • North America Supply Chain Visibility Software Market by Subscription Model Type
        • Monthly
        • Annual
        • One-Time License
      • North America Supply Chain Visibility Software Market by Regional Type
        • US
        • Canada
      • US Outlook (USD Billion, 2019-2032)
      • US Supply Chain Visibility Software Market by Deployment Type
        • Cloud-Based
        • On-Premises
        • Hybrid
      • US Supply Chain Visibility Software Market by Functionality Type
        • Transportation Management
        • Inventory Management
        • Order Management
        • Data Management
      • US Supply Chain Visibility Software Market by End User Type
        • Manufacturing
        • Retail
        • Logistics
        • Healthcare
      • US Supply Chain Visibility Software Market by Subscription Model Type
        • Monthly
        • Annual
        • One-Time License
      • CANADA Outlook (USD Billion, 2019-2032)
      • CANADA Supply Chain Visibility Software Market by Deployment Type
        • Cloud-Based
        • On-Premises
        • Hybrid
      • CANADA Supply Chain Visibility Software Market by Functionality Type
        • Transportation Management
        • Inventory Management
        • Order Management
        • Data Management
      • CANADA Supply Chain Visibility Software Market by End User Type
        • Manufacturing
        • Retail
        • Logistics
        • Healthcare
      • CANADA Supply Chain Visibility Software Market by Subscription Model Type
        • Monthly
        • Annual
        • One-Time License
      • Europe Outlook (USD Billion, 2019-2032)
        • Europe Supply Chain Visibility Software Market by Deployment Type
          • Cloud-Based
          • On-Premises
          • Hybrid
        • Europe Supply Chain Visibility Software Market by Functionality Type
          • Transportation Management
          • Inventory Management
          • Order Management
          • Data Management
        • Europe Supply Chain Visibility Software Market by End User Type
          • Manufacturing
          • Retail
          • Logistics
          • Healthcare
        • Europe Supply Chain Visibility Software Market by Subscription Model Type
          • Monthly
          • Annual
          • One-Time License
        • Europe Supply Chain Visibility Software Market by Regional Type
          • Germany
          • UK
          • France
          • Russia
          • Italy
          • Spain
          • Rest of Europe
        • GERMANY Outlook (USD Billion, 2019-2032)
        • GERMANY Supply Chain Visibility Software Market by Deployment Type
          • Cloud-Based
          • On-Premises
          • Hybrid
        • GERMANY Supply Chain Visibility Software Market by Functionality Type
          • Transportation Management
          • Inventory Management
          • Order Management
          • Data Management
        • GERMANY Supply Chain Visibility Software Market by End User Type
          • Manufacturing
          • Retail
          • Logistics
          • Healthcare
        • GERMANY Supply Chain Visibility Software Market by Subscription Model Type
          • Monthly
          • Annual
          • One-Time License
        • UK Outlook (USD Billion, 2019-2032)
        • UK Supply Chain Visibility Software Market by Deployment Type
          • Cloud-Based
          • On-Premises
          • Hybrid
        • UK Supply Chain Visibility Software Market by Functionality Type
          • Transportation Management
          • Inventory Management
          • Order Management
          • Data Management
        • UK Supply Chain Visibility Software Market by End User Type
          • Manufacturing
          • Retail
          • Logistics
          • Healthcare
        • UK Supply Chain Visibility Software Market by Subscription Model Type
          • Monthly
          • Annual
          • One-Time License
        • FRANCE Outlook (USD Billion, 2019-2032)
        • FRANCE Supply Chain Visibility Software Market by Deployment Type
          • Cloud-Based
          • On-Premises
          • Hybrid
        • FRANCE Supply Chain Visibility Software Market by Functionality Type
          • Transportation Management
          • Inventory Management
          • Order Management
          • Data Management
        • FRANCE Supply Chain Visibility Software Market by End User Type
          • Manufacturing
          • Retail
          • Logistics
          • Healthcare
        • FRANCE Supply Chain Visibility Software Market by Subscription Model Type
          • Monthly
          • Annual
          • One-Time License
        • RUSSIA Outlook (USD Billion, 2019-2032)
        • RUSSIA Supply Chain Visibility Software Market by Deployment Type
          • Cloud-Based
          • On-Premises
          • Hybrid
        • RUSSIA Supply Chain Visibility Software Market by Functionality Type
          • Transportation Management
          • Inventory Management
          • Order Management
          • Data Management
        • RUSSIA Supply Chain Visibility Software Market by End User Type
          • Manufacturing
          • Retail
          • Logistics
          • Healthcare
        • RUSSIA Supply Chain Visibility Software Market by Subscription Model Type
          • Monthly
          • Annual
          • One-Time License
        • ITALY Outlook (USD Billion, 2019-2032)
        • ITALY Supply Chain Visibility Software Market by Deployment Type
          • Cloud-Based
          • On-Premises
          • Hybrid
        • ITALY Supply Chain Visibility Software Market by Functionality Type
          • Transportation Management
          • Inventory Management
          • Order Management
          • Data Management
        • ITALY Supply Chain Visibility Software Market by End User Type
          • Manufacturing
          • Retail
          • Logistics
          • Healthcare
        • ITALY Supply Chain Visibility Software Market by Subscription Model Type
          • Monthly
          • Annual
          • One-Time License
        • SPAIN Outlook (USD Billion, 2019-2032)
        • SPAIN Supply Chain Visibility Software Market by Deployment Type
          • Cloud-Based
          • On-Premises
          • Hybrid
        • SPAIN Supply Chain Visibility Software Market by Functionality Type
          • Transportation Management
          • Inventory Management
          • Order Management
          • Data Management
        • SPAIN Supply Chain Visibility Software Market by End User Type
          • Manufacturing
          • Retail
          • Logistics
          • Healthcare
        • SPAIN Supply Chain Visibility Software Market by Subscription Model Type
          • Monthly
          • Annual
          • One-Time License
        • REST OF EUROPE Outlook (USD Billion, 2019-2032)
        • REST OF EUROPE Supply Chain Visibility Software Market by Deployment Type
          • Cloud-Based
          • On-Premises
          • Hybrid
        • REST OF EUROPE Supply Chain Visibility Software Market by Functionality Type
          • Transportation Management
          • Inventory Management
          • Order Management
          • Data Management
        • REST OF EUROPE Supply Chain Visibility Software Market by End User Type
          • Manufacturing
          • Retail
          • Logistics
          • Healthcare
        • REST OF EUROPE Supply Chain Visibility Software Market by Subscription Model Type
          • Monthly
          • Annual
          • One-Time License
        • APAC Outlook (USD Billion, 2019-2032)
          • APAC Supply Chain Visibility Software Market by Deployment Type
            • Cloud-Based
            • On-Premises
            • Hybrid
          • APAC Supply Chain Visibility Software Market by Functionality Type
            • Transportation Management
            • Inventory Management
            • Order Management
            • Data Management
          • APAC Supply Chain Visibility Software Market by End User Type
            • Manufacturing
            • Retail
            • Logistics
            • Healthcare
          • APAC Supply Chain Visibility Software Market by Subscription Model Type
            • Monthly
            • Annual
            • One-Time License
          • APAC Supply Chain Visibility Software Market by Regional Type
            • China
            • India
            • Japan
            • South Korea
            • Malaysia
            • Thailand
            • Indonesia
            • Rest of APAC
          • CHINA Outlook (USD Billion, 2019-2032)
          • CHINA Supply Chain Visibility Software Market by Deployment Type
            • Cloud-Based
            • On-Premises
            • Hybrid
          • CHINA Supply Chain Visibility Software Market by Functionality Type
            • Transportation Management
            • Inventory Management
            • Order Management
            • Data Management
          • CHINA Supply Chain Visibility Software Market by End User Type
            • Manufacturing
            • Retail
            • Logistics
            • Healthcare
          • CHINA Supply Chain Visibility Software Market by Subscription Model Type
            • Monthly
            • Annual
            • One-Time License
          • INDIA Outlook (USD Billion, 2019-2032)
          • INDIA Supply Chain Visibility Software Market by Deployment Type
            • Cloud-Based
            • On-Premises
            • Hybrid
          • INDIA Supply Chain Visibility Software Market by Functionality Type
            • Transportation Management
            • Inventory Management
            • Order Management
            • Data Management
          • INDIA Supply Chain Visibility Software Market by End User Type
            • Manufacturing
            • Retail
            • Logistics
            • Healthcare
          • INDIA Supply Chain Visibility Software Market by Subscription Model Type
            • Monthly
            • Annual
            • One-Time License
          • JAPAN Outlook (USD Billion, 2019-2032)
          • JAPAN Supply Chain Visibility Software Market by Deployment Type
            • Cloud-Based
            • On-Premises
            • Hybrid
          • JAPAN Supply Chain Visibility Software Market by Functionality Type
            • Transportation Management
            • Inventory Management
            • Order Management
            • Data Management
          • JAPAN Supply Chain Visibility Software Market by End User Type
            • Manufacturing
            • Retail
            • Logistics
            • Healthcare
          • JAPAN Supply Chain Visibility Software Market by Subscription Model Type
            • Monthly
            • Annual
            • One-Time License
          • SOUTH KOREA Outlook (USD Billion, 2019-2032)
          • SOUTH KOREA Supply Chain Visibility Software Market by Deployment Type
            • Cloud-Based
            • On-Premises
            • Hybrid
          • SOUTH KOREA Supply Chain Visibility Software Market by Functionality Type
            • Transportation Management
            • Inventory Management
            • Order Management
            • Data Management
          • SOUTH KOREA Supply Chain Visibility Software Market by End User Type
            • Manufacturing
            • Retail
            • Logistics
            • Healthcare
          • SOUTH KOREA Supply Chain Visibility Software Market by Subscription Model Type
            • Monthly
            • Annual
            • One-Time License
          • MALAYSIA Outlook (USD Billion, 2019-2032)
          • MALAYSIA Supply Chain Visibility Software Market by Deployment Type
            • Cloud-Based
            • On-Premises
            • Hybrid
          • MALAYSIA Supply Chain Visibility Software Market by Functionality Type
            • Transportation Management
            • Inventory Management
            • Order Management
            • Data Management
          • MALAYSIA Supply Chain Visibility Software Market by End User Type
            • Manufacturing
            • Retail
            • Logistics
            • Healthcare
          • MALAYSIA Supply Chain Visibility Software Market by Subscription Model Type
            • Monthly
            • Annual
            • One-Time License
          • THAILAND Outlook (USD Billion, 2019-2032)
          • THAILAND Supply Chain Visibility Software Market by Deployment Type
            • Cloud-Based
            • On-Premises
            • Hybrid
          • THAILAND Supply Chain Visibility Software Market by Functionality Type
            • Transportation Management
            • Inventory Management
            • Order Management
            • Data Management
          • THAILAND Supply Chain Visibility Software Market by End User Type
            • Manufacturing
            • Retail
            • Logistics
            • Healthcare
          • THAILAND Supply Chain Visibility Software Market by Subscription Model Type
            • Monthly
            • Annual
            • One-Time License
          • INDONESIA Outlook (USD Billion, 2019-2032)
          • INDONESIA Supply Chain Visibility Software Market by Deployment Type
            • Cloud-Based
            • On-Premises
            • Hybrid
          • INDONESIA Supply Chain Visibility Software Market by Functionality Type
            • Transportation Management
            • Inventory Management
            • Order Management
            • Data Management
          • INDONESIA Supply Chain Visibility Software Market by End User Type
            • Manufacturing
            • Retail
            • Logistics
            • Healthcare
          • INDONESIA Supply Chain Visibility Software Market by Subscription Model Type
            • Monthly
            • Annual
            • One-Time License
          • REST OF APAC Outlook (USD Billion, 2019-2032)
          • REST OF APAC Supply Chain Visibility Software Market by Deployment Type
            • Cloud-Based
            • On-Premises
            • Hybrid
          • REST OF APAC Supply Chain Visibility Software Market by Functionality Type
            • Transportation Management
            • Inventory Management
            • Order Management
            • Data Management
          • REST OF APAC Supply Chain Visibility Software Market by End User Type
            • Manufacturing
            • Retail
            • Logistics
            • Healthcare
          • REST OF APAC Supply Chain Visibility Software Market by Subscription Model Type
            • Monthly
            • Annual
            • One-Time License
          • South America Outlook (USD Billion, 2019-2032)
            • South America Supply Chain Visibility Software Market by Deployment Type
              • Cloud-Based
              • On-Premises
              • Hybrid
            • South America Supply Chain Visibility Software Market by Functionality Type
              • Transportation Management
              • Inventory Management
              • Order Management
              • Data Management
            • South America Supply Chain Visibility Software Market by End User Type
              • Manufacturing
              • Retail
              • Logistics
              • Healthcare
            • South America Supply Chain Visibility Software Market by Subscription Model Type
              • Monthly
              • Annual
              • One-Time License
            • South America Supply Chain Visibility Software Market by Regional Type
              • Brazil
              • Mexico
              • Argentina
              • Rest of South America
            • BRAZIL Outlook (USD Billion, 2019-2032)
            • BRAZIL Supply Chain Visibility Software Market by Deployment Type
              • Cloud-Based
              • On-Premises
              • Hybrid
            • BRAZIL Supply Chain Visibility Software Market by Functionality Type
              • Transportation Management
              • Inventory Management
              • Order Management
              • Data Management
            • BRAZIL Supply Chain Visibility Software Market by End User Type
              • Manufacturing
              • Retail
              • Logistics
              • Healthcare
            • BRAZIL Supply Chain Visibility Software Market by Subscription Model Type
              • Monthly
              • Annual
              • One-Time License
            • MEXICO Outlook (USD Billion, 2019-2032)
            • MEXICO Supply Chain Visibility Software Market by Deployment Type
              • Cloud-Based
              • On-Premises
              • Hybrid
            • MEXICO Supply Chain Visibility Software Market by Functionality Type
              • Transportation Management
              • Inventory Management
              • Order Management
              • Data Management
            • MEXICO Supply Chain Visibility Software Market by End User Type
              • Manufacturing
              • Retail
              • Logistics
              • Healthcare
            • MEXICO Supply Chain Visibility Software Market by Subscription Model Type
              • Monthly
              • Annual
              • One-Time License
            • ARGENTINA Outlook (USD Billion, 2019-2032)
            • ARGENTINA Supply Chain Visibility Software Market by Deployment Type
              • Cloud-Based
              • On-Premises
              • Hybrid
            • ARGENTINA Supply Chain Visibility Software Market by Functionality Type
              • Transportation Management
              • Inventory Management
              • Order Management
              • Data Management
            • ARGENTINA Supply Chain Visibility Software Market by End User Type
              • Manufacturing
              • Retail
              • Logistics
              • Healthcare
            • ARGENTINA Supply Chain Visibility Software Market by Subscription Model Type
              • Monthly
              • Annual
              • One-Time License
            • REST OF SOUTH AMERICA Outlook (USD Billion, 2019-2032)
            • REST OF SOUTH AMERICA Supply Chain Visibility Software Market by Deployment Type
              • Cloud-Based
              • On-Premises
              • Hybrid
            • REST OF SOUTH AMERICA Supply Chain Visibility Software Market by Functionality Type
              • Transportation Management
              • Inventory Management
              • Order Management
              • Data Management
            • REST OF SOUTH AMERICA Supply Chain Visibility Software Market by End User Type
              • Manufacturing
              • Retail
              • Logistics
              • Healthcare
            • REST OF SOUTH AMERICA Supply Chain Visibility Software Market by Subscription Model Type
              • Monthly
              • Annual
              • One-Time License
            • MEA Outlook (USD Billion, 2019-2032)
              • MEA Supply Chain Visibility Software Market by Deployment Type
                • Cloud-Based
                • On-Premises
                • Hybrid
              • MEA Supply Chain Visibility Software Market by Functionality Type
                • Transportation Management
                • Inventory Management
                • Order Management
                • Data Management
              • MEA Supply Chain Visibility Software Market by End User Type
                • Manufacturing
                • Retail
                • Logistics
                • Healthcare
              • MEA Supply Chain Visibility Software Market by Subscription Model Type
                • Monthly
                • Annual
                • One-Time License
              • MEA Supply Chain Visibility Software Market by Regional Type
                • GCC Countries
                • South Africa
                • Rest of MEA
              • GCC COUNTRIES Outlook (USD Billion, 2019-2032)
              • GCC COUNTRIES Supply Chain Visibility Software Market by Deployment Type
                • Cloud-Based
                • On-Premises
                • Hybrid
              • GCC COUNTRIES Supply Chain Visibility Software Market by Functionality Type
                • Transportation Management
                • Inventory Management
                • Order Management
                • Data Management
              • GCC COUNTRIES Supply Chain Visibility Software Market by End User Type
                • Manufacturing
                • Retail
                • Logistics
                • Healthcare
              • GCC COUNTRIES Supply Chain Visibility Software Market by Subscription Model Type
                • Monthly
                • Annual
                • One-Time License
              • SOUTH AFRICA Outlook (USD Billion, 2019-2032)
              • SOUTH AFRICA Supply Chain Visibility Software Market by Deployment Type
                • Cloud-Based
                • On-Premises
                • Hybrid
              • SOUTH AFRICA Supply Chain Visibility Software Market by Functionality Type
                • Transportation Management
                • Inventory Management
                • Order Management
                • Data Management
              • SOUTH AFRICA Supply Chain Visibility Software Market by End User Type
                • Manufacturing
                • Retail
                • Logistics
                • Healthcare
              • SOUTH AFRICA Supply Chain Visibility Software Market by Subscription Model Type
                • Monthly
                • Annual
                • One-Time License
              • REST OF MEA Outlook (USD Billion, 2019-2032)
              • REST OF MEA Supply Chain Visibility Software Market by Deployment Type
                • Cloud-Based
                • On-Premises
                • Hybrid
              • REST OF MEA Supply Chain Visibility Software Market by Functionality Type
                • Transportation Management
                • Inventory Management
                • Order Management
                • Data Management
              • REST OF MEA Supply Chain Visibility Software Market by End User Type
                • Manufacturing
                • Retail
                • Logistics
                • Healthcare
              • REST OF MEA Supply Chain Visibility Software Market by Subscription Model Type
                • Monthly
                • Annual
                • One-Time License
    Report Infographic
    Free Sample Request

    Kindly complete the form below to receive a free sample of this Report

    Customer Strories

    “I am very pleased with how market segments have been defined in a relevant way for my purposes (such as "Portable Freezers & refrigerators" and "last-mile"). In general the report is well structured. Thanks very much for your efforts.”

    Victoria Milne Founder
    Case Study

    Chemicals and Materials