• Cat-intel
  • MedIntelliX
  • Resources
  • About Us
  • Request Free Sample ×

    Kindly complete the form below to receive a free sample of this Report

    Leading companies partner with us for data-driven Insights

    clients tt-cursor

    End Point Visibility Market

    ID: MRFR/ICT/28142-HCR
    100 Pages
    Aarti Dhapte
    September 2025

    End-Point Visibility Market Research Report: By Deployment Model (Cloud-based, On-premise), By Organization Size (Small and Medium-Sized Enterprises (SMEs), Large Enterprises), By Industry Vertical (Healthcare, IT and Telecom, Manufacturing, Financial Services, Retail), By Visibility Scope (Network Endpoint Visibility, Endpoint Device Visibility, Agent-based Endpoint Visibility, Agentless Endpoint Visibility) - Forecast to 2034.

    Share:
    Download PDF ×

    We do not share your information with anyone. However, we may send you emails based on your report interest from time to time. You may contact us at any time to opt-out.

    End-Point Visibility Market Research Report-Global Forecast till 2034 Infographic
    Purchase Options
    $ 4,950.0
    $ 5,950.0
    $ 7,250.0
    Table of Contents

    End Point Visibility Market Summary

    The Global End-Point Visibility Market is projected to grow significantly from 4.62 USD Billion in 2024 to 17.8 USD Billion by 2035.

    Key Market Trends & Highlights

    End-Point Visibility Key Trends and Highlights

    • The market is expected to experience a compound annual growth rate (CAGR) of 13.06% from 2025 to 2035.
    • By 2035, the market valuation is anticipated to reach 17.8 USD Billion, indicating robust growth potential.
    • In 2024, the market is valued at 4.62 USD Billion, reflecting the increasing demand for end-point visibility solutions.
    • Growing adoption of advanced security technologies due to rising cyber threats is a major market driver.

    Market Size & Forecast

    2024 Market Size 4.62 (USD Billion)
    2035 Market Size 17.8 (USD Billion)
    CAGR (2025-2035) 13.06%

    Major Players

    CrowdStrike, Tanium, Exabeam, AlgoSec, Cisco Systems, Forescout, Vectra AI, Newpara, Darktrace, Attivo Networks, SevOne, ManageEngine, IBM, VMware, Broadcom, Gigamon, Microsoft, NetScout Systems

    End Point Visibility Market Trends

    The end-point visibility market is witnessing a surge in demand due to rising security concerns and the increasing adoption of cloud and virtualization technologies. The adoption of advanced cloud-based endpoint visibility solutions and the integration of artificial intelligence (AI) and machine learning (ML) for real-time monitoring and threat detection are key market drivers. As organizations prioritize data security and regulatory compliance, the need for enhanced visibility and control over endpoints becomes imperative. The increasing prominence of remote work and hybrid IT environments further underscores the importance of end-point visibility to maintain secure access and prevent data breaches.

    The increasing complexity of cyber threats necessitates enhanced end-point visibility solutions to safeguard organizational assets and data integrity.

    U.S. Department of Homeland Security

    End Point Visibility Market Drivers

    Remote Work Trends

    The shift towards remote work is reshaping the Global End-Point Visibility Market Industry. As organizations embrace flexible work arrangements, the need for secure access to corporate networks from various locations becomes paramount. This trend has led to increased investments in end-point visibility solutions that enable organizations to monitor and manage devices used by remote employees. The rise in remote work has also heightened the risk of security breaches, prompting companies to prioritize visibility and control over their end-points. Consequently, the market is expected to witness substantial growth, driven by the necessity for organizations to maintain security and productivity in a distributed work environment.

    Increased IT Spending

    The upward trend in IT spending is a significant driver for the Global End-Point Visibility Market Industry. Organizations are allocating larger budgets towards cybersecurity initiatives, recognizing the critical importance of protecting their digital assets. This increased investment is reflected in the growing demand for end-point visibility solutions that provide comprehensive monitoring and management capabilities. As businesses prioritize cybersecurity, the market is poised for growth, with organizations seeking to implement robust solutions that enhance their security frameworks. The focus on IT spending underscores the recognition of end-point visibility as an essential component of a holistic cybersecurity strategy.

    Market Growth Projections

    The Global End-Point Visibility Market Industry is projected to experience substantial growth over the coming years. With a market value of 4.62 USD Billion in 2024, it is anticipated to reach 17.8 USD Billion by 2035, reflecting a robust CAGR of 13.06% from 2025 to 2035. This growth trajectory indicates a strong demand for end-point visibility solutions as organizations increasingly recognize the necessity of monitoring and securing their end-points. The market dynamics are influenced by various factors, including rising cybersecurity threats, regulatory compliance, and technological advancements, all contributing to the industry's expansion.

    Technological Advancements

    Rapid technological advancements are propelling the Global End-Point Visibility Market Industry forward. Innovations in artificial intelligence, machine learning, and automation are enhancing the capabilities of end-point visibility solutions. These technologies enable organizations to analyze vast amounts of data, identify anomalies, and respond to threats in real-time. As businesses seek to leverage these advancements to improve their security posture, the demand for sophisticated end-point visibility tools is likely to increase. The integration of advanced analytics and automation into security frameworks is expected to drive market growth, as organizations recognize the value of proactive threat detection and response.

    Rising Cybersecurity Threats

    The increasing prevalence of cyber threats is a primary driver for the Global End-Point Visibility Market Industry. Organizations are compelled to enhance their security measures to protect sensitive data from breaches. In 2024, the market is projected to reach 4.62 USD Billion, reflecting the urgent need for robust end-point visibility solutions. As cybercriminals employ sophisticated tactics, businesses are investing in technologies that provide real-time monitoring and threat detection. This trend is expected to accelerate, with the market anticipated to grow at a CAGR of 13.06% from 2025 to 2035, potentially reaching 17.8 USD Billion by 2035.

    Regulatory Compliance Requirements

    Compliance with data protection regulations is increasingly influencing the Global End-Point Visibility Market Industry. Governments worldwide are implementing stringent regulations to safeguard personal and corporate data, necessitating organizations to adopt comprehensive end-point visibility solutions. For instance, the General Data Protection Regulation (GDPR) in Europe mandates strict data handling practices, compelling companies to invest in technologies that ensure compliance. This regulatory landscape drives demand for end-point visibility tools that facilitate monitoring and reporting capabilities. As organizations strive to avoid hefty fines and reputational damage, the market is likely to expand significantly, reflecting the critical role of compliance in shaping industry dynamics.

    Market Segment Insights

    End-Point Visibility Market Deployment Model Insights

    The deployment model segment of the End-Point Visibility Market can be categorized as cloud-based and on-premise solutions. The cloud-based deployment is achieved through a third-party cloud infrastructure, maintaining the endpoint visibility solution. On the other hand, the on-premise deployment is performed by installing the solution on the infrastructure of the customer and handling its management. The cloud-based mode of deployment is favored in the End-Point Visibility Market in many aspects. The deployment is scalable, flexible, cheaper, and easier to manage.

    It allows organizations to conduct complex tasks in a digital space without having to invest in their own IT infrastructure. Therefore, the cloud-based mode of deployment is ideally suited for small and medium-sized businesses and companies with limited resources for IT investments. Besides, the cloud-based deployment provides a real-time view and control over all end-points, enabling a flexible and immediate response to possible threats and incidents. Nevertheless, the on-premise deployment provides a higher level of data and system protection and has acquired popularity in organizations that require the highest level of compliance or handle classified information.

    However, the initial and operational costs of on-premise deployment are higher because of the required investments in hardware and software infrastructure. In terms of market size, the cloud-based segment will assume a leading position in the End-Point Visibility Market in the future years. The shift is supported by the growing trend of remote work and the development of cloud computing. The revenue share of the cloud-based segment was predicted to be over 60% by the end of 2024 by the following report.

    Source: Primary Research, Secondary Research, MRFR Database and Analyst Review

    End-Point Visibility Market Organization Size Insights

    The End-Point Visibility Market segmentation by Organization Size comprises Small and Medium-Sized Enterprises (SMEs) and Large Enterprises. Large enterprises are expected to hold a significant market share in 2024 due to their ability to invest heavily in advanced endpoint visibility solutions to gain real-time visibility into their IT infrastructure. SMEs, on the other hand, are projected to experience notable growth in the coming years as they increasingly recognize the importance of endpoint visibility for maintaining compliance and mitigating security risks. The growing adoption of cloud-based endpoint visibility solutions among SMEs is also contributing to the segment's growth.

    End-Point Visibility Market Industry Vertical Insights

    The End-Point Visibility Market is segmented into various industry verticals, including Healthcare, IT and Telecom, Manufacturing, Financial Services, and Retail. Among these, the Healthcare industry is anticipated to hold a significant market share in 2024 and exhibit robust growth throughout the forecast period. The increasing adoption of connected medical devices, electronic health records, and telemedicine solutions is driving the demand for end-point visibility solutions in the healthcare sector.

    Similarly, the IT and Telecom industry is expected to contribute a substantial share of the End-Point Visibility Market revenue due to the growing need for network monitoring and security in the wake of digital transformation and cloud adoption.

    The Manufacturing industry is also witnessing a rise in the adoption of end-point visibility solutions to enhance operational efficiency and reduce downtime. The Financial Services industry is focusing on compliance and risk management, leading to the adoption of end-point visibility solutions for regulatory compliance and fraud detection. The Retail industry is leveraging end-point visibility solutions to improve customer experience, optimize inventory management, and enhance security. Overall, the segmentation of the End-Point Visibility Market into industry verticals provides insights into the diverse applications and growth opportunities within specific industries.

    End-Point Visibility Market Visibility Scope Insights

    The End-Point Visibility Market is segmented into Network Endpoint Visibility, Endpoint Device Visibility, Agent-based Endpoint Visibility, and Agentless Endpoint Visibility based on Visibility Scope. Among these, the Network Endpoint Visibility segment held the largest market share in 2023, and it is expected to continue its dominance during the forecast period. The growth of this segment can be attributed to the increasing adoption of network endpoint detection and response (NDR) solutions by organizations to detect and respond to advanced threats.

    The Endpoint Device Visibility segment is expected to witness significant growth during the forecast period due to the rising demand for endpoint device management (EDM) solutions to manage and secure endpoint devices. The Agent-based Endpoint Visibility segment is expected to grow steadily during the forecast period due to the increasing adoption of agent-based endpoint security solutions by organizations to protect their endpoints from various threats. The Agentless Endpoint Visibility segment is expected to gain traction during the forecast period due to the growing popularity of agentless endpoint security solutions, which do not require the installation of agents on endpoint devices.

    End-Point Visibility Market Visibility Features Insights

    The End-Point Visibility Market is segmented based on Visibility Features into Asset Discovery and Inventory, Vulnerability Management, Threat Detection and Prevention, Patch Management, and Remote Access Control. Among these, the Vulnerability Management segment held the largest market share in 2023 and is projected to continue its dominance throughout the forecast period. The rising number of cyber threats and the need for organizations to protect their endpoints from vulnerabilities are driving the growth of this segment.

    The Threat Detection and Prevention segment is also expected to witness significant growth during the forecast period due to the increasing adoption of advanced threat detection and prevention solutions by organizations.

    Get more detailed insights about End-Point Visibility Market Research Report-Global Forecast till 2034

    Regional Insights

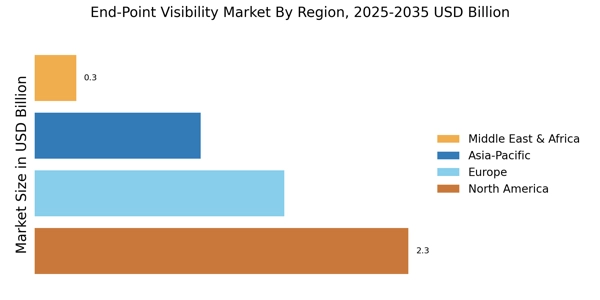
    The End-Point Visibility Market is segmented into North America, Europe, APAC, South America, and MEA. North America is expected to dominate the market in the forecast period due to the presence of major vendors, high adoption of advanced technologies, and stringent regulations. The European region is expected to hold a significant market share due to the increasing awareness about data protection and compliance requirements. APAC is expected to witness the fastest growth rate during the forecast period due to the rising adoption of cloud-based solutions and increasing investments in digital infrastructure.

    South America and MEA are expected to contribute a smaller market share but offer promising growth opportunities due to the increasing adoption of IT solutions and the need for improved security measures.

    End-Point Visibility Market Regional Insights Source: Primary Research, Secondary Research, MRFR Database and Analyst Review

    Key Players and Competitive Insights

    Major players in End-Point Visibility Market are constantly striving to gain a competitive edge by offering innovative solutions and expanding their product portfolios. Through strategic partnerships, acquisitions, and ongoing research and development, these leading End-Point Visibility Market players are driving End-Point Visibility Market development and shaping the industry landscape. The competitive dynamics of the End-Point Visibility Market industry are characterized by intense competition among established players and emerging challengers, all vying for market share and customer loyalty.

    Key strategies employed by End-Point Visibility Market companies include product differentiation, aggressive pricing, and targeted marketing campaigns to capture a larger slice of the market.

    A prominent player in the End-Point Visibility Market is CrowdStrike, renowned for its comprehensive Falcon platform. CrowdStrike's Falcon platform provides a unified solution for endpoint protection, detection, and response, empowering organizations to proactively defend against sophisticated cyber threats. The company's focus on cloud-native architecture, threat intelligence, and automation sets it apart in the industry. CrowdStrike has gained significant traction, particularly among enterprises seeking a robust and scalable endpoint security solution.

    Another leading competitor in the End-Point Visibility Market is Tanium, recognized for its innovative endpoint management and security platform. Tanium's platform offers real-time visibility and control over all endpoints within an organization's network, enabling IT teams to quickly identify and mitigate security risks. The company's emphasis on providing actionable insights, automating tasks, and ensuring compliance has made it a preferred choice for organizations seeking comprehensive endpoint management and security solutions.

    Key Companies in the End Point Visibility Market market include

    Industry Developments

    The End-Point Visibility Market is anticipated to garner momentum in the forthcoming years. The market size is expected to be valued at USD 4.13 billion in 2023, advancing at a CAGR of 11.91% during the forecast period 2024-2032. This growth can be attributed to the increasing need for enhanced security and the growing adoption of cloud-based solutions. Notable market developments include partnerships and collaborations between key players to strengthen market offerings. For instance, in January 2023, VMware acquired Intrinsic Security, a leader in workload protection, to bolster its endpoint security portfolio and cater to the evolving threat landscape.

    Such strategic initiatives are shaping the market landscape and driving innovation.

    Future Outlook

    End Point Visibility Market Future Outlook

    The End-Point Visibility Market is projected to grow at a 13.06% CAGR from 2024 to 2035, driven by increasing cybersecurity threats and the need for enhanced data protection.

    New opportunities lie in:

    • Develop AI-driven analytics tools for real-time endpoint monitoring.
    • Expand service offerings to include compliance management solutions.
    • Invest in partnerships with IoT device manufacturers for integrated visibility solutions.

    By 2035, the End-Point Visibility Market is expected to achieve substantial growth, reflecting heightened demand for security and management solutions.

    Market Segmentation

    End-Point Visibility Market Regional Outlook

    • North America
    • Europe
    • South America
    • Asia Pacific
    • Middle East and Africa

    End-Point Visibility Market Deployment Model Outlook

    • Cloud-based
    • On-premise
    • End-Point Visibility Market Organization Size Outlook Small and Medium-Sized Enterprises (SMEs)

    End-Point Visibility Market Visibility Scope Outlook

    • Network Endpoint Visibility
    • Endpoint Device Visibility
    • Agent-based Endpoint Visibility
    • Agentless Endpoint Visibility
    • End-Point Visibility Market Visibility Features Outlook Asset Discovery and Inventory

    End-Point Visibility Market Industry Vertical Outlook

    • Healthcare
    • IT and Telecom
    • Manufacturing
    • Financial Services
    • Retail
    • End-Point Visibility Market Visibility Scope Outlook Network Endpoint Visibility

    End-Point Visibility Market Organization Size Outlook

    • Small and Medium-Sized Enterprises (SMEs)
    • Large Enterprises
    • End-Point Visibility Market Industry Vertical Outlook Healthcare

    End-Point Visibility Market Visibility Features Outlook

    • Asset Discovery and Inventory
    • Vulnerability Management
    • Threat Detection and Prevention
    • Patch Management
    • Remote Access Control
    • End-Point Visibility Market Regional Outlook North America

    Report Scope

    Report Attribute/Metric Details
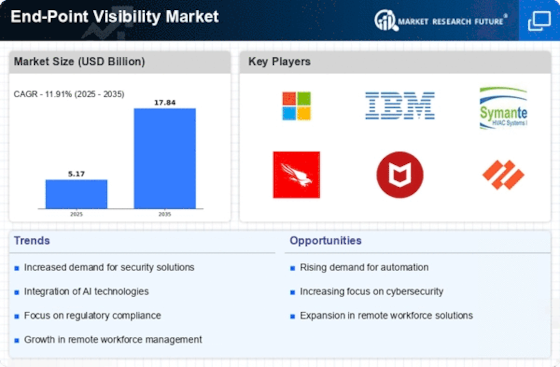
    Market Size 2024 5.17 (USD Billion)
    Market Size 2025 5.78 (USD Billion)
    Market Size 2034 15.93 (USD Billion)
    Compound Annual Growth Rate (CAGR) 11.91% (2025 - 2034)
    Report Coverage Revenue Forecast, Competitive Landscape, Growth Factors, and Trends
    Base Year 2024
    Market Forecast Period 2025 - 2034
    Historical Data 2019 - 2023
    Market Forecast Units USD Billion
    Key Companies Profiled Exabeam, AlgoSec, Cisco Systems, Forescout, Vectra AINewparaDarktraceNewparaAttivo Networks, SevOneNewparaManageEngine, IBM, VMware, Broadcom, Gigamon, Microsoft, NetScout Systems
    Segments Covered Deployment Model, Organization Size, Industry Vertical, Visibility Scope, Visibility Features, Regional
    Key Market Opportunities Increased enterprise endpoints, growing cyber threats, cloud migration, advanced endpoint threats rising regulatory compliance.
    Key Market Dynamics Hybrid cloud services rising cyberattacks IoT adoption BYOD adoption cloud-based WFH
    Countries Covered North America, Europe, APAC, South America, MEA

    Market Highlights

    Author
    Aarti Dhapte
    Team Lead - Research

    She holds an experience of about 6+ years in Market Research and Business Consulting, working under the spectrum of Information Communication Technology, Telecommunications and Semiconductor domains. Aarti conceptualizes and implements a scalable business strategy and provides strategic leadership to the clients. Her expertise lies in market estimation, competitive intelligence, pipeline analysis, customer assessment, etc.

    Leave a Comment

    FAQs

    What is the expected market size of the End-Point Visibility Market in 2025?

    The End-Point Visibility Market is expected to reach a valuation of 5.78 Billion USD in 2025.

    What is the expected market size of the End-Point Visibility Market in 2034?

    The End-Point Visibility Market is expected to reach a valuation of 15.93 Billion USD in 2034.

    What is the expected CAGR of the End-Point Visibility Market from 2024 to 2032?

    The End-Point Visibility Market is expected to grow at a CAGR of 11.91% from 2025 to 2034.

    Which region is expected to hold the largest share of the End-Point Visibility Market in 20344?

    North America is expected to hold the largest share of the End-Point Visibility Market in 2034.

    Which application segment is expected to hold the largest share of the End-Point Visibility Market in 2032?

    The IT and Telecom segment is expected to hold the largest share of the End-Point Visibility Market in 2032.

    Who are some of the key competitors in the End-Point Visibility Market?

    Some of the key competitors in the End-Point Visibility Market include Cisco Systems, Microsoft, IBM, and VMware.

    What are the major factors driving the growth of the End-Point Visibility Market?

    The growing need for network visibility and security, the increasing adoption of cloud computing, and the rising number of connected devices are major factors driving the growth of the End-Point Visibility Market.

    What are the challenges faced by the End-Point Visibility Market?

    The lack of skilled professionals, the high cost of implementation, and the complexity of managing multiple vendors are some of the challenges faced by the End-Point Visibility Market.

    What are the key trends in the End-Point Visibility Market?

    The integration of artificial intelligence (AI) and machine learning (ML), the adoption of software-defined networking (SDN), and the increasing focus on cloud-based solutions are key trends in the End-Point Visibility Market.

    What are the opportunities for growth in the End-Point Visibility Market?

    The growing demand for network security, the increasing adoption of IoT devices, and the rise of 5G networks are opportunities for growth in the End-Point Visibility Market.

    1. 'Table of Contents
    2. EXECUTIVE SUMMARY
    3. Market Overview
      1. Key Findings
      2. Market Segmentation
    4. Competitive Landscape
      1. Challenges and Opportunities
      2. Future Outlook
    5. MARKET INTRODUCTION
      1. Definition
      2. Scope of the study
        1. Research Objective
        2. Assumption
        3. Limitations
    6. RESEARCH METHODOLOGY
      1. Overview
    7. Data Mining
      1. Secondary Research
      2. Primary Research
    8. Primary Interviews and Information Gathering Process
      1. Breakdown of Primary
    9. Respondents
      1. Forecasting Model
      2. Market Size Estimation
    10. Bottom-Up Approach
      1. Top-Down Approach
      2. Data Triangulation
      3. Validation
    11. MARKET DYNAMICS
      1. Overview
      2. Drivers
      3. Restraints
      4. Opportunities
    12. MARKET FACTOR ANALYSIS
      1. Value chain Analysis
      2. Porter''s Five Forces
    13. Analysis
      1. Bargaining Power of Suppliers
        1. Bargaining Power
    14. of Buyers
      1. Threat of New Entrants
        1. Threat of Substitutes
        2. Intensity of Rivalry
      2. COVID-19 Impact Analysis
    15. Market Impact Analysis
      1. Regional Impact
        1. Opportunity and
    16. Threat Analysis
    17. End-Point Visibility Market, BY Deployment
    18. Model (USD Billion)
      1. Cloud-based
      2. On-premise
    19. End-Point
    20. Visibility Market, BY Organization Size (USD Billion)
      1. Small and Medium-Sized
    21. Enterprises (SMEs)
      1. Large Enterprises
    22. End-Point Visibility Market,
    23. BY Industry Vertical (USD Billion)
      1. Healthcare
      2. IT and Telecom
      3. Manufacturing
      4. Financial Services
      5. Retail
    24. End-Point Visibility Market, BY Visibility Scope (USD Billion)
      1. Network
    25. Endpoint Visibility
      1. Endpoint Device Visibility
      2. Agent-based
    26. Endpoint Visibility
      1. Agentless Endpoint Visibility
    27. End-Point
    28. Visibility Market, BY Visibility Features (USD Billion)
      1. Asset Discovery
    29. and Inventory
      1. Vulnerability Management
      2. Threat Detection
    30. and Prevention
      1. Patch Management
      2. Remote Access Control
    31. End-Point Visibility Market, BY Regional (USD Billion)
      1. North America
        1. US
        2. Canada
      2. Europe
        1. Germany
        2. UK
        3. France
        4. Russia
        5. Italy
    32. Spain
      1. Rest of Europe
      2. APAC
        1. China
    33. India
      1. Japan
        1. South Korea
        2. Malaysia
    34. Thailand
      1. Indonesia
        1. Rest of APAC
      2. South America
        1. Brazil
        2. Mexico
        3. Argentina
    35. Rest of South America
      1. MEA
        1. GCC Countries
    36. South Africa
      1. Rest of MEA
    37. Competitive Landscape
      1. Overview
      2. Competitive Analysis
      3. Market share Analysis
      4. Major Growth Strategy in the End-Point Visibility Market
    38. Competitive Benchmarking
      1. Leading Players in Terms of Number of Developments
    39. in the End-Point Visibility Market
      1. Key developments and growth strategies
        1. New Product Launch/Service Deployment
        2. Merger & Acquisitions
        3. Joint Ventures
      2. Major Players Financial Matrix
    40. Sales and Operating Income
      1. Major Players R&D Expenditure. 2023
    41. Company Profiles
      1. Exabeam
        1. Financial Overview
        2. Products Offered
        3. Key Developments
        4. SWOT
    42. Analysis
      1. Key Strategies
      2. AlgoSec
        1. Financial
    43. Overview
      1. Products Offered
        1. Key Developments
    44. SWOT Analysis
      1. Key Strategies
      2. Cisco Systems
    45. Financial Overview
      1. Products Offered
        1. Key Developments
        2. SWOT Analysis
        3. Key Strategies
      2. Forescout
        1. Financial Overview
        2. Products Offered
        3. Key Developments
        4. SWOT Analysis
        5. Key Strategies
      3. Vectra AINewparaDarktraceNewparaAttivo
    46. Networks
      1. Financial Overview
        1. Products Offered
    47. Key Developments
      1. SWOT Analysis
        1. Key Strategies
    48. SevOneNewparaManageEngine
      1. Financial Overview
        1. Products
    49. Offered
      1. Key Developments
        1. SWOT Analysis
    50. Key Strategies
      1. IBM
        1. Financial Overview
        2. Products
    51. Offered
      1. Key Developments
        1. SWOT Analysis
    52. Key Strategies
      1. VMware
        1. Financial Overview
    53. Products Offered
      1. Key Developments
        1. SWOT Analysis
        2. Key Strategies
      2. Broadcom
        1. Financial Overview
        2. Products Offered
        3. Key Developments
        4. SWOT Analysis
        5. Key Strategies
      3. Gigamon
        1. Financial Overview
        2. Products Offered
        3. Key Developments
        4. SWOT
    54. Analysis
      1. Key Strategies
      2. Microsoft
        1. Financial
    55. Overview
      1. Products Offered
        1. Key Developments
    56. SWOT Analysis
      1. Key Strategies
      2. NetScout Systems
    57. Financial Overview
      1. Products Offered
        1. Key Developments
        2. SWOT Analysis
        3. Key Strategies
    58. Appendix
      1. References
      2. Related Reports
    59. LIST OF ASSUMPTIONS
    60. SIZE ESTIMATES & FORECAST, BY DEPLOYMENT MODEL, 2019-2032 (USD Billions)
    61. BY ORGANIZATION SIZE, 2019-2032 (USD Billions)
    62. Visibility Market SIZE ESTIMATES & FORECAST, BY INDUSTRY VERTICAL, 2019-2032
    63. (USD Billions)
    64. & FORECAST, BY VISIBILITY SCOPE, 2019-2032 (USD Billions)
    65. America End-Point Visibility Market SIZE ESTIMATES & FORECAST, BY VISIBILITY
    66. FEATURES, 2019-2032 (USD Billions)
    67. Market SIZE ESTIMATES & FORECAST, BY REGIONAL, 2019-2032 (USD Billions)
    68. MODEL, 2019-2032 (USD Billions)
    69. ESTIMATES & FORECAST, BY ORGANIZATION SIZE, 2019-2032 (USD Billions)
    70. US End-Point Visibility Market SIZE ESTIMATES & FORECAST, BY INDUSTRY VERTICAL,
    71. 2032 (USD Billions)
    72. & FORECAST, BY VISIBILITY SCOPE, 2019-2032 (USD Billions)
    73. End-Point Visibility Market SIZE ESTIMATES & FORECAST, BY VISIBILITY FEATURES,
    74. 2032 (USD Billions)
    75. & FORECAST, BY REGIONAL, 2019-2032 (USD Billions)
    76. Visibility Market SIZE ESTIMATES & FORECAST, BY DEPLOYMENT MODEL, 2019-2032
    77. (USD Billions)
    78. & FORECAST, BY ORGANIZATION SIZE, 2019-2032 (USD Billions)
    79. End-Point Visibility Market SIZE ESTIMATES & FORECAST, BY INDUSTRY VERTICAL,
    80. 2032 (USD Billions)
    81. ESTIMATES & FORECAST, BY VISIBILITY SCOPE, 2019-2032 (USD Billions)
    82. Canada End-Point Visibility Market SIZE ESTIMATES & FORECAST, BY VISIBILITY
    83. FEATURES, 2019-2032 (USD Billions)
    84. SIZE ESTIMATES & FORECAST, BY REGIONAL, 2019-2032 (USD Billions)
    85. Europe End-Point Visibility Market SIZE ESTIMATES & FORECAST, BY DEPLOYMENT
    86. MODEL, 2019-2032 (USD Billions)
    87. SIZE ESTIMATES & FORECAST, BY ORGANIZATION SIZE, 2019-2032 (USD Billions)
    88. INDUSTRY VERTICAL, 2019-2032 (USD Billions)
    89. Market SIZE ESTIMATES & FORECAST, BY VISIBILITY SCOPE, 2019-2032 (USD Billions)
    90. BY VISIBILITY FEATURES, 2019-2032 (USD Billions)
    91. Visibility Market SIZE ESTIMATES & FORECAST, BY REGIONAL, 2019-2032 (USD Billions)
    92. BY DEPLOYMENT MODEL, 2019-2032 (USD Billions)
    93. Visibility Market SIZE ESTIMATES & FORECAST, BY ORGANIZATION SIZE, 2019-2032
    94. (USD Billions)
    95. & FORECAST, BY INDUSTRY VERTICAL, 2019-2032 (USD Billions)
    96. End-Point Visibility Market SIZE ESTIMATES & FORECAST, BY VISIBILITY SCOPE,
    97. 2032 (USD Billions)
    98. ESTIMATES & FORECAST, BY VISIBILITY FEATURES, 2019-2032 (USD Billions)
    99. Germany End-Point Visibility Market SIZE ESTIMATES & FORECAST, BY REGIONAL,
    100. 2032 (USD Billions)
    101. & FORECAST, BY DEPLOYMENT MODEL, 2019-2032 (USD Billions)
    102. End-Point Visibility Market SIZE ESTIMATES & FORECAST, BY ORGANIZATION SIZE,
    103. 2032 (USD Billions)
    104. & FORECAST, BY INDUSTRY VERTICAL, 2019-2032 (USD Billions)
    105. End-Point Visibility Market SIZE ESTIMATES & FORECAST, BY VISIBILITY SCOPE,
    106. 2032 (USD Billions)
    107. & FORECAST, BY VISIBILITY FEATURES, 2019-2032 (USD Billions)
    108. UK End-Point Visibility Market SIZE ESTIMATES & FORECAST, BY REGIONAL, 2019-2032
    109. (USD Billions)
    110. & FORECAST, BY DEPLOYMENT MODEL, 2019-2032 (USD Billions)
    111. End-Point Visibility Market SIZE ESTIMATES & FORECAST, BY ORGANIZATION SIZE,
    112. 2032 (USD Billions)
    113. ESTIMATES & FORECAST, BY INDUSTRY VERTICAL, 2019-2032 (USD Billions)
    114. France End-Point Visibility Market SIZE ESTIMATES & FORECAST, BY VISIBILITY
    115. SCOPE, 2019-2032 (USD Billions)
    116. SIZE ESTIMATES & FORECAST, BY VISIBILITY FEATURES, 2019-2032 (USD Billions)
    117. BY REGIONAL, 2019-2032 (USD Billions)
    118. Market SIZE ESTIMATES & FORECAST, BY DEPLOYMENT MODEL, 2019-2032 (USD Billions)
    119. BY ORGANIZATION SIZE, 2019-2032 (USD Billions)
    120. Visibility Market SIZE ESTIMATES & FORECAST, BY INDUSTRY VERTICAL, 2019-2032
    121. (USD Billions)
    122. & FORECAST, BY VISIBILITY SCOPE, 2019-2032 (USD Billions)
    123. End-Point Visibility Market SIZE ESTIMATES & FORECAST, BY VISIBILITY FEATURES,
    124. 2032 (USD Billions)
    125. ESTIMATES & FORECAST, BY REGIONAL, 2019-2032 (USD Billions)
    126. Italy End-Point Visibility Market SIZE ESTIMATES & FORECAST, BY DEPLOYMENT MODEL,
    127. 2032 (USD Billions)
    128. ESTIMATES & FORECAST, BY ORGANIZATION SIZE, 2019-2032 (USD Billions)
    129. Italy End-Point Visibility Market SIZE ESTIMATES & FORECAST, BY INDUSTRY
    130. VERTICAL, 2019-2032 (USD Billions)
    131. SIZE ESTIMATES & FORECAST, BY VISIBILITY SCOPE, 2019-2032 (USD Billions)
    132. VISIBILITY FEATURES, 2019-2032 (USD Billions)
    133. Market SIZE ESTIMATES & FORECAST, BY REGIONAL, 2019-2032 (USD Billions)
    134. DEPLOYMENT MODEL, 2019-2032 (USD Billions)
    135. Market SIZE ESTIMATES & FORECAST, BY ORGANIZATION SIZE, 2019-2032 (USD Billions)
    136. BY INDUSTRY VERTICAL, 2019-2032 (USD Billions)
    137. Market SIZE ESTIMATES & FORECAST, BY VISIBILITY SCOPE, 2019-2032 (USD Billions)
    138. BY VISIBILITY FEATURES, 2019-2032 (USD Billions)
    139. Visibility Market SIZE ESTIMATES & FORECAST, BY REGIONAL, 2019-2032 (USD Billions)
    140. FORECAST, BY DEPLOYMENT MODEL, 2019-2032 (USD Billions)
    141. Europe End-Point Visibility Market SIZE ESTIMATES & FORECAST, BY ORGANIZATION
    142. SIZE, 2019-2032 (USD Billions)
    143. Market SIZE ESTIMATES & FORECAST, BY INDUSTRY VERTICAL, 2019-2032 (USD Billions)
    144. FORECAST, BY VISIBILITY SCOPE, 2019-2032 (USD Billions)
    145. Europe End-Point Visibility Market SIZE ESTIMATES & FORECAST, BY VISIBILITY
    146. FEATURES, 2019-2032 (USD Billions)
    147. Market SIZE ESTIMATES & FORECAST, BY REGIONAL, 2019-2032 (USD Billions)
    148. MODEL, 2019-2032 (USD Billions)
    149. SIZE ESTIMATES & FORECAST, BY ORGANIZATION SIZE, 2019-2032 (USD Billions)
    150. VERTICAL, 2019-2032 (USD Billions)
    151. SIZE ESTIMATES & FORECAST, BY VISIBILITY SCOPE, 2019-2032 (USD Billions)
    152. FEATURES, 2019-2032 (USD Billions)
    153. SIZE ESTIMATES & FORECAST, BY REGIONAL, 2019-2032 (USD Billions)
    154. China End-Point Visibility Market SIZE ESTIMATES & FORECAST, BY DEPLOYMENT
    155. MODEL, 2019-2032 (USD Billions)
    156. SIZE ESTIMATES & FORECAST, BY ORGANIZATION SIZE, 2019-2032 (USD Billions)
    157. INDUSTRY VERTICAL, 2019-2032 (USD Billions)
    158. Market SIZE ESTIMATES & FORECAST, BY VISIBILITY SCOPE, 2019-2032 (USD Billions)
    159. BY VISIBILITY FEATURES, 2019-2032 (USD Billions)
    160. Visibility Market SIZE ESTIMATES & FORECAST, BY REGIONAL, 2019-2032 (USD Billions)
    161. BY DEPLOYMENT MODEL, 2019-2032 (USD Billions)
    162. Market SIZE ESTIMATES & FORECAST, BY ORGANIZATION SIZE, 2019-2032 (USD Billions)
    163. BY INDUSTRY VERTICAL, 2019-2032 (USD Billions)
    164. Market SIZE ESTIMATES & FORECAST, BY VISIBILITY SCOPE, 2019-2032 (USD Billions)
    165. BY VISIBILITY FEATURES, 2019-2032 (USD Billions)
    166. Visibility Market SIZE ESTIMATES & FORECAST, BY REGIONAL, 2019-2032 (USD Billions)
    167. BY DEPLOYMENT MODEL, 2019-2032 (USD Billions)
    168. Market SIZE ESTIMATES & FORECAST, BY ORGANIZATION SIZE, 2019-2032 (USD Billions)
    169. BY INDUSTRY VERTICAL, 2019-2032 (USD Billions)
    170. Market SIZE ESTIMATES & FORECAST, BY VISIBILITY SCOPE, 2019-2032 (USD Billions)
    171. BY VISIBILITY FEATURES, 2019-2032 (USD Billions)
    172. Visibility Market SIZE ESTIMATES & FORECAST, BY REGIONAL, 2019-2032 (USD Billions)
    173. BY DEPLOYMENT MODEL, 2019-2032 (USD Billions)
    174. Visibility Market SIZE ESTIMATES & FORECAST, BY ORGANIZATION SIZE, 2019-2032
    175. (USD Billions)
    176. & FORECAST, BY INDUSTRY VERTICAL, 2019-2032 (USD Billions)
    177. Korea End-Point Visibility Market SIZE ESTIMATES & FORECAST, BY VISIBILITY SCOPE,
    178. 2032 (USD Billions)
    179. SIZE ESTIMATES & FORECAST, BY VISIBILITY FEATURES, 2019-2032 (USD Billions)
    180. BY REGIONAL, 2019-2032 (USD Billions)
    181. Market SIZE ESTIMATES & FORECAST, BY DEPLOYMENT MODEL, 2019-2032 (USD Billions)
    182. BY ORGANIZATION SIZE, 2019-2032 (USD Billions)
    183. Visibility Market SIZE ESTIMATES & FORECAST, BY INDUSTRY VERTICAL, 2019-2032
    184. (USD Billions)
    185. & FORECAST, BY VISIBILITY SCOPE, 2019-2032 (USD Billions)
    186. End-Point Visibility Market SIZE ESTIMATES & FORECAST, BY VISIBILITY FEATURES,
    187. 2032 (USD Billions)
    188. ESTIMATES & FORECAST, BY REGIONAL, 2019-2032 (USD Billions)
    189. Thailand End-Point Visibility Market SIZE ESTIMATES & FORECAST, BY DEPLOYMENT
    190. MODEL, 2019-2032 (USD Billions)
    191. SIZE ESTIMATES & FORECAST, BY ORGANIZATION SIZE, 2019-2032 (USD Billions)
    192. BY INDUSTRY VERTICAL, 2019-2032 (USD Billions)
    193. Visibility Market SIZE ESTIMATES & FORECAST, BY VISIBILITY SCOPE, 2019-2032
    194. (USD Billions)
    195. & FORECAST, BY VISIBILITY FEATURES, 2019-2032 (USD Billions)
    196. Thailand End-Point Visibility Market SIZE ESTIMATES & FORECAST, BY REGIONAL,
    197. 2032 (USD Billions)
    198. SIZE ESTIMATES & FORECAST, BY DEPLOYMENT MODEL, 2019-2032 (USD Billions)
    199. BY ORGANIZATION SIZE, 2019-2032 (USD Billions)
    200. Visibility Market SIZE ESTIMATES & FORECAST, BY INDUSTRY VERTICAL, 2019-2032
    201. (USD Billions)
    202. & FORECAST, BY VISIBILITY SCOPE, 2019-2032 (USD Billions)
    203. End-Point Visibility Market SIZE ESTIMATES & FORECAST, BY VISIBILITY FEATURES,
    204. 2032 (USD Billions)
    205. SIZE ESTIMATES & FORECAST, BY REGIONAL, 2019-2032 (USD Billions)
    206. Rest of APAC End-Point Visibility Market SIZE ESTIMATES & FORECAST, BY
    207. DEPLOYMENT MODEL, 2019-2032 (USD Billions)
    208. Visibility Market SIZE ESTIMATES & FORECAST, BY ORGANIZATION SIZE, 2019-2032
    209. (USD Billions)
    210. & FORECAST, BY INDUSTRY VERTICAL, 2019-2032 (USD Billions)
    211. Rest of APAC End-Point Visibility Market SIZE ESTIMATES & FORECAST, BY VISIBILITY
    212. SCOPE, 2019-2032 (USD Billions)
    213. Market SIZE ESTIMATES & FORECAST, BY VISIBILITY FEATURES, 2019-2032 (USD Billions)
    214. BY REGIONAL, 2019-2032 (USD Billions)
    215. Market SIZE ESTIMATES & FORECAST, BY DEPLOYMENT MODEL, 2019-2032 (USD Billions)
    216. FORECAST, BY ORGANIZATION SIZE, 2019-2032 (USD Billions)
    217. America End-Point Visibility Market SIZE ESTIMATES & FORECAST, BY INDUSTRY VERTICAL,
    218. 2032 (USD Billions)
    219. SIZE ESTIMATES & FORECAST, BY VISIBILITY SCOPE, 2019-2032 (USD Billions)
    220. BY VISIBILITY FEATURES, 2019-2032 (USD Billions)
    221. End-Point Visibility Market SIZE ESTIMATES & FORECAST, BY REGIONAL, 2019-2032
    222. (USD Billions)
    223. & FORECAST, BY DEPLOYMENT MODEL, 2019-2032 (USD Billions)
    224. End-Point Visibility Market SIZE ESTIMATES & FORECAST, BY ORGANIZATION SIZE,
    225. 2032 (USD Billions)
    226. ESTIMATES & FORECAST, BY INDUSTRY VERTICAL, 2019-2032 (USD Billions)
    227. Brazil End-Point Visibility Market SIZE ESTIMATES & FORECAST, BY VISIBILITY
    228. SCOPE, 2019-2032 (USD Billions)
    229. SIZE ESTIMATES & FORECAST, BY VISIBILITY FEATURES, 2019-2032 (USD Billions)
    230. BY REGIONAL, 2019-2032 (USD Billions)
    231. Market SIZE ESTIMATES & FORECAST, BY DEPLOYMENT MODEL, 2019-2032 (USD Billions)
    232. BY ORGANIZATION SIZE, 2019-2032 (USD Billions)
    233. Visibility Market SIZE ESTIMATES & FORECAST, BY INDUSTRY VERTICAL, 2019-2032
    234. (USD Billions)
    235. & FORECAST, BY VISIBILITY SCOPE, 2019-2032 (USD Billions)
    236. End-Point Visibility Market SIZE ESTIMATES & FORECAST, BY VISIBILITY FEATURES,
    237. 2032 (USD Billions)
    238. ESTIMATES & FORECAST, BY REGIONAL, 2019-2032 (USD Billions)
    239. Argentina End-Point Visibility Market SIZE ESTIMATES & FORECAST, BY DEPLOYMENT
    240. MODEL, 2019-2032 (USD Billions)
    241. Market SIZE ESTIMATES & FORECAST, BY ORGANIZATION SIZE, 2019-2032 (USD Billions)
    242. BY INDUSTRY VERTICAL, 2019-2032 (USD Billions)
    243. Visibility Market SIZE ESTIMATES & FORECAST, BY VISIBILITY SCOPE, 2019-2032
    244. (USD Billions)
    245. & FORECAST, BY VISIBILITY FEATURES, 2019-2032 (USD Billions)
    246. Argentina End-Point Visibility Market SIZE ESTIMATES & FORECAST, BY REGIONAL,
    247. 2032 (USD Billions)
    248. Market SIZE ESTIMATES & FORECAST, BY DEPLOYMENT MODEL, 2019-2032 (USD Billions)
    249. & FORECAST, BY ORGANIZATION SIZE, 2019-2032 (USD Billions)
    250. Rest of South America End-Point Visibility Market SIZE ESTIMATES & FORECAST,
    251. BY INDUSTRY VERTICAL, 2019-2032 (USD Billions)
    252. End-Point Visibility Market SIZE ESTIMATES & FORECAST, BY VISIBILITY SCOPE,
    253. 2032 (USD Billions)
    254. Market SIZE ESTIMATES & FORECAST, BY VISIBILITY FEATURES, 2019-2032 (USD Billions)
    255. & FORECAST, BY REGIONAL, 2019-2032 (USD Billions)
    256. Visibility Market SIZE ESTIMATES & FORECAST, BY DEPLOYMENT MODEL, 2019-2032
    257. (USD Billions)
    258. FORECAST, BY ORGANIZATION SIZE, 2019-2032 (USD Billions)
    259. Visibility Market SIZE ESTIMATES & FORECAST, BY INDUSTRY VERTICAL, 2019-2032
    260. (USD Billions)
    261. FORECAST, BY VISIBILITY SCOPE, 2019-2032 (USD Billions)
    262. Visibility Market SIZE ESTIMATES & FORECAST, BY VISIBILITY FEATURES, 2019-2032
    263. (USD Billions)
    264. FORECAST, BY REGIONAL, 2019-2032 (USD Billions)
    265. Visibility Market SIZE ESTIMATES & FORECAST, BY DEPLOYMENT MODEL, 2019-2032
    266. (USD Billions)
    267. & FORECAST, BY ORGANIZATION SIZE, 2019-2032 (USD Billions)
    268. GCC Countries End-Point Visibility Market SIZE ESTIMATES & FORECAST, BY INDUSTRY
    269. VERTICAL, 2019-2032 (USD Billions)
    270. Market SIZE ESTIMATES & FORECAST, BY VISIBILITY SCOPE, 2019-2032 (USD Billions)
    271. FORECAST, BY VISIBILITY FEATURES, 2019-2032 (USD Billions)
    272. Countries End-Point Visibility Market SIZE ESTIMATES & FORECAST, BY REGIONAL,
    273. 2032 (USD Billions)
    274. SIZE ESTIMATES & FORECAST, BY DEPLOYMENT MODEL, 2019-2032 (USD Billions)
    275. BY ORGANIZATION SIZE, 2019-2032 (USD Billions)
    276. Visibility Market SIZE ESTIMATES & FORECAST, BY INDUSTRY VERTICAL, 2019-2032
    277. (USD Billions)
    278. & FORECAST, BY VISIBILITY SCOPE, 2019-2032 (USD Billions)
    279. Africa End-Point Visibility Market SIZE ESTIMATES & FORECAST, BY VISIBILITY
    280. FEATURES, 2019-2032 (USD Billions)
    281. Market SIZE ESTIMATES & FORECAST, BY REGIONAL, 2019-2032 (USD Billions)
    282. BY DEPLOYMENT MODEL, 2019-2032 (USD Billions)
    283. Visibility Market SIZE ESTIMATES & FORECAST, BY ORGANIZATION SIZE, 2019-2032
    284. (USD Billions)
    285. & FORECAST, BY INDUSTRY VERTICAL, 2019-2032 (USD Billions)
    286. Rest of MEA End-Point Visibility Market SIZE ESTIMATES & FORECAST, BY VISIBILITY
    287. SCOPE, 2019-2032 (USD Billions)
    288. Market SIZE ESTIMATES & FORECAST, BY VISIBILITY FEATURES, 2019-2032 (USD Billions)
    289. BY REGIONAL, 2019-2032 (USD Billions)
    290. ANALYSIS
    291. US END-POINT VISIBILITY MARKET ANALYSIS BY VISIBILITY SCOPE
    292. END-POINT VISIBILITY MARKET ANALYSIS BY VISIBILITY FEATURES
    293. VISIBILITY MARKET ANALYSIS BY REGIONAL
    294. MARKET ANALYSIS BY DEPLOYMENT MODEL
    295. MARKET ANALYSIS BY ORGANIZATION SIZE
    296. MARKET ANALYSIS BY INDUSTRY VERTICAL
    297. MARKET ANALYSIS BY VISIBILITY SCOPE
    298. MARKET ANALYSIS BY VISIBILITY FEATURES
    299. MARKET ANALYSIS BY REGIONAL
    300. ANALYSIS
    301. MODEL
    302. SIZE
    303. UK END-POINT VISIBILITY MARKET ANALYSIS BY DEPLOYMENT MODEL
    304. UK END-POINT VISIBILITY MARKET ANALYSIS BY ORGANIZATION SIZE
    305. END-POINT VISIBILITY MARKET ANALYSIS BY INDUSTRY VERTICAL
    306. VISIBILITY MARKET ANALYSIS BY VISIBILITY SCOPE
    307. MARKET ANALYSIS BY VISIBILITY FEATURES
    308. MARKET ANALYSIS BY REGIONAL
    309. ANALYSIS BY DEPLOYMENT MODEL
    310. ANALYSIS BY ORGANIZATION SIZE
    311. ANALYSIS BY INDUSTRY VERTICAL
    312. ANALYSIS BY VISIBILITY SCOPE
    313. ANALYSIS BY VISIBILITY FEATURES
    314. ANALYSIS BY REGIONAL
    315. BY DEPLOYMENT MODEL
    316. BY ORGANIZATION SIZE
    317. BY INDUSTRY VERTICAL
    318. BY VISIBILITY SCOPE
    319. BY VISIBILITY FEATURES
    320. BY REGIONAL
    321. MODEL
    322. SIZE
    323. SPAIN END-POINT VISIBILITY MARKET ANALYSIS BY DEPLOYMENT MODEL
    324. SPAIN END-POINT VISIBILITY MARKET ANALYSIS BY ORGANIZATION SIZE
    325. SPAIN END-POINT VISIBILITY MARKET ANALYSIS BY INDUSTRY VERTICAL
    326. SPAIN END-POINT VISIBILITY MARKET ANALYSIS BY VISIBILITY SCOPE
    327. SPAIN END-POINT VISIBILITY MARKET ANALYSIS BY VISIBILITY FEATURES
    328. SPAIN END-POINT VISIBILITY MARKET ANALYSIS BY REGIONAL
    329. OF EUROPE END-POINT VISIBILITY MARKET ANALYSIS BY DEPLOYMENT MODEL
    330. REST OF EUROPE END-POINT VISIBILITY MARKET ANALYSIS BY ORGANIZATION SIZE
    331. SCOPE
    332. FEATURES
    333. REGIONAL
    334. CHINA END-POINT VISIBILITY MARKET ANALYSIS BY DEPLOYMENT MODEL
    335. CHINA END-POINT VISIBILITY MARKET ANALYSIS BY ORGANIZATION SIZE
    336. CHINA END-POINT VISIBILITY MARKET ANALYSIS BY INDUSTRY VERTICAL
    337. CHINA END-POINT VISIBILITY MARKET ANALYSIS BY VISIBILITY SCOPE
    338. CHINA END-POINT VISIBILITY MARKET ANALYSIS BY VISIBILITY FEATURES
    339. CHINA END-POINT VISIBILITY MARKET ANALYSIS BY REGIONAL
    340. END-POINT VISIBILITY MARKET ANALYSIS BY DEPLOYMENT MODEL
    341. END-POINT VISIBILITY MARKET ANALYSIS BY ORGANIZATION SIZE
    342. END-POINT VISIBILITY MARKET ANALYSIS BY INDUSTRY VERTICAL
    343. END-POINT VISIBILITY MARKET ANALYSIS BY VISIBILITY SCOPE
    344. END-POINT VISIBILITY MARKET ANALYSIS BY VISIBILITY FEATURES
    345. END-POINT VISIBILITY MARKET ANALYSIS BY REGIONAL
    346. VISIBILITY MARKET ANALYSIS BY DEPLOYMENT MODEL
    347. VISIBILITY MARKET ANALYSIS BY ORGANIZATION SIZE
    348. VISIBILITY MARKET ANALYSIS BY INDUSTRY VERTICAL
    349. VISIBILITY MARKET ANALYSIS BY VISIBILITY SCOPE
    350. VISIBILITY MARKET ANALYSIS BY VISIBILITY FEATURES
    351. VISIBILITY MARKET ANALYSIS BY REGIONAL
    352. MARKET ANALYSIS BY DEPLOYMENT MODEL
    353. MARKET ANALYSIS BY ORGANIZATION SIZE
    354. MARKET ANALYSIS BY INDUSTRY VERTICAL
    355. MARKET ANALYSIS BY VISIBILITY SCOPE
    356. MARKET ANALYSIS BY VISIBILITY FEATURES
    357. MARKET ANALYSIS BY REGIONAL
    358. ANALYSIS BY DEPLOYMENT MODEL
    359. ANALYSIS BY ORGANIZATION SIZE
    360. ANALYSIS BY INDUSTRY VERTICAL
    361. ANALYSIS BY VISIBILITY SCOPE
    362. ANALYSIS BY VISIBILITY FEATURES
    363. ANALYSIS BY REGIONAL
    364. BY DEPLOYMENT MODEL
    365. BY ORGANIZATION SIZE
    366. BY INDUSTRY VERTICAL
    367. BY VISIBILITY SCOPE
    368. BY VISIBILITY FEATURES
    369. BY REGIONAL
    370. MODEL
    371. SIZE
    372. VERTICAL
    373. SCOPE
    374. FEATURES
    375. MODEL
    376. SIZE
    377. VERTICAL
    378. VISIBILITY SCOPE
    379. BY VISIBILITY FEATURES
    380. ANALYSIS BY REGIONAL
    381. ANALYSIS
    382. MODEL
    383. SIZE
    384. MEXICO END-POINT VISIBILITY MARKET ANALYSIS BY DEPLOYMENT MODEL
    385. MEXICO END-POINT VISIBILITY MARKET ANALYSIS BY ORGANIZATION SIZE
    386. MEXICO END-POINT VISIBILITY MARKET ANALYSIS BY INDUSTRY VERTICAL
    387. MEXICO END-POINT VISIBILITY MARKET ANALYSIS BY VISIBILITY SCOPE
    388. MEXICO END-POINT VISIBILITY MARKET ANALYSIS BY VISIBILITY FEATURES
    389. MEXICO END-POINT VISIBILITY MARKET ANALYSIS BY REGIONAL
    390. END-POINT VISIBILITY MARKET ANALYSIS BY DEPLOYMENT MODEL
    391. END-POINT VISIBILITY MARKET ANALYSIS BY ORGANIZATION SIZE
    392. END-POINT VISIBILITY MARKET ANALYSIS BY INDUSTRY VERTICAL
    393. END-POINT VISIBILITY MARKET ANALYSIS BY VISIBILITY SCOPE
    394. END-POINT VISIBILITY MARKET ANALYSIS BY VISIBILITY FEATURES
    395. END-POINT VISIBILITY MARKET ANALYSIS BY REGIONAL
    396. AMERICA END-POINT VISIBILITY MARKET ANALYSIS BY DEPLOYMENT MODEL
    397. REST OF SOUTH AMERICA END-POINT VISIBILITY MARKET ANALYSIS BY ORGANIZATION SIZE
    398. INDUSTRY VERTICAL
    399. ANALYSIS BY VISIBILITY SCOPE
    400. MARKET ANALYSIS BY VISIBILITY FEATURES
    401. VISIBILITY MARKET ANALYSIS BY REGIONAL
    402. MARKET ANALYSIS
    403. BY DEPLOYMENT MODEL
    404. ANALYSIS BY ORGANIZATION SIZE
    405. MARKET ANALYSIS BY INDUSTRY VERTICAL
    406. MARKET ANALYSIS BY VISIBILITY SCOPE
    407. MARKET ANALYSIS BY VISIBILITY FEATURES
    408. VISIBILITY MARKET ANALYSIS BY REGIONAL
    409. VISIBILITY MARKET ANALYSIS BY DEPLOYMENT MODEL
    410. VISIBILITY MARKET ANALYSIS BY ORGANIZATION SIZE
    411. VISIBILITY MARKET ANALYSIS BY INDUSTRY VERTICAL
    412. VISIBILITY MARKET ANALYSIS BY VISIBILITY SCOPE
    413. VISIBILITY MARKET ANALYSIS BY VISIBILITY FEATURES
    414. END-POINT VISIBILITY MARKET ANALYSIS BY REGIONAL
    415. VISIBILITY MARKET ANALYSIS BY DEPLOYMENT MODEL
    416. VISIBILITY MARKET ANALYSIS BY ORGANIZATION SIZE
    417. VISIBILITY MARKET ANALYSIS BY INDUSTRY VERTICAL
    418. VISIBILITY MARKET ANALYSIS BY VISIBILITY SCOPE
    419. VISIBILITY MARKET ANALYSIS BY VISIBILITY FEATURES
    420. END-POINT VISIBILITY MARKET ANALYSIS BY REGIONAL
    421. OF END-POINT VISIBILITY MARKET
    422. DRO ANALYSIS OF END-POINT VISIBILITY MARKET
    423. ANALYSIS: END-POINT VISIBILITY MARKET
    424. END-POINT VISIBILITY MARKET
    425. MARKET
    426. (% SHARE)
    427. TO 2032 (USD Billions)
    428. SIZE, 2024 (% SHARE)
    429. SIZE, 2019 TO 2032 (USD Billions)
    430. BY INDUSTRY VERTICAL, 2024 (% SHARE)
    431. BY INDUSTRY VERTICAL, 2019 TO 2032 (USD Billions)
    432. MARKET, BY VISIBILITY SCOPE, 2024 (% SHARE)
    433. MARKET, BY VISIBILITY SCOPE, 2019 TO 2032 (USD Billions)
    434. VISIBILITY MARKET, BY VISIBILITY FEATURES, 2024 (% SHARE)
    435. VISIBILITY MARKET, BY VISIBILITY FEATURES, 2019 TO 2032 (USD Billions)
    436. END-POINT VISIBILITY MARKET, BY REGIONAL, 2024 (% SHARE)
    437. END-POINT VISIBILITY MARKET, BY REGIONAL, 2019 TO 2032 (USD Billions)
    438. BENCHMARKING OF MAJOR COMPETITORS'

    End-Point Visibility Market Segmentation


    • End-Point Visibility Market By Deployment Model (USD Billion, 2019-2032)

      • Cloud-based
      • On-premise

    • End-Point Visibility Market By Organization Size (USD Billion, 2019-2032)

      • Small and Medium-Sized Enterprises (SMEs)
      • Large Enterprises

    • End-Point Visibility Market By Industry Vertical (USD Billion, 2019-2032)

      • Healthcare
      • IT and Telecom
      • Manufacturing
      • Financial Services
      • Retail

    • End-Point Visibility Market By Visibility Scope (USD Billion, 2019-2032)

      • Network Endpoint Visibility
      • Endpoint Device Visibility
      • Agent-based Endpoint Visibility
      • Agentless Endpoint Visibility

    • End-Point Visibility Market By Visibility Features (USD Billion, 2019-2032)

      • Asset Discovery and Inventory
      • Vulnerability Management
      • Threat Detection and Prevention
      • Patch Management
      • Remote Access Control

    • End-Point Visibility Market By Regional (USD Billion, 2019-2032)

      • North America
      • Europe
      • South America
      • Asia Pacific
      • Middle East and Africa

    End-Point Visibility Market Regional Outlook (USD Billion, 2019-2032)


    • North America Outlook (USD Billion, 2019-2032)

      • North America End-Point Visibility Market by Deployment Model Type

        • Cloud-based
        • On-premise
      • North America End-Point Visibility Market by Organization Size Type

        • Small and Medium-Sized Enterprises (SMEs)
        • Large Enterprises
      • North America End-Point Visibility Market by Industry Vertical Type

        • Healthcare
        • IT and Telecom
        • Manufacturing
        • Financial Services
        • Retail
      • North America End-Point Visibility Market by Visibility Scope Type

        • Network Endpoint Visibility
        • Endpoint Device Visibility
        • Agent-based Endpoint Visibility
        • Agentless Endpoint Visibility
      • North America End-Point Visibility Market by Visibility Features Type

        • Asset Discovery and Inventory
        • Vulnerability Management
        • Threat Detection and Prevention
        • Patch Management
        • Remote Access Control
      • North America End-Point Visibility Market by Regional Type

        • US
        • Canada
      • US Outlook (USD Billion, 2019-2032)
      • US End-Point Visibility Market by Deployment Model Type

        • Cloud-based
        • On-premise
      • US End-Point Visibility Market by Organization Size Type

        • Small and Medium-Sized Enterprises (SMEs)
        • Large Enterprises
      • US End-Point Visibility Market by Industry Vertical Type

        • Healthcare
        • IT and Telecom
        • Manufacturing
        • Financial Services
        • Retail
      • US End-Point Visibility Market by Visibility Scope Type

        • Network Endpoint Visibility
        • Endpoint Device Visibility
        • Agent-based Endpoint Visibility
        • Agentless Endpoint Visibility
      • US End-Point Visibility Market by Visibility Features Type

        • Asset Discovery and Inventory
        • Vulnerability Management
        • Threat Detection and Prevention
        • Patch Management
        • Remote Access Control
      • CANADA Outlook (USD Billion, 2019-2032)
      • CANADA End-Point Visibility Market by Deployment Model Type

        • Cloud-based
        • On-premise
      • CANADA End-Point Visibility Market by Organization Size Type

        • Small and Medium-Sized Enterprises (SMEs)
        • Large Enterprises
      • CANADA End-Point Visibility Market by Industry Vertical Type

        • Healthcare
        • IT and Telecom
        • Manufacturing
        • Financial Services
        • Retail
      • CANADA End-Point Visibility Market by Visibility Scope Type

        • Network Endpoint Visibility
        • Endpoint Device Visibility
        • Agent-based Endpoint Visibility
        • Agentless Endpoint Visibility
      • CANADA End-Point Visibility Market by Visibility Features Type

        • Asset Discovery and Inventory
        • Vulnerability Management
        • Threat Detection and Prevention
        • Patch Management
        • Remote Access Control
    • Europe Outlook (USD Billion, 2019-2032)

      • Europe End-Point Visibility Market by Deployment Model Type

        • Cloud-based
        • On-premise
      • Europe End-Point Visibility Market by Organization Size Type

        • Small and Medium-Sized Enterprises (SMEs)
        • Large Enterprises
      • Europe End-Point Visibility Market by Industry Vertical Type

        • Healthcare
        • IT and Telecom
        • Manufacturing
        • Financial Services
        • Retail
      • Europe End-Point Visibility Market by Visibility Scope Type

        • Network Endpoint Visibility
        • Endpoint Device Visibility
        • Agent-based Endpoint Visibility
        • Agentless Endpoint Visibility
      • Europe End-Point Visibility Market by Visibility Features Type

        • Asset Discovery and Inventory
        • Vulnerability Management
        • Threat Detection and Prevention
        • Patch Management
        • Remote Access Control
      • Europe End-Point Visibility Market by Regional Type

        • Germany
        • UK
        • France
        • Russia
        • Italy
        • Spain
        • Rest of Europe
      • GERMANY Outlook (USD Billion, 2019-2032)
      • GERMANY End-Point Visibility Market by Deployment Model Type

        • Cloud-based
        • On-premise
      • GERMANY End-Point Visibility Market by Organization Size Type

        • Small and Medium-Sized Enterprises (SMEs)
        • Large Enterprises
      • GERMANY End-Point Visibility Market by Industry Vertical Type

        • Healthcare
        • IT and Telecom
        • Manufacturing
        • Financial Services
        • Retail
      • GERMANY End-Point Visibility Market by Visibility Scope Type

        • Network Endpoint Visibility
        • Endpoint Device Visibility
        • Agent-based Endpoint Visibility
        • Agentless Endpoint Visibility
      • GERMANY End-Point Visibility Market by Visibility Features Type

        • Asset Discovery and Inventory
        • Vulnerability Management
        • Threat Detection and Prevention
        • Patch Management
        • Remote Access Control
      • UK Outlook (USD Billion, 2019-2032)
      • UK End-Point Visibility Market by Deployment Model Type

        • Cloud-based
        • On-premise
      • UK End-Point Visibility Market by Organization Size Type

        • Small and Medium-Sized Enterprises (SMEs)
        • Large Enterprises
      • UK End-Point Visibility Market by Industry Vertical Type

        • Healthcare
        • IT and Telecom
        • Manufacturing
        • Financial Services
        • Retail
      • UK End-Point Visibility Market by Visibility Scope Type

        • Network Endpoint Visibility
        • Endpoint Device Visibility
        • Agent-based Endpoint Visibility
        • Agentless Endpoint Visibility
      • UK End-Point Visibility Market by Visibility Features Type

        • Asset Discovery and Inventory
        • Vulnerability Management
        • Threat Detection and Prevention
        • Patch Management
        • Remote Access Control
      • FRANCE Outlook (USD Billion, 2019-2032)
      • FRANCE End-Point Visibility Market by Deployment Model Type

        • Cloud-based
        • On-premise
      • FRANCE End-Point Visibility Market by Organization Size Type

        • Small and Medium-Sized Enterprises (SMEs)
        • Large Enterprises
      • FRANCE End-Point Visibility Market by Industry Vertical Type

        • Healthcare
        • IT and Telecom
        • Manufacturing
        • Financial Services
        • Retail
      • FRANCE End-Point Visibility Market by Visibility Scope Type

        • Network Endpoint Visibility
        • Endpoint Device Visibility
        • Agent-based Endpoint Visibility
        • Agentless Endpoint Visibility
      • FRANCE End-Point Visibility Market by Visibility Features Type

        • Asset Discovery and Inventory
        • Vulnerability Management
        • Threat Detection and Prevention
        • Patch Management
        • Remote Access Control
      • RUSSIA Outlook (USD Billion, 2019-2032)
      • RUSSIA End-Point Visibility Market by Deployment Model Type

        • Cloud-based
        • On-premise
      • RUSSIA End-Point Visibility Market by Organization Size Type

        • Small and Medium-Sized Enterprises (SMEs)
        • Large Enterprises
      • RUSSIA End-Point Visibility Market by Industry Vertical Type

        • Healthcare
        • IT and Telecom
        • Manufacturing
        • Financial Services
        • Retail
      • RUSSIA End-Point Visibility Market by Visibility Scope Type

        • Network Endpoint Visibility
        • Endpoint Device Visibility
        • Agent-based Endpoint Visibility
        • Agentless Endpoint Visibility
      • RUSSIA End-Point Visibility Market by Visibility Features Type

        • Asset Discovery and Inventory
        • Vulnerability Management
        • Threat Detection and Prevention
        • Patch Management
        • Remote Access Control
      • ITALY Outlook (USD Billion, 2019-2032)
      • ITALY End-Point Visibility Market by Deployment Model Type

        • Cloud-based
        • On-premise
      • ITALY End-Point Visibility Market by Organization Size Type

        • Small and Medium-Sized Enterprises (SMEs)
        • Large Enterprises
      • ITALY End-Point Visibility Market by Industry Vertical Type

        • Healthcare
        • IT and Telecom
        • Manufacturing
        • Financial Services
        • Retail
      • ITALY End-Point Visibility Market by Visibility Scope Type

        • Network Endpoint Visibility
        • Endpoint Device Visibility
        • Agent-based Endpoint Visibility
        • Agentless Endpoint Visibility
      • ITALY End-Point Visibility Market by Visibility Features Type

        • Asset Discovery and Inventory
        • Vulnerability Management
        • Threat Detection and Prevention
        • Patch Management
        • Remote Access Control
      • SPAIN Outlook (USD Billion, 2019-2032)
      • SPAIN End-Point Visibility Market by Deployment Model Type

        • Cloud-based
        • On-premise
      • SPAIN End-Point Visibility Market by Organization Size Type

        • Small and Medium-Sized Enterprises (SMEs)
        • Large Enterprises
      • SPAIN End-Point Visibility Market by Industry Vertical Type

        • Healthcare
        • IT and Telecom
        • Manufacturing
        • Financial Services
        • Retail
      • SPAIN End-Point Visibility Market by Visibility Scope Type

        • Network Endpoint Visibility
        • Endpoint Device Visibility
        • Agent-based Endpoint Visibility
        • Agentless Endpoint Visibility
      • SPAIN End-Point Visibility Market by Visibility Features Type

        • Asset Discovery and Inventory
        • Vulnerability Management
        • Threat Detection and Prevention
        • Patch Management
        • Remote Access Control
      • REST OF EUROPE Outlook (USD Billion, 2019-2032)
      • REST OF EUROPE End-Point Visibility Market by Deployment Model Type

        • Cloud-based
        • On-premise
      • REST OF EUROPE End-Point Visibility Market by Organization Size Type

        • Small and Medium-Sized Enterprises (SMEs)
        • Large Enterprises
      • REST OF EUROPE End-Point Visibility Market by Industry Vertical Type

        • Healthcare
        • IT and Telecom
        • Manufacturing
        • Financial Services
        • Retail
      • REST OF EUROPE End-Point Visibility Market by Visibility Scope Type

        • Network Endpoint Visibility
        • Endpoint Device Visibility
        • Agent-based Endpoint Visibility
        • Agentless Endpoint Visibility
      • REST OF EUROPE End-Point Visibility Market by Visibility Features Type

        • Asset Discovery and Inventory
        • Vulnerability Management
        • Threat Detection and Prevention
        • Patch Management
        • Remote Access Control
    • APAC Outlook (USD Billion, 2019-2032)

      • APAC End-Point Visibility Market by Deployment Model Type

        • Cloud-based
        • On-premise
      • APAC End-Point Visibility Market by Organization Size Type

        • Small and Medium-Sized Enterprises (SMEs)
        • Large Enterprises
      • APAC End-Point Visibility Market by Industry Vertical Type

        • Healthcare
        • IT and Telecom
        • Manufacturing
        • Financial Services
        • Retail
      • APAC End-Point Visibility Market by Visibility Scope Type

        • Network Endpoint Visibility
        • Endpoint Device Visibility
        • Agent-based Endpoint Visibility
        • Agentless Endpoint Visibility
      • APAC End-Point Visibility Market by Visibility Features Type

        • Asset Discovery and Inventory
        • Vulnerability Management
        • Threat Detection and Prevention
        • Patch Management
        • Remote Access Control
      • APAC End-Point Visibility Market by Regional Type

        • China
        • India
        • Japan
        • South Korea
        • Malaysia
        • Thailand
        • Indonesia
        • Rest of APAC
      • CHINA Outlook (USD Billion, 2019-2032)
      • CHINA End-Point Visibility Market by Deployment Model Type

        • Cloud-based
        • On-premise
      • CHINA End-Point Visibility Market by Organization Size Type

        • Small and Medium-Sized Enterprises (SMEs)
        • Large Enterprises
      • CHINA End-Point Visibility Market by Industry Vertical Type

        • Healthcare
        • IT and Telecom
        • Manufacturing
        • Financial Services
        • Retail
      • CHINA End-Point Visibility Market by Visibility Scope Type

        • Network Endpoint Visibility
        • Endpoint Device Visibility
        • Agent-based Endpoint Visibility
        • Agentless Endpoint Visibility
      • CHINA End-Point Visibility Market by Visibility Features Type

        • Asset Discovery and Inventory
        • Vulnerability Management
        • Threat Detection and Prevention
        • Patch Management
        • Remote Access Control
      • INDIA Outlook (USD Billion, 2019-2032)
      • INDIA End-Point Visibility Market by Deployment Model Type

        • Cloud-based
        • On-premise
      • INDIA End-Point Visibility Market by Organization Size Type

        • Small and Medium-Sized Enterprises (SMEs)
        • Large Enterprises
      • INDIA End-Point Visibility Market by Industry Vertical Type

        • Healthcare
        • IT and Telecom
        • Manufacturing
        • Financial Services
        • Retail
      • INDIA End-Point Visibility Market by Visibility Scope Type

        • Network Endpoint Visibility
        • Endpoint Device Visibility
        • Agent-based Endpoint Visibility
        • Agentless Endpoint Visibility
      • INDIA End-Point Visibility Market by Visibility Features Type

        • Asset Discovery and Inventory
        • Vulnerability Management
        • Threat Detection and Prevention
        • Patch Management
        • Remote Access Control
      • JAPAN Outlook (USD Billion, 2019-2032)
      • JAPAN End-Point Visibility Market by Deployment Model Type

        • Cloud-based
        • On-premise
      • JAPAN End-Point Visibility Market by Organization Size Type

        • Small and Medium-Sized Enterprises (SMEs)
        • Large Enterprises
      • JAPAN End-Point Visibility Market by Industry Vertical Type

        • Healthcare
        • IT and Telecom
        • Manufacturing
        • Financial Services
        • Retail
      • JAPAN End-Point Visibility Market by Visibility Scope Type

        • Network Endpoint Visibility
        • Endpoint Device Visibility
        • Agent-based Endpoint Visibility
        • Agentless Endpoint Visibility
      • JAPAN End-Point Visibility Market by Visibility Features Type

        • Asset Discovery and Inventory
        • Vulnerability Management
        • Threat Detection and Prevention
        • Patch Management
        • Remote Access Control
      • SOUTH KOREA Outlook (USD Billion, 2019-2032)
      • SOUTH KOREA End-Point Visibility Market by Deployment Model Type

        • Cloud-based
        • On-premise
      • SOUTH KOREA End-Point Visibility Market by Organization Size Type

        • Small and Medium-Sized Enterprises (SMEs)
        • Large Enterprises
      • SOUTH KOREA End-Point Visibility Market by Industry Vertical Type

        • Healthcare
        • IT and Telecom
        • Manufacturing
        • Financial Services
        • Retail
      • SOUTH KOREA End-Point Visibility Market by Visibility Scope Type

        • Network Endpoint Visibility
        • Endpoint Device Visibility
        • Agent-based Endpoint Visibility
        • Agentless Endpoint Visibility
      • SOUTH KOREA End-Point Visibility Market by Visibility Features Type

        • Asset Discovery and Inventory
        • Vulnerability Management
        • Threat Detection and Prevention
        • Patch Management
        • Remote Access Control
      • MALAYSIA Outlook (USD Billion, 2019-2032)
      • MALAYSIA End-Point Visibility Market by Deployment Model Type

        • Cloud-based
        • On-premise
      • MALAYSIA End-Point Visibility Market by Organization Size Type

        • Small and Medium-Sized Enterprises (SMEs)
        • Large Enterprises
      • MALAYSIA End-Point Visibility Market by Industry Vertical Type

        • Healthcare
        • IT and Telecom
        • Manufacturing
        • Financial Services
        • Retail
      • MALAYSIA End-Point Visibility Market by Visibility Scope Type

        • Network Endpoint Visibility
        • Endpoint Device Visibility
        • Agent-based Endpoint Visibility
        • Agentless Endpoint Visibility
      • MALAYSIA End-Point Visibility Market by Visibility Features Type

        • Asset Discovery and Inventory
        • Vulnerability Management
        • Threat Detection and Prevention
        • Patch Management
        • Remote Access Control
      • THAILAND Outlook (USD Billion, 2019-2032)
      • THAILAND End-Point Visibility Market by Deployment Model Type

        • Cloud-based
        • On-premise
      • THAILAND End-Point Visibility Market by Organization Size Type

        • Small and Medium-Sized Enterprises (SMEs)
        • Large Enterprises
      • THAILAND End-Point Visibility Market by Industry Vertical Type

        • Healthcare
        • IT and Telecom
        • Manufacturing
        • Financial Services
        • Retail
      • THAILAND End-Point Visibility Market by Visibility Scope Type

        • Network Endpoint Visibility
        • Endpoint Device Visibility
        • Agent-based Endpoint Visibility
        • Agentless Endpoint Visibility
      • THAILAND End-Point Visibility Market by Visibility Features Type

        • Asset Discovery and Inventory
        • Vulnerability Management
        • Threat Detection and Prevention
        • Patch Management
        • Remote Access Control
      • INDONESIA Outlook (USD Billion, 2019-2032)
      • INDONESIA End-Point Visibility Market by Deployment Model Type

        • Cloud-based
        • On-premise
      • INDONESIA End-Point Visibility Market by Organization Size Type

        • Small and Medium-Sized Enterprises (SMEs)
        • Large Enterprises
      • INDONESIA End-Point Visibility Market by Industry Vertical Type

        • Healthcare
        • IT and Telecom
        • Manufacturing
        • Financial Services
        • Retail
      • INDONESIA End-Point Visibility Market by Visibility Scope Type

        • Network Endpoint Visibility
        • Endpoint Device Visibility
        • Agent-based Endpoint Visibility
        • Agentless Endpoint Visibility
      • INDONESIA End-Point Visibility Market by Visibility Features Type

        • Asset Discovery and Inventory
        • Vulnerability Management
        • Threat Detection and Prevention
        • Patch Management
        • Remote Access Control
      • REST OF APAC Outlook (USD Billion, 2019-2032)
      • REST OF APAC End-Point Visibility Market by Deployment Model Type

        • Cloud-based
        • On-premise
      • REST OF APAC End-Point Visibility Market by Organization Size Type

        • Small and Medium-Sized Enterprises (SMEs)
        • Large Enterprises
      • REST OF APAC End-Point Visibility Market by Industry Vertical Type

        • Healthcare
        • IT and Telecom
        • Manufacturing
        • Financial Services
        • Retail
      • REST OF APAC End-Point Visibility Market by Visibility Scope Type

        • Network Endpoint Visibility
        • Endpoint Device Visibility
        • Agent-based Endpoint Visibility
        • Agentless Endpoint Visibility
      • REST OF APAC End-Point Visibility Market by Visibility Features Type

        • Asset Discovery and Inventory
        • Vulnerability Management
        • Threat Detection and Prevention
        • Patch Management
        • Remote Access Control
    • South America Outlook (USD Billion, 2019-2032)

      • South America End-Point Visibility Market by Deployment Model Type

        • Cloud-based
        • On-premise
      • South America End-Point Visibility Market by Organization Size Type

        • Small and Medium-Sized Enterprises (SMEs)
        • Large Enterprises
      • South America End-Point Visibility Market by Industry Vertical Type

        • Healthcare
        • IT and Telecom
        • Manufacturing
        • Financial Services
        • Retail
      • South America End-Point Visibility Market by Visibility Scope Type

        • Network Endpoint Visibility
        • Endpoint Device Visibility
        • Agent-based Endpoint Visibility
        • Agentless Endpoint Visibility
      • South America End-Point Visibility Market by Visibility Features Type

        • Asset Discovery and Inventory
        • Vulnerability Management
        • Threat Detection and Prevention
        • Patch Management
        • Remote Access Control
      • South America End-Point Visibility Market by Regional Type

        • Brazil
        • Mexico
        • Argentina
        • Rest of South America
      • BRAZIL Outlook (USD Billion, 2019-2032)
      • BRAZIL End-Point Visibility Market by Deployment Model Type

        • Cloud-based
        • On-premise
      • BRAZIL End-Point Visibility Market by Organization Size Type

        • Small and Medium-Sized Enterprises (SMEs)
        • Large Enterprises
      • BRAZIL End-Point Visibility Market by Industry Vertical Type

        • Healthcare
        • IT and Telecom
        • Manufacturing
        • Financial Services
        • Retail
      • BRAZIL End-Point Visibility Market by Visibility Scope Type

        • Network Endpoint Visibility
        • Endpoint Device Visibility
        • Agent-based Endpoint Visibility
        • Agentless Endpoint Visibility
      • BRAZIL End-Point Visibility Market by Visibility Features Type

        • Asset Discovery and Inventory
        • Vulnerability Management
        • Threat Detection and Prevention
        • Patch Management
        • Remote Access Control
      • MEXICO Outlook (USD Billion, 2019-2032)
      • MEXICO End-Point Visibility Market by Deployment Model Type

        • Cloud-based
        • On-premise
      • MEXICO End-Point Visibility Market by Organization Size Type

        • Small and Medium-Sized Enterprises (SMEs)
        • Large Enterprises
      • MEXICO End-Point Visibility Market by Industry Vertical Type

        • Healthcare
        • IT and Telecom
        • Manufacturing
        • Financial Services
        • Retail
      • MEXICO End-Point Visibility Market by Visibility Scope Type

        • Network Endpoint Visibility
        • Endpoint Device Visibility
        • Agent-based Endpoint Visibility
        • Agentless Endpoint Visibility
      • MEXICO End-Point Visibility Market by Visibility Features Type

        • Asset Discovery and Inventory
        • Vulnerability Management
        • Threat Detection and Prevention
        • Patch Management
        • Remote Access Control
      • ARGENTINA Outlook (USD Billion, 2019-2032)
      • ARGENTINA End-Point Visibility Market by Deployment Model Type

        • Cloud-based
        • On-premise
      • ARGENTINA End-Point Visibility Market by Organization Size Type

        • Small and Medium-Sized Enterprises (SMEs)
        • Large Enterprises
      • ARGENTINA End-Point Visibility Market by Industry Vertical Type

        • Healthcare
        • IT and Telecom
        • Manufacturing
        • Financial Services
        • Retail
      • ARGENTINA End-Point Visibility Market by Visibility Scope Type

        • Network Endpoint Visibility
        • Endpoint Device Visibility
        • Agent-based Endpoint Visibility
        • Agentless Endpoint Visibility
      • ARGENTINA End-Point Visibility Market by Visibility Features Type

        • Asset Discovery and Inventory
        • Vulnerability Management
        • Threat Detection and Prevention
        • Patch Management
        • Remote Access Control
      • REST OF SOUTH AMERICA Outlook (USD Billion, 2019-2032)
      • REST OF SOUTH AMERICA End-Point Visibility Market by Deployment Model Type

        • Cloud-based
        • On-premise
      • REST OF SOUTH AMERICA End-Point Visibility Market by Organization Size Type

        • Small and Medium-Sized Enterprises (SMEs)
        • Large Enterprises
      • REST OF SOUTH AMERICA End-Point Visibility Market by Industry Vertical Type

        • Healthcare
        • IT and Telecom
        • Manufacturing
        • Financial Services
        • Retail
      • REST OF SOUTH AMERICA End-Point Visibility Market by Visibility Scope Type

        • Network Endpoint Visibility
        • Endpoint Device Visibility
        • Agent-based Endpoint Visibility
        • Agentless Endpoint Visibility
      • REST OF SOUTH AMERICA End-Point Visibility Market by Visibility Features Type

        • Asset Discovery and Inventory
        • Vulnerability Management
        • Threat Detection and Prevention
        • Patch Management
        • Remote Access Control
    • MEA Outlook (USD Billion, 2019-2032)

      • MEA End-Point Visibility Market by Deployment Model Type

        • Cloud-based
        • On-premise
      • MEA End-Point Visibility Market by Organization Size Type

        • Small and Medium-Sized Enterprises (SMEs)
        • Large Enterprises
      • MEA End-Point Visibility Market by Industry Vertical Type

        • Healthcare
        • IT and Telecom
        • Manufacturing
        • Financial Services
        • Retail
      • MEA End-Point Visibility Market by Visibility Scope Type

        • Network Endpoint Visibility
        • Endpoint Device Visibility
        • Agent-based Endpoint Visibility
        • Agentless Endpoint Visibility
      • MEA End-Point Visibility Market by Visibility Features Type

        • Asset Discovery and Inventory
        • Vulnerability Management
        • Threat Detection and Prevention
        • Patch Management
        • Remote Access Control
      • MEA End-Point Visibility Market by Regional Type

        • GCC Countries
        • South Africa
        • Rest of MEA
      • GCC COUNTRIES Outlook (USD Billion, 2019-2032)
      • GCC COUNTRIES End-Point Visibility Market by Deployment Model Type

        • Cloud-based
        • On-premise
      • GCC COUNTRIES End-Point Visibility Market by Organization Size Type

        • Small and Medium-Sized Enterprises (SMEs)
        • Large Enterprises
      • GCC COUNTRIES End-Point Visibility Market by Industry Vertical Type

        • Healthcare
        • IT and Telecom
        • Manufacturing
        • Financial Services
        • Retail
      • GCC COUNTRIES End-Point Visibility Market by Visibility Scope Type

        • Network Endpoint Visibility
        • Endpoint Device Visibility
        • Agent-based Endpoint Visibility
        • Agentless Endpoint Visibility
      • GCC COUNTRIES End-Point Visibility Market by Visibility Features Type

        • Asset Discovery and Inventory
        • Vulnerability Management
        • Threat Detection and Prevention
        • Patch Management
        • Remote Access Control
      • SOUTH AFRICA Outlook (USD Billion, 2019-2032)
      • SOUTH AFRICA End-Point Visibility Market by Deployment Model Type

        • Cloud-based
        • On-premise
      • SOUTH AFRICA End-Point Visibility Market by Organization Size Type

        • Small and Medium-Sized Enterprises (SMEs)
        • Large Enterprises
      • SOUTH AFRICA End-Point Visibility Market by Industry Vertical Type

        • Healthcare
        • IT and Telecom
        • Manufacturing
        • Financial Services
        • Retail
      • SOUTH AFRICA End-Point Visibility Market by Visibility Scope Type

        • Network Endpoint Visibility
        • Endpoint Device Visibility
        • Agent-based Endpoint Visibility
        • Agentless Endpoint Visibility
      • SOUTH AFRICA End-Point Visibility Market by Visibility Features Type

        • Asset Discovery and Inventory
        • Vulnerability Management
        • Threat Detection and Prevention
        • Patch Management
        • Remote Access Control
      • REST OF MEA Outlook (USD Billion, 2019-2032)
      • REST OF MEA End-Point Visibility Market by Deployment Model Type

        • Cloud-based
        • On-premise
      • REST OF MEA End-Point Visibility Market by Organization Size Type

        • Small and Medium-Sized Enterprises (SMEs)
        • Large Enterprises
      • REST OF MEA End-Point Visibility Market by Industry Vertical Type

        • Healthcare
        • IT and Telecom
        • Manufacturing
        • Financial Services
        • Retail
      • REST OF MEA End-Point Visibility Market by Visibility Scope Type

        • Network Endpoint Visibility
        • Endpoint Device Visibility
        • Agent-based Endpoint Visibility
        • Agentless Endpoint Visibility
      • REST OF MEA End-Point Visibility Market by Visibility Features Type

        • Asset Discovery and Inventory
        • Vulnerability Management
        • Threat Detection and Prevention
        • Patch Management
        • Remote Access Control


    Report Infographic
    Free Sample Request

    Kindly complete the form below to receive a free sample of this Report

    Customer Strories

    “I am very pleased with how market segments have been defined in a relevant way for my purposes (such as "Portable Freezers & refrigerators" and "last-mile"). In general the report is well structured. Thanks very much for your efforts.”

    Victoria Milne Founder
    Case Study

    Chemicals and Materials