• Cat-intel
  • MedIntelliX
  • Resources
  • About Us
  • Request Free Sample ×

    Kindly complete the form below to receive a free sample of this Report

    Leading companies partner with us for data-driven Insights

    clients tt-cursor

    Smart Connected Assets Operation Market

    ID: MRFR/SEM/32358-HCR
    100 Pages
    Aarti Dhapte
    September 2025

    Smart Connected Assets and Operations Market Research Report By Technology (Internet of Things, Artificial Intelligence, Blockchain, Big Data Analytics), By Deployment Type (On-Premises, Cloud-Based, Hybrid), By Solution (Asset Management, Operations Management, Field Service Management, Supply Chain Management), By End Use Industry (Manufacturing, Healthcare, Transportation and Logistics, Energy and Utilities) and By Regional (North America, Europe, South America, Asia Pacific, Middle East and Africa) - Forecast to 2034

    Share:
    Download PDF ×

    We do not share your information with anyone. However, we may send you emails based on your report interest from time to time. You may contact us at any time to opt-out.

    Smart Connected Assets And Operation Market Research Report-Forecast Till 2034 Infographic
    Purchase Options
    $ 4,950.0
    $ 7,250.0
    $ 5,950.0
    Table of Contents

    Smart Connected Assets Operation Market Summary

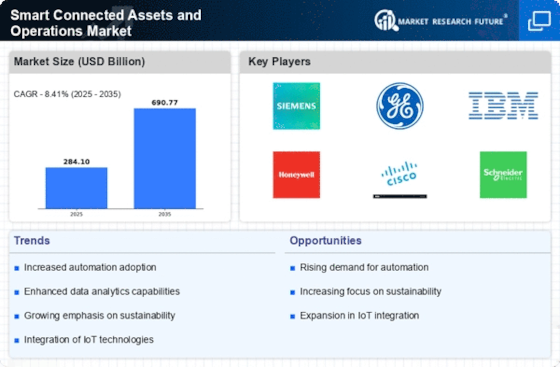
    The Global Smart Connected Assets and Operations Market is projected to grow significantly from 284.1 USD Billion in 2024 to 690.7 USD Billion by 2035.

    Key Market Trends & Highlights

    Smart Connected Assets and Operations Key Trends and Highlights

    • The market is expected to experience a compound annual growth rate (CAGR) of 8.41 percent from 2025 to 2035.
    • By 2035, the market valuation is anticipated to reach 690.7 USD Billion, indicating robust growth potential.
    • In 2024, the market is valued at 284.1 USD Billion, reflecting a strong foundation for future expansion.
    • Growing adoption of smart technologies due to increased operational efficiency is a major market driver.

    Market Size & Forecast

    2024 Market Size 284.1 (USD Billion)
    2035 Market Size 690.7 (USD Billion)
    CAGR (2025-2035) 8.41%

    Major Players

    Oracle, Cisco Systems, Abbott Laboratories, SAP, Honeywell, Microsoft, Hitachi, IBM, General Electric, PTC, Emerson Electric, Bosch, Schneider Electric, Siemens, Rockwell Automation

    Smart Connected Assets Operation Market Trends

    The Smart Connected Assets and Operations Market is primarily driven by the increasing adoption of Internet of Things technology, which facilitates enhanced connectivity and data sharing among devices. This connectivity allows organizations to improve operational efficiency, reduce costs, and optimize asset management. Another key driver is the rising demand for real-time data analytics, enabling businesses to make informed decisions quickly. Environmental considerations, along with regulatory pressures to adopt sustainable practices, further push industries toward smart connected solutions. There are numerous opportunities to be explored in the realm of smart connected assets, particularly within the industrial automation sector.

    The integration of smart connected assets into operational frameworks is poised to enhance efficiency and sustainability across various sectors, reflecting a transformative shift in how industries leverage technology for competitive advantage.

    U.S. Department of Commerce

    Smart Connected Assets Operation Market Drivers

    Increased Demand for Automation

    The Global Smart Connected Assets and Operations Market Industry experiences a surge in demand for automation across various sectors. Industries are increasingly adopting smart connected technologies to enhance operational efficiency and reduce costs. For instance, manufacturing firms are integrating IoT devices to streamline production processes, leading to improved productivity. This trend is expected to contribute to the market's growth, with projections indicating a market value of 284.1 USD Billion in 2024. As organizations seek to optimize their operations, the automation of processes through smart connected assets becomes a pivotal driver in the industry.

    Market Segment Insights

    Smart Connected Assets and Operations Market Technology Insights

    The Smart Connected Assets and Operations Market within the Technology segment, propelled by advancements in various technologies, is currently valued at 241.72 USD Billion in 2023 and is expected to reach 500.0 USD Billion by 2032. Among the major components driving market growth is the Internet of Things, which stands at a valuation of 85.0 USD Billion in 2023 and is projected to double to 170.0 USD Billion by 2032, showcasing its majority holding in the market.

    The significance of the Internet of Things lies in its capability to connect devices and systems, thereby enhancing operational efficiency and enabling data-driven decision-making in real time.

    Following closely, Artificial Intelligence is valued at 60.0 USD Billion in 2023, with expectations of reaching 120.0 USD Billion by 2032; its role in automating processes and improving analytics adds a crucial layer of intelligence that aids businesses in better resource management and predictive maintenance. Blockchain technology also plays a pivotal role in ensuring transparency and security in transactions, holding a valuation of 32.0 USD Billion in 2023 and is anticipated to rise to 56.0 USD Billion by 2032, which underpins its growing importance in supply chain management and data integrity.

    Meanwhile, Big Data Analytics is valued at 64.72 USD Billion in 2023, expected to climb to 154.0 USD Billion by 2032, highlighting its significant impact on extracting actionable insights from vast amounts of data, which is instrumental for strategic planning and operational improvements. The combined dynamics of these technologies within the Smart Connected Assets and Operations Market reflect not only a robust growth trajectory but also the critical opportunities they present for various industries aiming to improve operational efficiencies, enhance connectivity, and leverage data analytics for informed decision-making.

    The increasing integration of these technologies signals a trend toward more interconnected and intelligent operational frameworks that are transforming traditional asset management and operational strategies.

    Smart Connected Assets and Operations Market by type

    Source: Primary Research, Secondary Research, MRFR Database and Analyst Revie

    Smart Connected Assets and Operations Market Deployment Type Insights

    The Smart Connected Assets and Operations Market is projected to be valued at 241.72 USD Billion in 2023, with a diverse structure that includes various Deployment Types such as On-Premises, Cloud-Based, and Hybrid systems. Each of these types offers unique advantages, catering to varying organizational needs and preferences. On-Premises solutions have historically provided enhanced security and greater control over data, making them a significant choice for industries with strict compliance requirements. Conversely, Cloud-Based deployments are rising in prominence due to their scalability, cost efficiency, and the flexibility they offer businesses to adapt to changing market conditions.

    The Hybrid model, combining elements from both On-Premises and Cloud solutions, is also gaining traction as it allows organizations to customize their infrastructure effectively and mitigate risks associated with data privacy. This segmentation reflects the increasing complexity of the Smart Connected Assets and Operations Market, enabling companies to select deployment options that best align with their operational strategies and growth ambitions. Market trends indicate that the growth drivers for these Deployment Types include the accelerating adoption of IoT technologies and the need for real-time data analytics across industries.

    However, challenges such as cybersecurity threats and integration issues remain critical considerations for businesses navigating this evolving landscape

    Smart Connected Assets and Operations Market Solution Insights

    The Smart Connected Assets and Operations Market is projected to reach a valuation of 241.72 USD Billion in 2023, showcasing its robust growth trajectory. Among the various solutions, Asset Management plays a crucial role by enhancing the efficiency of asset usage and maximizing return on investments. Operations Management is also significant, streamlining processes to improve productivity across industries. Field Service Management supports businesses in optimizing service delivery and enhancing customer satisfaction. Additionally, Supply Chain Management is instrumental in overseeing the flow of goods and services, thereby driving operational effectiveness.

    Each of these solutions contributes to the comprehensive Smart Connected Assets and Operations Market statistics, highlighting the diversity and interconnectivity within the market that propels its continued expansion and relevance in today's digital landscape

    Smart Connected Assets and Operations Market End Use Industry Insights

    The Smart Connected Assets and Operations Market revenue is positioned for significant growth as it progresses through various end-use industries, expected to reach 241.72 billion USD in 2023. The manufacturing sector plays a crucial role, utilizing smart connected assets to enhance operational efficiency and reduce costs. In healthcare, the integration of smart solutions improves patient care and resource management, showcasing the vitality of this segment. Transportation and logistics benefit from asset connectivity, allowing for real-time tracking and optimization of supply chains.

    Energy and utilities are transforming through smart grids and connected devices, enabling better management of resources and sustainability initiatives. Trends influencing the Smart Connected Assets and Operations Market statistics include increased automation, the rise of the Internet of Things (IoT), and a growing focus on sustainability. While growth drivers encompass the need for efficiency and data-driven decision-making, challenges such as cybersecurity risks and integration complexities remain pertinent. Overall, these insights into the various industries underline the significance of the Smart Connected Assets and Operations Market data in shaping modern operational landscapes.

    Regional Insights

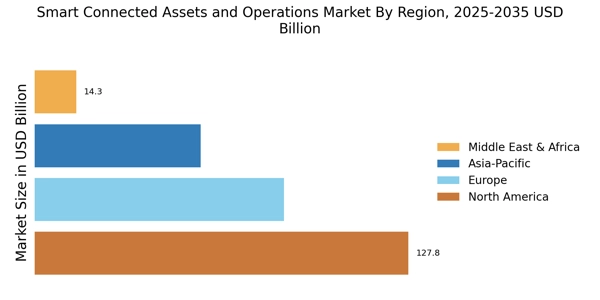
    The Smart Connected Assets and Operations Market is witnessing substantial growth across various regions, with a projected total valuation of 241.72 USD Billion in 2023, escalating to 500.0 USD Billion by 2032. In this regional analysis, North America emerges as a dominant player, holding a significant share valued at 102.5 USD Billion in 2023 and expected to reach 205.0 USD Billion by 2032, driven by robust technological advancements and high adoption rates.

    Europe also reflects notable growth with a valuation of 65.0 USD Billion in 2023, likely doubling to 130.0 USD Billion by 2032, propelled by increased investments in smart technologies.

    The APAC region, with its current market valuation of 60.0 USD Billion in 2023, is expected to reach 120.0 USD Billion, fueled by rapid industrialization and urbanization. Meanwhile, South America shows potential with a valuation starting at 10.0 USD Billion in 2023, projected to double by 2032. The Middle East and Africa (MEA) region, although currently valued at 4.22 USD Billion in 2023, is anticipated to experience substantial growth, potentially reaching 25.0 USD Billion.

    Factors such as technological innovation, enhanced connectivity, and increased operational efficiencies are contributing to the overall market dynamics, presenting both challenges and opportunities within the Smart Connected Assets and Operations Market segmentation.

    Smart Connected Assets and Operations Market By Region

    Source: Primary Research, Secondary Research, MRFR Database and Analyst Review

    Key Players and Competitive Insights

    The Smart Connected Assets and Operations Market is rapidly evolving, driven by the rise of the Internet of Things (IoT) and the increasing demand for automation and intelligent asset management solutions. Organizations across various industries are investing in smart connected technologies to enhance operational efficiency, streamline processes, and improve decision-making capabilities. This market is characterized by a diverse landscape of competitors that offer innovative products and services aimed at integrating physical assets with digital technologies. Companies are leveraging data analytics, cloud computing, and machine learning to gain insights into asset performance, predictive maintenance, and operational efficiencies.

    The competitive dynamics in this market are influenced by factors such as technological advancements, partnerships and collaborations, and an increasing focus on sustainability in asset management. Oracle has established a strong presence in the Smart Connected Assets and Operations Market, renowned for its comprehensive suite of solutions that empower organizations to enhance asset visibility and improve operational performance. The company's cloud-based platforms provide seamless integration of IoT data with enterprise applications, enabling businesses to analyze and respond to asset conditions in real time.

    With a focus on delivering actionable insights, Oracle's offerings facilitate predictive maintenance and the optimization of asset lifecycles. The company's robust infrastructure enables scalability and flexibility, allowing organizations to adapt to evolving market needs. Additionally, Oracle's commitment to security and compliance positions it favorably in the market, as enterprises prioritize safeguarding their data and operations in an increasingly interconnected environment. Cisco Systems plays a pivotal role in the Smart Connected Assets and Operations Market by combining networking capabilities with advanced IoT solutions.

    Known for its leadership in connectivity, Cisco provides a robust framework for secure and reliable communication between devices and systems. The company's innovative IoT platforms enable organizations to collect, analyze, and act upon data generated from connected assets, driving efficiency and creating value. Cisco Systems also emphasizes the importance of cybersecurity, ensuring that interconnected operations are safeguarded against potential threats. By leveraging its experience in networking and security, Cisco empowers businesses with solutions that not only optimize asset utilization but also promote seamless collaboration across various operational domains.

    Its strategic partnerships and continuous investment in R&D further enhance its competitive edge in the smart connected ecosystem.

    Key Companies in the Smart Connected Assets Operation Market market include

    Industry Developments

    Recent developments in the Smart Connected Assets and Operations Market have been characterized by significant advancements and strategic moves by leading companies such as Oracle, Cisco Systems, and Microsoft. These organizations are increasingly focusing on enhancing operational efficiency through advanced analytics and IoT integration. Current affairs indicate that companies like Honeywell and Siemens are pursuing innovations in smart energy management solutions, aiming to utilize AI to optimize asset performance. Notable mergers and acquisitions have taken place, such as SAP's acquisition of several AI-driven startups to bolster its cloud offerings.

    Similarly, Rockwell Automation and Schneider Electric are collaborating to develop smart manufacturing solutions that fuse data intelligence with automation to drive productivity. Additionally, IBM's recent ventures into quantum computing promise to revolutionize asset management through predictive analytics. The overall market valuation for these sectors is expected to expand significantly, reflecting the growing adoption of smart technologies across industries, thereby impacting operational strategies and stimulating investment opportunities for companies like General Electric, Bosch, and Emerson Electric.

    Future Outlook

    Smart Connected Assets Operation Market Future Outlook

    The Smart Connected Assets and Operations Market is projected to grow at 8.41% CAGR from 2024 to 2035, driven by advancements in IoT, AI integration, and increased demand for operational efficiency.

    New opportunities lie in:

    • Develop AI-driven predictive maintenance solutions for asset management.
    • Implement blockchain technology to enhance supply chain transparency.
    • Create customizable IoT platforms tailored for specific industry needs.

    By 2035, the market is expected to achieve substantial growth, reflecting robust innovation and strategic investments.

    Market Segmentation

    Smart Connected Assets and Operations Market Regional Outlook

    • North America
    • Europe
    • South America
    • Asia Pacific
    • Middle East and Africa

    Smart Connected Assets and Operations Market Solution Outlook

    • Asset Management
    • Operations Management
    • Field Service Management
    • Supply Chain Management

    Smart Connected Assets and Operations Market Technology Outlook

    • Internet of Things
    • Artificial Intelligence
    • Blockchain
    • Big Data Analytics

    Smart Connected Assets and Operations Market Deployment Type Outlook

    • On-Premises
    • Cloud-Based
    • Hybrid

    Smart Connected Assets and Operations Market End Use Industry Outlook

    • Manufacturing
    • Healthcare
    • Transportation and Logistics
    • Energy and Utilities

    Report Scope

    Report Attribute/Metric Details
    Market Size 2024 USD 284.10 Billion
    Market Size 2025 USD 308.39 Billion
    Market Size 2034 USD 637.16 Billion
    Compound Annual Growth Rate (CAGR) 8.41% (2025-2034)
    Base Year 2024
    Market Forecast Period 2025-2034
    Historical Data 2020-2023
    Market Forecast Units USD Billion
    Key Companies Profiled Oracle, Cisco Systems, Abbott Laboratories, SAP, Honeywell, Microsoft, Hitachi, IBM, General Electric, PTC, Emerson Electric, Bosch, Schneider Electric, Siemens, Rockwell Automation
    Segments Covered Technology, Deployment Type, Solution, End Use Industry, Regional
    Key Market Opportunities Remote asset monitoring solutions, Predictive maintenance technologies, Enhanced operational efficiency tools, Industry 4.0 integration services, IoT-enabled asset management platforms
    Key Market Dynamics Increasing IoT adoption, Enhanced operational efficiency, Growing need for predictive maintenance, Rising emphasis on data analytics, Demand for real-time monitoring
    Countries Covered North America, Europe, APAC, South America, MEA

    Market Highlights

    Author
    Aarti Dhapte
    Team Lead - Research

    She holds an experience of about 6+ years in Market Research and Business Consulting, working under the spectrum of Information Communication Technology, Telecommunications and Semiconductor domains. Aarti conceptualizes and implements a scalable business strategy and provides strategic leadership to the clients. Her expertise lies in market estimation, competitive intelligence, pipeline analysis, customer assessment, etc.

    Leave a Comment

    FAQs

    What is the expected market size of the Smart Connected Assets and Operations Market in 2034?

    The Smart Connected Assets and Operations Market is expected to be valued at 637.16 USD Billion in 2034.

    What is the compound annual growth rate (CAGR) for the Smart Connected Assets and Operations Market from 2025 to 2034?

    The expected CAGR for the Smart Connected Assets and Operations Market from 2025 to 2034 is 8.41%.

    Which region is projected to have the largest market share in 2032?

    North America is projected to have the largest market share, valued at 205.0 USD Billion in 2032.

    What is the market valuation for the Internet of Things technology segment in 2032?

    The Internet of Things technology segment is expected to be valued at 170.0 USD Billion in 2032.

    Who are the key players in the Smart Connected Assets and Operations Market?

    Major players in the market include Oracle, Cisco Systems, SAP, Microsoft, and IBM.

    What is the expected market size for the Artificial Intelligence segment in 2032?

    The Artificial Intelligence segment is expected to be valued at 120.0 USD Billion in 2032.

    How much is the Blockchain technology segment expected to grow by 2032?

    The Blockchain technology segment is projected to reach a valuation of 56.0 USD Billion in 2032.

    What is the growth forecast for the Big Data Analytics technology segment by 2032?

    The Big Data Analytics segment is expected to grow to a valuation of 154.0 USD Billion by 2032.

    What is the expected market size for the Asia-Pacific region in 2032?

    The Asia-Pacific region is anticipated to reach a market size of 120.0 USD Billion in 2032.

    What are the market dynamics driving growth in the Smart Connected Assets and Operations Market?

    Key growth drivers include technological advancements, increasing demand for automation, and the integration of IoT solutions.

    1. 'Table of Contents
    2. EXECUTIVE SUMMARY
      1. Market Overview
      2. Key Findings
      3. Market Segmentation
      4. Competitive Landscape
      5. Challenges and Opportunities
      6. Future Outlook
    3. MARKET INTRODUCTION
      1. Definition
      2. Scope of the study
        1. Research
    4. Objective
      1. Assumption
        1. Limitations
    5. RESEARCH METHODOLOGY
      1. Overview
      2. Data Mining
      3. Secondary Research
      4. Primary
    6. Research
      1. Primary Interviews and Information Gathering Process
    7. Breakdown of Primary Respondents
      1. Forecasting Model
      2. Market Size
    8. Estimation
      1. Bottom-Up Approach
        1. Top-Down Approach
    9. Data Triangulation
      1. Validation
    10. MARKET DYNAMICS
    11. Overview
      1. Drivers
      2. Restraints
      3. Opportunities
    12. MARKET FACTOR ANALYSIS
      1. Value chain Analysis
      2. Porter''s Five Forces
    13. Analysis
      1. Bargaining Power of Suppliers
        1. Bargaining Power
    14. of Buyers
      1. Threat of New Entrants
        1. Threat of Substitutes
        2. Intensity of Rivalry
      2. COVID-19 Impact Analysis
        1. Market
    15. Impact Analysis
      1. Regional Impact
        1. Opportunity and Threat Analysis
    16. Smart Connected Assets and Operations Market, BY Technology (USD Billion)
      1. Internet of Things
      2. Artificial Intelligence
      3. Blockchain
      4. Big Data Analytics
    17. Smart Connected Assets and Operations Market,
    18. BY Deployment Type (USD Billion)
      1. On-Premises
      2. Cloud-Based
      3. Hybrid
    19. Smart Connected Assets and Operations Market, BY Solution
    20. (USD Billion)
      1. Asset Management
      2. Operations Management
    21. Field Service Management
      1. Supply Chain Management
    22. Smart Connected
    23. Assets and Operations Market, BY End Use Industry (USD Billion)
      1. Manufacturing
      2. Healthcare
      3. Transportation and Logistics
      4. Energy and Utilities
    24. Smart Connected Assets and Operations Market, BY Regional (USD Billion)
      1. North America
        1. US
        2. Canada
      2. Europe
    25. Germany
      1. UK
        1. France
        2. Russia
        3. Italy
        4. Spain
        5. Rest of Europe
      2. APAC
        1. China
        2. India
        3. Japan
        4. South Korea
        5. Malaysia
        6. Thailand
        7. Indonesia
        8. Rest of APAC
      3. South
    26. America
      1. Brazil
        1. Mexico
        2. Argentina
    27. Rest of South America
      1. MEA
        1. GCC Countries
        2. South
    28. Africa
      1. Rest of MEA
    29. Competitive Landscape
    30. Overview
      1. Competitive Analysis
      2. Market share Analysis
    31. Major Growth Strategy in the Smart Connected Assets and Operations Market
    32. Competitive Benchmarking
      1. Leading Players in Terms of Number of Developments
    33. in the Smart Connected Assets and Operations Market
      1. Key developments
    34. and growth strategies
      1. New Product Launch/Service Deployment
    35. Merger & Acquisitions
      1. Joint Ventures
      2. Major Players Financial
    36. Matrix
      1. Sales and Operating Income
        1. Major Players R&D
    37. Expenditure. 2023
    38. Company Profiles
      1. Oracle
        1. Financial
    39. Overview
      1. Products Offered
        1. Key Developments
    40. SWOT Analysis
      1. Key Strategies
      2. Cisco Systems
    41. Financial Overview
      1. Products Offered
        1. Key Developments
        2. SWOT Analysis
        3. Key Strategies
      2. Abbott Laboratories
        1. Financial Overview
        2. Products Offered
        3. Key Developments
        4. SWOT Analysis
        5. Key Strategies
      3. SAP
    42. Financial Overview
      1. Products Offered
        1. Key Developments
        2. SWOT Analysis
        3. Key Strategies
      2. Honeywell
    43. Financial Overview
      1. Products Offered
        1. Key Developments
        2. SWOT Analysis
        3. Key Strategies
      2. Microsoft
    44. Financial Overview
      1. Products Offered
        1. Key Developments
        2. SWOT Analysis
        3. Key Strategies
      2. Hitachi
    45. Financial Overview
      1. Products Offered
        1. Key Developments
        2. SWOT Analysis
        3. Key Strategies
      2. IBM
    46. Financial Overview
      1. Products Offered
        1. Key Developments
        2. SWOT Analysis
        3. Key Strategies
      2. General Electric
        1. Financial Overview
        2. Products Offered
        3. Key Developments
        4. SWOT Analysis
        5. Key Strategies
      3. PTC
    47. Financial Overview
      1. Products Offered
        1. Key Developments
        2. SWOT Analysis
        3. Key Strategies
      2. Emerson Electric
        1. Financial Overview
        2. Products Offered
        3. Key Developments
        4. SWOT Analysis
        5. Key Strategies
      3. Bosch
    48. Financial Overview
      1. Products Offered
        1. Key Developments
        2. SWOT Analysis
        3. Key Strategies
      2. Schneider Electric
        1. Financial Overview
        2. Products Offered
        3. Key Developments
        4. SWOT Analysis
        5. Key Strategies
      3. Siemens
    49. Financial Overview
      1. Products Offered
        1. Key Developments
        2. SWOT Analysis
        3. Key Strategies
      2. Rockwell Automation
        1. Financial Overview
        2. Products Offered
        3. Key Developments
        4. SWOT Analysis
        5. Key Strategies
    50. Appendix
    51. References
      1. Related Reports
    52. OF ASSUMPTIONS
    53. Market SIZE ESTIMATES & FORECAST, BY TECHNOLOGY, 2020-2034 (USD Billions)
    54. & FORECAST, BY DEPLOYMENT TYPE, 2020-2034 (USD Billions)
    55. America Smart Connected Assets and Operations Market SIZE ESTIMATES & FORECAST,
    56. BY SOLUTION, 2020-2034 (USD Billions)
    57. Assets and Operations Market SIZE ESTIMATES & FORECAST, BY END USE INDUSTRY,
    58. 2034 (USD Billions)
    59. Operations Market SIZE ESTIMATES & FORECAST, BY REGIONAL, 2020-2034 (USD Billions)
    60. FORECAST, BY TECHNOLOGY, 2020-2034 (USD Billions)
    61. Assets and Operations Market SIZE ESTIMATES & FORECAST, BY DEPLOYMENT TYPE,
    62. 2034 (USD Billions)
    63. Market SIZE ESTIMATES & FORECAST, BY SOLUTION, 2020-2034 (USD Billions)
    64. US Smart Connected Assets and Operations Market SIZE ESTIMATES & FORECAST,
    65. BY END USE INDUSTRY, 2020-2034 (USD Billions)
    66. Assets and Operations Market SIZE ESTIMATES & FORECAST, BY REGIONAL, 2020-2034
    67. (USD Billions)
    68. SIZE ESTIMATES & FORECAST, BY TECHNOLOGY, 2020-2034 (USD Billions)
    69. Canada Smart Connected Assets and Operations Market SIZE ESTIMATES & FORECAST,
    70. BY DEPLOYMENT TYPE, 2020-2034 (USD Billions)
    71. Assets and Operations Market SIZE ESTIMATES & FORECAST, BY SOLUTION, 2020-2034
    72. (USD Billions)
    73. SIZE ESTIMATES & FORECAST, BY END USE INDUSTRY, 2020-2034 (USD Billions)
    74. FORECAST, BY REGIONAL, 2020-2034 (USD Billions)
    75. Assets and Operations Market SIZE ESTIMATES & FORECAST, BY TECHNOLOGY, 2020-2034
    76. (USD Billions)
    77. SIZE ESTIMATES & FORECAST, BY DEPLOYMENT TYPE, 2020-2034 (USD Billions)
    78. Europe Smart Connected Assets and Operations Market SIZE ESTIMATES & FORECAST,
    79. BY SOLUTION, 2020-2034 (USD Billions)
    80. and Operations Market SIZE ESTIMATES & FORECAST, BY END USE INDUSTRY, 2020-2034
    81. (USD Billions)
    82. SIZE ESTIMATES & FORECAST, BY REGIONAL, 2020-2034 (USD Billions)
    83. Germany Smart Connected Assets and Operations Market SIZE ESTIMATES & FORECAST,
    84. BY TECHNOLOGY, 2020-2034 (USD Billions)
    85. and Operations Market SIZE ESTIMATES & FORECAST, BY DEPLOYMENT TYPE, 2020-2034
    86. (USD Billions)
    87. SIZE ESTIMATES & FORECAST, BY SOLUTION, 2020-2034 (USD Billions)
    88. Germany Smart Connected Assets and Operations Market SIZE ESTIMATES & FORECAST,
    89. BY END USE INDUSTRY, 2020-2034 (USD Billions)
    90. Assets and Operations Market SIZE ESTIMATES & FORECAST, BY REGIONAL, 2020-2034
    91. (USD Billions)
    92. ESTIMATES & FORECAST, BY TECHNOLOGY, 2020-2034 (USD Billions)
    93. UK Smart Connected Assets and Operations Market SIZE ESTIMATES & FORECAST, BY
    94. DEPLOYMENT TYPE, 2020-2034 (USD Billions)
    95. and Operations Market SIZE ESTIMATES & FORECAST, BY SOLUTION, 2020-2034 (USD
    96. Billions)
    97. & FORECAST, BY END USE INDUSTRY, 2020-2034 (USD Billions)
    98. Smart Connected Assets and Operations Market SIZE ESTIMATES & FORECAST, BY REGIONAL,
    99. 2034 (USD Billions)
    100. Market SIZE ESTIMATES & FORECAST, BY TECHNOLOGY, 2020-2034 (USD Billions)
    101. FORECAST, BY DEPLOYMENT TYPE, 2020-2034 (USD Billions)
    102. Connected Assets and Operations Market SIZE ESTIMATES & FORECAST, BY SOLUTION,
    103. 2034 (USD Billions)
    104. Market SIZE ESTIMATES & FORECAST, BY END USE INDUSTRY, 2020-2034 (USD Billions)
    105. FORECAST, BY REGIONAL, 2020-2034 (USD Billions)
    106. Assets and Operations Market SIZE ESTIMATES & FORECAST, BY TECHNOLOGY, 2020-2034
    107. (USD Billions)
    108. SIZE ESTIMATES & FORECAST, BY DEPLOYMENT TYPE, 2020-2034 (USD Billions)
    109. Russia Smart Connected Assets and Operations Market SIZE ESTIMATES & FORECAST,
    110. BY SOLUTION, 2020-2034 (USD Billions)
    111. and Operations Market SIZE ESTIMATES & FORECAST, BY END USE INDUSTRY, 2020-2034
    112. (USD Billions)
    113. SIZE ESTIMATES & FORECAST, BY REGIONAL, 2020-2034 (USD Billions)
    114. Italy Smart Connected Assets and Operations Market SIZE ESTIMATES & FORECAST,
    115. BY TECHNOLOGY, 2020-2034 (USD Billions)
    116. and Operations Market SIZE ESTIMATES & FORECAST, BY DEPLOYMENT TYPE, 2020-2034
    117. (USD Billions)
    118. SIZE ESTIMATES & FORECAST, BY SOLUTION, 2020-2034 (USD Billions)
    119. Italy Smart Connected Assets and Operations Market SIZE ESTIMATES & FORECAST,
    120. BY END USE INDUSTRY, 2020-2034 (USD Billions)
    121. Assets and Operations Market SIZE ESTIMATES & FORECAST, BY REGIONAL, 2020-2034
    122. (USD Billions)
    123. SIZE ESTIMATES & FORECAST, BY TECHNOLOGY, 2020-2034 (USD Billions)
    124. Spain Smart Connected Assets and Operations Market SIZE ESTIMATES & FORECAST,
    125. BY DEPLOYMENT TYPE, 2020-2034 (USD Billions)
    126. Assets and Operations Market SIZE ESTIMATES & FORECAST, BY SOLUTION, 2020-2034
    127. (USD Billions)
    128. SIZE ESTIMATES & FORECAST, BY END USE INDUSTRY, 2020-2034 (USD Billions)
    129. FORECAST, BY REGIONAL, 2020-2034 (USD Billions)
    130. Connected Assets and Operations Market SIZE ESTIMATES & FORECAST, BY TECHNOLOGY,
    131. 2034 (USD Billions)
    132. Operations Market SIZE ESTIMATES & FORECAST, BY DEPLOYMENT TYPE, 2020-2034 (USD
    133. Billions)
    134. SIZE ESTIMATES & FORECAST, BY SOLUTION, 2020-2034 (USD Billions)
    135. Rest of Europe Smart Connected Assets and Operations Market SIZE ESTIMATES &
    136. FORECAST, BY END USE INDUSTRY, 2020-2034 (USD Billions)
    137. Smart Connected Assets and Operations Market SIZE ESTIMATES & FORECAST, BY REGIONAL,
    138. 2034 (USD Billions)
    139. Market SIZE ESTIMATES & FORECAST, BY TECHNOLOGY, 2020-2034 (USD Billions)
    140. FORECAST, BY DEPLOYMENT TYPE, 2020-2034 (USD Billions)
    141. Connected Assets and Operations Market SIZE ESTIMATES & FORECAST, BY SOLUTION,
    142. 2034 (USD Billions)
    143. Market SIZE ESTIMATES & FORECAST, BY END USE INDUSTRY, 2020-2034 (USD Billions)
    144. FORECAST, BY REGIONAL, 2020-2034 (USD Billions)
    145. Assets and Operations Market SIZE ESTIMATES & FORECAST, BY TECHNOLOGY, 2020-2034
    146. (USD Billions)
    147. SIZE ESTIMATES & FORECAST, BY DEPLOYMENT TYPE, 2020-2034 (USD Billions)
    148. China Smart Connected Assets and Operations Market SIZE ESTIMATES & FORECAST,
    149. BY SOLUTION, 2020-2034 (USD Billions)
    150. and Operations Market SIZE ESTIMATES & FORECAST, BY END USE INDUSTRY, 2020-2034
    151. (USD Billions)
    152. SIZE ESTIMATES & FORECAST, BY REGIONAL, 2020-2034 (USD Billions)
    153. India Smart Connected Assets and Operations Market SIZE ESTIMATES & FORECAST,
    154. BY TECHNOLOGY, 2020-2034 (USD Billions)
    155. and Operations Market SIZE ESTIMATES & FORECAST, BY DEPLOYMENT TYPE, 2020-2034
    156. (USD Billions)
    157. SIZE ESTIMATES & FORECAST, BY SOLUTION, 2020-2034 (USD Billions)
    158. India Smart Connected Assets and Operations Market SIZE ESTIMATES & FORECAST,
    159. BY END USE INDUSTRY, 2020-2034 (USD Billions)
    160. Assets and Operations Market SIZE ESTIMATES & FORECAST, BY REGIONAL, 2020-2034
    161. (USD Billions)
    162. SIZE ESTIMATES & FORECAST, BY TECHNOLOGY, 2020-2034 (USD Billions)
    163. Japan Smart Connected Assets and Operations Market SIZE ESTIMATES & FORECAST,
    164. BY DEPLOYMENT TYPE, 2020-2034 (USD Billions)
    165. Assets and Operations Market SIZE ESTIMATES & FORECAST, BY SOLUTION, 2020-2034
    166. (USD Billions)
    167. SIZE ESTIMATES & FORECAST, BY END USE INDUSTRY, 2020-2034 (USD Billions)
    168. FORECAST, BY REGIONAL, 2020-2034 (USD Billions)
    169. Connected Assets and Operations Market SIZE ESTIMATES & FORECAST, BY TECHNOLOGY,
    170. 2034 (USD Billions)
    171. Market SIZE ESTIMATES & FORECAST, BY DEPLOYMENT TYPE, 2020-2034 (USD Billions)
    172. & FORECAST, BY SOLUTION, 2020-2034 (USD Billions)
    173. Smart Connected Assets and Operations Market SIZE ESTIMATES & FORECAST, BY END
    174. USE INDUSTRY, 2020-2034 (USD Billions)
    175. Assets and Operations Market SIZE ESTIMATES & FORECAST, BY REGIONAL, 2020-2034
    176. (USD Billions)
    177. SIZE ESTIMATES & FORECAST, BY TECHNOLOGY, 2020-2034 (USD Billions)
    178. Malaysia Smart Connected Assets and Operations Market SIZE ESTIMATES & FORECAST,
    179. BY DEPLOYMENT TYPE, 2020-2034 (USD Billions)
    180. Assets and Operations Market SIZE ESTIMATES & FORECAST, BY SOLUTION, 2020-2034
    181. (USD Billions)
    182. SIZE ESTIMATES & FORECAST, BY END USE INDUSTRY, 2020-2034 (USD Billions)
    183. & FORECAST, BY REGIONAL, 2020-2034 (USD Billions)
    184. Connected Assets and Operations Market SIZE ESTIMATES & FORECAST, BY TECHNOLOGY,
    185. 2034 (USD Billions)
    186. Market SIZE ESTIMATES & FORECAST, BY DEPLOYMENT TYPE, 2020-2034 (USD Billions)
    187. & FORECAST, BY SOLUTION, 2020-2034 (USD Billions)
    188. Connected Assets and Operations Market SIZE ESTIMATES & FORECAST, BY END USE
    189. INDUSTRY, 2020-2034 (USD Billions)
    190. and Operations Market SIZE ESTIMATES & FORECAST, BY REGIONAL, 2020-2034 (USD
    191. Billions)
    192. SIZE ESTIMATES & FORECAST, BY TECHNOLOGY, 2020-2034 (USD Billions)
    193. Indonesia Smart Connected Assets and Operations Market SIZE ESTIMATES &
    194. FORECAST, BY DEPLOYMENT TYPE, 2020-2034 (USD Billions)
    195. Smart Connected Assets and Operations Market SIZE ESTIMATES & FORECAST, BY SOLUTION,
    196. 2034 (USD Billions)
    197. Market SIZE ESTIMATES & FORECAST, BY END USE INDUSTRY, 2020-2034 (USD Billions)
    198. & FORECAST, BY REGIONAL, 2020-2034 (USD Billions)
    199. Smart Connected Assets and Operations Market SIZE ESTIMATES & FORECAST, BY TECHNOLOGY,
    200. 2034 (USD Billions)
    201. Operations Market SIZE ESTIMATES & FORECAST, BY DEPLOYMENT TYPE, 2020-2034 (USD
    202. Billions)
    203. SIZE ESTIMATES & FORECAST, BY SOLUTION, 2020-2034 (USD Billions)
    204. Rest of APAC Smart Connected Assets and Operations Market SIZE ESTIMATES &
    205. FORECAST, BY END USE INDUSTRY, 2020-2034 (USD Billions)
    206. APAC Smart Connected Assets and Operations Market SIZE ESTIMATES & FORECAST,
    207. BY REGIONAL, 2020-2034 (USD Billions)
    208. Assets and Operations Market SIZE ESTIMATES & FORECAST, BY TECHNOLOGY, 2020-2034
    209. (USD Billions)
    210. Market SIZE ESTIMATES & FORECAST, BY DEPLOYMENT TYPE, 2020-2034 (USD Billions)
    211. & FORECAST, BY SOLUTION, 2020-2034 (USD Billions)
    212. Smart Connected Assets and Operations Market SIZE ESTIMATES & FORECAST, BY END
    213. USE INDUSTRY, 2020-2034 (USD Billions)
    214. Assets and Operations Market SIZE ESTIMATES & FORECAST, BY REGIONAL, 2020-2034
    215. (USD Billions)
    216. SIZE ESTIMATES & FORECAST, BY TECHNOLOGY, 2020-2034 (USD Billions)
    217. Brazil Smart Connected Assets and Operations Market SIZE ESTIMATES & FORECAST,
    218. BY DEPLOYMENT TYPE, 2020-2034 (USD Billions)
    219. Assets and Operations Market SIZE ESTIMATES & FORECAST, BY SOLUTION, 2020-2034
    220. (USD Billions)
    221. SIZE ESTIMATES & FORECAST, BY END USE INDUSTRY, 2020-2034 (USD Billions)
    222. & FORECAST, BY REGIONAL, 2020-2034 (USD Billions)
    223. Connected Assets and Operations Market SIZE ESTIMATES & FORECAST, BY TECHNOLOGY,
    224. 2034 (USD Billions)
    225. Market SIZE ESTIMATES & FORECAST, BY DEPLOYMENT TYPE, 2020-2034 (USD Billions)
    226. & FORECAST, BY SOLUTION, 2020-2034 (USD Billions)
    227. Connected Assets and Operations Market SIZE ESTIMATES & FORECAST, BY END USE
    228. INDUSTRY, 2020-2034 (USD Billions)
    229. and Operations Market SIZE ESTIMATES & FORECAST, BY REGIONAL, 2020-2034 (USD
    230. Billions)
    231. SIZE ESTIMATES & FORECAST, BY TECHNOLOGY, 2020-2034 (USD Billions)
    232. Argentina Smart Connected Assets and Operations Market SIZE ESTIMATES &
    233. FORECAST, BY DEPLOYMENT TYPE, 2020-2034 (USD Billions)
    234. Smart Connected Assets and Operations Market SIZE ESTIMATES & FORECAST, BY SOLUTION,
    235. 2034 (USD Billions)
    236. Market SIZE ESTIMATES & FORECAST, BY END USE INDUSTRY, 2020-2034 (USD Billions)
    237. & FORECAST, BY REGIONAL, 2020-2034 (USD Billions)
    238. America Smart Connected Assets and Operations Market SIZE ESTIMATES & FORECAST,
    239. BY TECHNOLOGY, 2020-2034 (USD Billions)
    240. Connected Assets and Operations Market SIZE ESTIMATES & FORECAST, BY DEPLOYMENT
    241. TYPE, 2020-2034 (USD Billions)
    242. Assets and Operations Market SIZE ESTIMATES & FORECAST, BY SOLUTION, 2020-2034
    243. (USD Billions)
    244. Operations Market SIZE ESTIMATES & FORECAST, BY END USE INDUSTRY, 2020-2034
    245. (USD Billions)
    246. Operations Market SIZE ESTIMATES & FORECAST, BY REGIONAL, 2020-2034 (USD Billions)
    247. FORECAST, BY TECHNOLOGY, 2020-2034 (USD Billions)
    248. Assets and Operations Market SIZE ESTIMATES & FORECAST, BY DEPLOYMENT TYPE,
    249. 2034 (USD Billions)
    250. Market SIZE ESTIMATES & FORECAST, BY SOLUTION, 2020-2034 (USD Billions)
    251. MEA Smart Connected Assets and Operations Market SIZE ESTIMATES & FORECAST,
    252. BY END USE INDUSTRY, 2020-2034 (USD Billions)
    253. Assets and Operations Market SIZE ESTIMATES & FORECAST, BY REGIONAL, 2020-2034
    254. (USD Billions)
    255. Market SIZE ESTIMATES & FORECAST, BY TECHNOLOGY, 2020-2034 (USD Billions)
    256. & FORECAST, BY DEPLOYMENT TYPE, 2020-2034 (USD Billions)
    257. Countries Smart Connected Assets and Operations Market SIZE ESTIMATES & FORECAST,
    258. BY SOLUTION, 2020-2034 (USD Billions)
    259. Assets and Operations Market SIZE ESTIMATES & FORECAST, BY END USE INDUSTRY,
    260. 2034 (USD Billions)
    261. Operations Market SIZE ESTIMATES & FORECAST, BY REGIONAL, 2020-2034 (USD Billions)
    262. & FORECAST, BY TECHNOLOGY, 2020-2034 (USD Billions)
    263. Smart Connected Assets and Operations Market SIZE ESTIMATES & FORECAST, BY DEPLOYMENT
    264. TYPE, 2020-2034 (USD Billions)
    265. and Operations Market SIZE ESTIMATES & FORECAST, BY SOLUTION, 2020-2034 (USD
    266. Billions)
    267. SIZE ESTIMATES & FORECAST, BY END USE INDUSTRY, 2020-2034 (USD Billions)
    268. & FORECAST, BY REGIONAL, 2020-2034 (USD Billions)
    269. Smart Connected Assets and Operations Market SIZE ESTIMATES & FORECAST, BY TECHNOLOGY,
    270. 2034 (USD Billions)
    271. Operations Market SIZE ESTIMATES & FORECAST, BY DEPLOYMENT TYPE, 2020-2034 (USD
    272. Billions)
    273. SIZE ESTIMATES & FORECAST, BY SOLUTION, 2020-2034 (USD Billions)
    274. Rest of MEA Smart Connected Assets and Operations Market SIZE ESTIMATES &
    275. FORECAST, BY END USE INDUSTRY, 2020-2034 (USD Billions)
    276. MEA Smart Connected Assets and Operations Market SIZE ESTIMATES & FORECAST,
    277. BY REGIONAL, 2020-2034 (USD Billions)
    278. MARKET SYNOPSIS
    279. MARKET ANALYSIS
    280. BY TECHNOLOGY
    281. BY DEPLOYMENT TYPE
    282. ANALYSIS BY SOLUTION
    283. ANALYSIS BY END USE INDUSTRY
    284. MARKET ANALYSIS BY REGIONAL
    285. MARKET ANALYSIS BY TECHNOLOGY
    286. MARKET ANALYSIS BY DEPLOYMENT TYPE
    287. AND OPERATIONS MARKET ANALYSIS BY SOLUTION
    288. ASSETS AND OPERATIONS MARKET ANALYSIS BY END USE INDUSTRY
    289. SMART CONNECTED ASSETS AND OPERATIONS MARKET ANALYSIS BY REGIONAL
    290. EUROPE SMART CONNECTED ASSETS AND OPERATIONS MARKET ANALYSIS
    291. SMART CONNECTED ASSETS AND OPERATIONS MARKET ANALYSIS BY TECHNOLOGY
    292. GERMANY SMART CONNECTED ASSETS AND OPERATIONS MARKET ANALYSIS BY DEPLOYMENT
    293. TYPE
    294. BY SOLUTION
    295. ANALYSIS BY END USE INDUSTRY
    296. OPERATIONS MARKET ANALYSIS BY REGIONAL
    297. AND OPERATIONS MARKET ANALYSIS BY TECHNOLOGY
    298. ASSETS AND OPERATIONS MARKET ANALYSIS BY DEPLOYMENT TYPE
    299. CONNECTED ASSETS AND OPERATIONS MARKET ANALYSIS BY SOLUTION
    300. CONNECTED ASSETS AND OPERATIONS MARKET ANALYSIS BY END USE INDUSTRY
    301. UK SMART CONNECTED ASSETS AND OPERATIONS MARKET ANALYSIS BY REGIONAL
    302. FRANCE SMART CONNECTED ASSETS AND OPERATIONS MARKET ANALYSIS BY TECHNOLOGY
    303. TYPE
    304. BY SOLUTION
    305. ANALYSIS BY END USE INDUSTRY
    306. MARKET ANALYSIS BY REGIONAL
    307. MARKET ANALYSIS BY TECHNOLOGY
    308. OPERATIONS MARKET ANALYSIS BY DEPLOYMENT TYPE
    309. ASSETS AND OPERATIONS MARKET ANALYSIS BY SOLUTION
    310. ASSETS AND OPERATIONS MARKET ANALYSIS BY END USE INDUSTRY
    311. SMART CONNECTED ASSETS AND OPERATIONS MARKET ANALYSIS BY REGIONAL
    312. ITALY SMART CONNECTED ASSETS AND OPERATIONS MARKET ANALYSIS BY TECHNOLOGY
    313. ITALY SMART CONNECTED ASSETS AND OPERATIONS MARKET ANALYSIS BY DEPLOYMENT TYPE
    314. USE INDUSTRY
    315. ANALYSIS BY REGIONAL
    316. MARKET ANALYSIS BY TECHNOLOGY
    317. MARKET ANALYSIS BY DEPLOYMENT TYPE
    318. AND OPERATIONS MARKET ANALYSIS BY SOLUTION
    319. ASSETS AND OPERATIONS MARKET ANALYSIS BY END USE INDUSTRY
    320. SMART CONNECTED ASSETS AND OPERATIONS MARKET ANALYSIS BY REGIONAL
    321. REST OF EUROPE SMART CONNECTED ASSETS AND OPERATIONS MARKET ANALYSIS BY TECHNOLOGY
    322. BY DEPLOYMENT TYPE
    323. MARKET ANALYSIS BY SOLUTION
    324. AND OPERATIONS MARKET ANALYSIS BY END USE INDUSTRY
    325. SMART CONNECTED ASSETS AND OPERATIONS MARKET ANALYSIS BY REGIONAL
    326. APAC SMART CONNECTED ASSETS AND OPERATIONS MARKET ANALYSIS
    327. SMART CONNECTED ASSETS AND OPERATIONS MARKET ANALYSIS BY TECHNOLOGY
    328. CHINA SMART CONNECTED ASSETS AND OPERATIONS MARKET ANALYSIS BY DEPLOYMENT TYPE
    329. USE INDUSTRY
    330. ANALYSIS BY REGIONAL
    331. MARKET ANALYSIS BY TECHNOLOGY
    332. MARKET ANALYSIS BY DEPLOYMENT TYPE
    333. AND OPERATIONS MARKET ANALYSIS BY SOLUTION
    334. ASSETS AND OPERATIONS MARKET ANALYSIS BY END USE INDUSTRY
    335. SMART CONNECTED ASSETS AND OPERATIONS MARKET ANALYSIS BY REGIONAL
    336. JAPAN SMART CONNECTED ASSETS AND OPERATIONS MARKET ANALYSIS BY TECHNOLOGY
    337. JAPAN SMART CONNECTED ASSETS AND OPERATIONS MARKET ANALYSIS BY DEPLOYMENT TYPE
    338. USE INDUSTRY
    339. ANALYSIS BY REGIONAL
    340. MARKET ANALYSIS BY TECHNOLOGY
    341. AND OPERATIONS MARKET ANALYSIS BY DEPLOYMENT TYPE
    342. CONNECTED ASSETS AND OPERATIONS MARKET ANALYSIS BY SOLUTION
    343. KOREA SMART CONNECTED ASSETS AND OPERATIONS MARKET ANALYSIS BY END USE INDUSTRY
    344. REGIONAL
    345. BY TECHNOLOGY
    346. ANALYSIS BY DEPLOYMENT TYPE
    347. OPERATIONS MARKET ANALYSIS BY SOLUTION
    348. ASSETS AND OPERATIONS MARKET ANALYSIS BY END USE INDUSTRY
    349. SMART CONNECTED ASSETS AND OPERATIONS MARKET ANALYSIS BY REGIONAL
    350. THAILAND SMART CONNECTED ASSETS AND OPERATIONS MARKET ANALYSIS BY TECHNOLOGY
    351. TYPE
    352. BY SOLUTION
    353. ANALYSIS BY END USE INDUSTRY
    354. OPERATIONS MARKET ANALYSIS BY REGIONAL
    355. ASSETS AND OPERATIONS MARKET ANALYSIS BY TECHNOLOGY
    356. CONNECTED ASSETS AND OPERATIONS MARKET ANALYSIS BY DEPLOYMENT TYPE
    357. INDONESIA SMART CONNECTED ASSETS AND OPERATIONS MARKET ANALYSIS BY SOLUTION
    358. INDONESIA SMART CONNECTED ASSETS AND OPERATIONS MARKET ANALYSIS BY END USE INDUSTRY
    359. REGIONAL
    360. ANALYSIS BY TECHNOLOGY
    361. MARKET ANALYSIS BY DEPLOYMENT TYPE
    362. ASSETS AND OPERATIONS MARKET ANALYSIS BY SOLUTION
    363. CONNECTED ASSETS AND OPERATIONS MARKET ANALYSIS BY END USE INDUSTRY
    364. REST OF APAC SMART CONNECTED ASSETS AND OPERATIONS MARKET ANALYSIS BY REGIONAL
    365. TYPE
    366. BY SOLUTION
    367. ANALYSIS BY END USE INDUSTRY
    368. MARKET ANALYSIS BY REGIONAL
    369. MARKET ANALYSIS BY TECHNOLOGY
    370. OPERATIONS MARKET ANALYSIS BY DEPLOYMENT TYPE
    371. ASSETS AND OPERATIONS MARKET ANALYSIS BY SOLUTION
    372. ASSETS AND OPERATIONS MARKET ANALYSIS BY END USE INDUSTRY
    373. SMART CONNECTED ASSETS AND OPERATIONS MARKET ANALYSIS BY REGIONAL
    374. ARGENTINA SMART CONNECTED ASSETS AND OPERATIONS MARKET ANALYSIS BY TECHNOLOGY
    375. DEPLOYMENT TYPE
    376. MARKET ANALYSIS BY SOLUTION
    377. OPERATIONS MARKET ANALYSIS BY END USE INDUSTRY
    378. CONNECTED ASSETS AND OPERATIONS MARKET ANALYSIS BY REGIONAL
    379. OF SOUTH AMERICA SMART CONNECTED ASSETS AND OPERATIONS MARKET ANALYSIS BY TECHNOLOGY
    380. ANALYSIS BY DEPLOYMENT TYPE
    381. ASSETS AND OPERATIONS MARKET ANALYSIS BY SOLUTION
    382. AMERICA SMART CONNECTED ASSETS AND OPERATIONS MARKET ANALYSIS BY END USE INDUSTRY
    383. ANALYSIS BY REGIONAL
    384. MARKET ANALYSIS
    385. MARKET ANALYSIS BY TECHNOLOGY
    386. AND OPERATIONS MARKET ANALYSIS BY DEPLOYMENT TYPE
    387. SMART CONNECTED ASSETS AND OPERATIONS MARKET ANALYSIS BY SOLUTION
    388. GCC COUNTRIES SMART CONNECTED ASSETS AND OPERATIONS MARKET ANALYSIS BY END USE INDUSTRY
    389. BY REGIONAL
    390. MARKET ANALYSIS BY TECHNOLOGY
    391. AND OPERATIONS MARKET ANALYSIS BY DEPLOYMENT TYPE
    392. SMART CONNECTED ASSETS AND OPERATIONS MARKET ANALYSIS BY SOLUTION
    393. SOUTH AFRICA SMART CONNECTED ASSETS AND OPERATIONS MARKET ANALYSIS BY END USE INDUSTRY
    394. BY REGIONAL
    395. ANALYSIS BY TECHNOLOGY
    396. MARKET ANALYSIS BY DEPLOYMENT TYPE
    397. ASSETS AND OPERATIONS MARKET ANALYSIS BY SOLUTION
    398. CONNECTED ASSETS AND OPERATIONS MARKET ANALYSIS BY END USE INDUSTRY
    399. REST OF MEA SMART CONNECTED ASSETS AND OPERATIONS MARKET ANALYSIS BY REGIONAL
    400. ASSETS AND OPERATIONS MARKET
    401. ASSETS AND OPERATIONS MARKET
    402. CONNECTED ASSETS AND OPERATIONS MARKET
    403. CONNECTED ASSETS AND OPERATIONS MARKET
    404. OPERATIONS MARKET, BY TECHNOLOGY, 2024 (% SHARE)
    405. ASSETS AND OPERATIONS MARKET, BY TECHNOLOGY, 2020 TO 2034 (USD Billions)
    406. SMART CONNECTED ASSETS AND OPERATIONS MARKET, BY DEPLOYMENT TYPE, 2024 (% SHARE)
    407. TO 2034 (USD Billions)
    408. MARKET, BY SOLUTION, 2024 (% SHARE)
    409. OPERATIONS MARKET, BY SOLUTION, 2020 TO 2034 (USD Billions)
    410. CONNECTED ASSETS AND OPERATIONS MARKET, BY END USE INDUSTRY, 2024 (% SHARE)
    411. SMART CONNECTED ASSETS AND OPERATIONS MARKET, BY END USE INDUSTRY, 2020 TO
    412. (USD Billions)
    413. BY REGIONAL, 2024 (% SHARE)
    414. MARKET, BY REGIONAL, 2020 TO 2034 (USD Billions)
    415. MAJOR COMPETITORS'

    Smart Connected Assets and Operations Market Segmentation

    • Smart Connected Assets and Operations Market By Technology (USD Billion, 2020-2034)
      • Internet of Things
      • Artificial Intelligence
      • Blockchain
      • Big Data Analytics
    • Smart Connected Assets and Operations Market By Deployment Type (USD Billion, 2020-2034)
      • On-Premises
      • Cloud-Based
      • Hybrid
    • Smart Connected Assets and Operations Market By Solution (USD Billion, 2020-2034)
      • Asset Management
      • Operations Management
      • Field Service Management
      • Supply Chain Management
    • Smart Connected Assets and Operations Market By End Use Industry (USD Billion, 2020-2034)
      • Manufacturing
      • Healthcare
      • Transportation and Logistics
      • Energy and Utilities
    • Smart Connected Assets and Operations Market By Regional (USD Billion, 2020-2034)
      • North America
      • Europe
      • South America
      • Asia Pacific
      • Middle East and Africa

    Smart Connected Assets and Operations Market Regional Outlook (USD Billion, 2020-2034)

    • North America Outlook (USD Billion, 2020-2034)
      • North America Smart Connected Assets and Operations Market by Technology Type
        • Internet of Things
        • Artificial Intelligence
        • Blockchain
        • Big Data Analytics
      • North America Smart Connected Assets and Operations Market by Deployment Type
        • On-Premises
        • Cloud-Based
        • Hybrid
      • North America Smart Connected Assets and Operations Market by Solution Type
        • Asset Management
        • Operations Management
        • Field Service Management
        • Supply Chain Management
      • North America Smart Connected Assets and Operations Market by End Use Industry Type
        • Manufacturing
        • Healthcare
        • Transportation and Logistics
        • Energy and Utilities
      • North America Smart Connected Assets and Operations Market by Regional Type
        • US
        • Canada
      • US Outlook (USD Billion, 2020-2034)
      • US Smart Connected Assets and Operations Market by Technology Type
        • Internet of Things
        • Artificial Intelligence
        • Blockchain
        • Big Data Analytics
      • US Smart Connected Assets and Operations Market by Deployment Type
        • On-Premises
        • Cloud-Based
        • Hybrid
      • US Smart Connected Assets and Operations Market by Solution Type
        • Asset Management
        • Operations Management
        • Field Service Management
        • Supply Chain Management
      • US Smart Connected Assets and Operations Market by End Use Industry Type
        • Manufacturing
        • Healthcare
        • Transportation and Logistics
        • Energy and Utilities
      • CANADA Outlook (USD Billion, 2020-2034)
      • CANADA Smart Connected Assets and Operations Market by Technology Type
        • Internet of Things
        • Artificial Intelligence
        • Blockchain
        • Big Data Analytics
      • CANADA Smart Connected Assets and Operations Market by Deployment Type
        • On-Premises
        • Cloud-Based
        • Hybrid
      • CANADA Smart Connected Assets and Operations Market by Solution Type
        • Asset Management
        • Operations Management
        • Field Service Management
        • Supply Chain Management
      • CANADA Smart Connected Assets and Operations Market by End Use Industry Type
        • Manufacturing
        • Healthcare
        • Transportation and Logistics
        • Energy and Utilities
    • Europe Outlook (USD Billion, 2020-2034)
      • Europe Smart Connected Assets and Operations Market by Technology Type
        • Internet of Things
        • Artificial Intelligence
        • Blockchain
        • Big Data Analytics
      • Europe Smart Connected Assets and Operations Market by Deployment Type
        • On-Premises
        • Cloud-Based
        • Hybrid
      • Europe Smart Connected Assets and Operations Market by Solution Type
        • Asset Management
        • Operations Management
        • Field Service Management
        • Supply Chain Management
      • Europe Smart Connected Assets and Operations Market by End Use Industry Type
        • Manufacturing
        • Healthcare
        • Transportation and Logistics
        • Energy and Utilities
      • Europe Smart Connected Assets and Operations Market by Regional Type
        • Germany
        • UK
        • France
        • Russia
        • Italy
        • Spain
        • Rest of Europe
      • GERMANY Outlook (USD Billion, 2020-2034)
      • GERMANY Smart Connected Assets and Operations Market by Technology Type
        • Internet of Things
        • Artificial Intelligence
        • Blockchain
        • Big Data Analytics
      • GERMANY Smart Connected Assets and Operations Market by Deployment Type
        • On-Premises
        • Cloud-Based
        • Hybrid
      • GERMANY Smart Connected Assets and Operations Market by Solution Type
        • Asset Management
        • Operations Management
        • Field Service Management
        • Supply Chain Management
      • GERMANY Smart Connected Assets and Operations Market by End Use Industry Type
        • Manufacturing
        • Healthcare
        • Transportation and Logistics
        • Energy and Utilities
      • UK Outlook (USD Billion, 2020-2034)
      • UK Smart Connected Assets and Operations Market by Technology Type
        • Internet of Things
        • Artificial Intelligence
        • Blockchain
        • Big Data Analytics
      • UK Smart Connected Assets and Operations Market by Deployment Type
        • On-Premises
        • Cloud-Based
        • Hybrid
      • UK Smart Connected Assets and Operations Market by Solution Type
        • Asset Management
        • Operations Management
        • Field Service Management
        • Supply Chain Management
      • UK Smart Connected Assets and Operations Market by End Use Industry Type
        • Manufacturing
        • Healthcare
        • Transportation and Logistics
        • Energy and Utilities
      • FRANCE Outlook (USD Billion, 2020-2034)
      • FRANCE Smart Connected Assets and Operations Market by Technology Type
        • Internet of Things
        • Artificial Intelligence
        • Blockchain
        • Big Data Analytics
      • FRANCE Smart Connected Assets and Operations Market by Deployment Type
        • On-Premises
        • Cloud-Based
        • Hybrid
      • FRANCE Smart Connected Assets and Operations Market by Solution Type
        • Asset Management
        • Operations Management
        • Field Service Management
        • Supply Chain Management
      • FRANCE Smart Connected Assets and Operations Market by End Use Industry Type
        • Manufacturing
        • Healthcare
        • Transportation and Logistics
        • Energy and Utilities
      • RUSSIA Outlook (USD Billion, 2020-2034)
      • RUSSIA Smart Connected Assets and Operations Market by Technology Type
        • Internet of Things
        • Artificial Intelligence
        • Blockchain
        • Big Data Analytics
      • RUSSIA Smart Connected Assets and Operations Market by Deployment Type
        • On-Premises
        • Cloud-Based
        • Hybrid
      • RUSSIA Smart Connected Assets and Operations Market by Solution Type
        • Asset Management
        • Operations Management
        • Field Service Management
        • Supply Chain Management
      • RUSSIA Smart Connected Assets and Operations Market by End Use Industry Type
        • Manufacturing
        • Healthcare
        • Transportation and Logistics
        • Energy and Utilities
      • ITALY Outlook (USD Billion, 2020-2034)
      • ITALY Smart Connected Assets and Operations Market by Technology Type
        • Internet of Things
        • Artificial Intelligence
        • Blockchain
        • Big Data Analytics
      • ITALY Smart Connected Assets and Operations Market by Deployment Type
        • On-Premises
        • Cloud-Based
        • Hybrid
      • ITALY Smart Connected Assets and Operations Market by Solution Type
        • Asset Management
        • Operations Management
        • Field Service Management
        • Supply Chain Management
      • ITALY Smart Connected Assets and Operations Market by End Use Industry Type
        • Manufacturing
        • Healthcare
        • Transportation and Logistics
        • Energy and Utilities
      • SPAIN Outlook (USD Billion, 2020-2034)
      • SPAIN Smart Connected Assets and Operations Market by Technology Type
        • Internet of Things
        • Artificial Intelligence
        • Blockchain
        • Big Data Analytics
      • SPAIN Smart Connected Assets and Operations Market by Deployment Type
        • On-Premises
        • Cloud-Based
        • Hybrid
      • SPAIN Smart Connected Assets and Operations Market by Solution Type
        • Asset Management
        • Operations Management
        • Field Service Management
        • Supply Chain Management
      • SPAIN Smart Connected Assets and Operations Market by End Use Industry Type
        • Manufacturing
        • Healthcare
        • Transportation and Logistics
        • Energy and Utilities
      • REST OF EUROPE Outlook (USD Billion, 2020-2034)
      • REST OF EUROPE Smart Connected Assets and Operations Market by Technology Type
        • Internet of Things
        • Artificial Intelligence
        • Blockchain
        • Big Data Analytics
      • REST OF EUROPE Smart Connected Assets and Operations Market by Deployment Type
        • On-Premises
        • Cloud-Based
        • Hybrid
      • REST OF EUROPE Smart Connected Assets and Operations Market by Solution Type
        • Asset Management
        • Operations Management
        • Field Service Management
        • Supply Chain Management
      • REST OF EUROPE Smart Connected Assets and Operations Market by End Use Industry Type
        • Manufacturing
        • Healthcare
        • Transportation and Logistics
        • Energy and Utilities
    • APAC Outlook (USD Billion, 2020-2034)
      • APAC Smart Connected Assets and Operations Market by Technology Type
        • Internet of Things
        • Artificial Intelligence
        • Blockchain
        • Big Data Analytics
      • APAC Smart Connected Assets and Operations Market by Deployment Type
        • On-Premises
        • Cloud-Based
        • Hybrid
      • APAC Smart Connected Assets and Operations Market by Solution Type
        • Asset Management
        • Operations Management
        • Field Service Management
        • Supply Chain Management
      • APAC Smart Connected Assets and Operations Market by End Use Industry Type
        • Manufacturing
        • Healthcare
        • Transportation and Logistics
        • Energy and Utilities
      • APAC Smart Connected Assets and Operations Market by Regional Type
        • China
        • India
        • Japan
        • South Korea
        • Malaysia
        • Thailand
        • Indonesia
        • Rest of APAC
      • CHINA Outlook (USD Billion, 2020-2034)
      • CHINA Smart Connected Assets and Operations Market by Technology Type
        • Internet of Things
        • Artificial Intelligence
        • Blockchain
        • Big Data Analytics
      • CHINA Smart Connected Assets and Operations Market by Deployment Type
        • On-Premises
        • Cloud-Based
        • Hybrid
      • CHINA Smart Connected Assets and Operations Market by Solution Type
        • Asset Management
        • Operations Management
        • Field Service Management
        • Supply Chain Management
      • CHINA Smart Connected Assets and Operations Market by End Use Industry Type
        • Manufacturing
        • Healthcare
        • Transportation and Logistics
        • Energy and Utilities
      • INDIA Outlook (USD Billion, 2020-2034)
      • INDIA Smart Connected Assets and Operations Market by Technology Type
        • Internet of Things
        • Artificial Intelligence
        • Blockchain
        • Big Data Analytics
      • INDIA Smart Connected Assets and Operations Market by Deployment Type
        • On-Premises
        • Cloud-Based
        • Hybrid
      • INDIA Smart Connected Assets and Operations Market by Solution Type
        • Asset Management
        • Operations Management
        • Field Service Management
        • Supply Chain Management
      • INDIA Smart Connected Assets and Operations Market by End Use Industry Type
        • Manufacturing
        • Healthcare
        • Transportation and Logistics
        • Energy and Utilities
      • JAPAN Outlook (USD Billion, 2020-2034)
      • JAPAN Smart Connected Assets and Operations Market by Technology Type
        • Internet of Things
        • Artificial Intelligence
        • Blockchain
        • Big Data Analytics
      • JAPAN Smart Connected Assets and Operations Market by Deployment Type
        • On-Premises
        • Cloud-Based
        • Hybrid
      • JAPAN Smart Connected Assets and Operations Market by Solution Type
        • Asset Management
        • Operations Management
        • Field Service Management
        • Supply Chain Management
      • JAPAN Smart Connected Assets and Operations Market by End Use Industry Type
        • Manufacturing
        • Healthcare
        • Transportation and Logistics
        • Energy and Utilities
      • SOUTH KOREA Outlook (USD Billion, 2020-2034)
      • SOUTH KOREA Smart Connected Assets and Operations Market by Technology Type
        • Internet of Things
        • Artificial Intelligence
        • Blockchain
        • Big Data Analytics
      • SOUTH KOREA Smart Connected Assets and Operations Market by Deployment Type
        • On-Premises
        • Cloud-Based
        • Hybrid
      • SOUTH KOREA Smart Connected Assets and Operations Market by Solution Type
        • Asset Management
        • Operations Management
        • Field Service Management
        • Supply Chain Management
      • SOUTH KOREA Smart Connected Assets and Operations Market by End Use Industry Type
        • Manufacturing
        • Healthcare
        • Transportation and Logistics
        • Energy and Utilities
      • MALAYSIA Outlook (USD Billion, 2020-2034)
      • MALAYSIA Smart Connected Assets and Operations Market by Technology Type
        • Internet of Things
        • Artificial Intelligence
        • Blockchain
        • Big Data Analytics
      • MALAYSIA Smart Connected Assets and Operations Market by Deployment Type
        • On-Premises
        • Cloud-Based
        • Hybrid
      • MALAYSIA Smart Connected Assets and Operations Market by Solution Type
        • Asset Management
        • Operations Management
        • Field Service Management
        • Supply Chain Management
      • MALAYSIA Smart Connected Assets and Operations Market by End Use Industry Type
        • Manufacturing
        • Healthcare
        • Transportation and Logistics
        • Energy and Utilities
      • THAILAND Outlook (USD Billion, 2020-2034)
      • THAILAND Smart Connected Assets and Operations Market by Technology Type
        • Internet of Things
        • Artificial Intelligence
        • Blockchain
        • Big Data Analytics
      • THAILAND Smart Connected Assets and Operations Market by Deployment Type
        • On-Premises
        • Cloud-Based
        • Hybrid
      • THAILAND Smart Connected Assets and Operations Market by Solution Type
        • Asset Management
        • Operations Management
        • Field Service Management
        • Supply Chain Management
      • THAILAND Smart Connected Assets and Operations Market by End Use Industry Type
        • Manufacturing
        • Healthcare
        • Transportation and Logistics
        • Energy and Utilities
      • INDONESIA Outlook (USD Billion, 2020-2034)
      • INDONESIA Smart Connected Assets and Operations Market by Technology Type
        • Internet of Things
        • Artificial Intelligence
        • Blockchain
        • Big Data Analytics
      • INDONESIA Smart Connected Assets and Operations Market by Deployment Type
        • On-Premises
        • Cloud-Based
        • Hybrid
      • INDONESIA Smart Connected Assets and Operations Market by Solution Type
        • Asset Management
        • Operations Management
        • Field Service Management
        • Supply Chain Management
      • INDONESIA Smart Connected Assets and Operations Market by End Use Industry Type
        • Manufacturing
        • Healthcare
        • Transportation and Logistics
        • Energy and Utilities
      • REST OF APAC Outlook (USD Billion, 2020-2034)
      • REST OF APAC Smart Connected Assets and Operations Market by Technology Type
        • Internet of Things
        • Artificial Intelligence
        • Blockchain
        • Big Data Analytics
      • REST OF APAC Smart Connected Assets and Operations Market by Deployment Type
        • On-Premises
        • Cloud-Based
        • Hybrid
      • REST OF APAC Smart Connected Assets and Operations Market by Solution Type
        • Asset Management
        • Operations Management
        • Field Service Management
        • Supply Chain Management
      • REST OF APAC Smart Connected Assets and Operations Market by End Use Industry Type
        • Manufacturing
        • Healthcare
        • Transportation and Logistics
        • Energy and Utilities
    • South America Outlook (USD Billion, 2020-2034)
      • South America Smart Connected Assets and Operations Market by Technology Type
        • Internet of Things
        • Artificial Intelligence
        • Blockchain
        • Big Data Analytics
      • South America Smart Connected Assets and Operations Market by Deployment Type
        • On-Premises
        • Cloud-Based
        • Hybrid
      • South America Smart Connected Assets and Operations Market by Solution Type
        • Asset Management
        • Operations Management
        • Field Service Management
        • Supply Chain Management
      • South America Smart Connected Assets and Operations Market by End Use Industry Type
        • Manufacturing
        • Healthcare
        • Transportation and Logistics
        • Energy and Utilities
      • South America Smart Connected Assets and Operations Market by Regional Type
        • Brazil
        • Mexico
        • Argentina
        • Rest of South America
      • BRAZIL Outlook (USD Billion, 2020-2034)
      • BRAZIL Smart Connected Assets and Operations Market by Technology Type
        • Internet of Things
        • Artificial Intelligence
        • Blockchain
        • Big Data Analytics
      • BRAZIL Smart Connected Assets and Operations Market by Deployment Type
        • On-Premises
        • Cloud-Based
        • Hybrid
      • BRAZIL Smart Connected Assets and Operations Market by Solution Type
        • Asset Management
        • Operations Management
        • Field Service Management
        • Supply Chain Management
      • BRAZIL Smart Connected Assets and Operations Market by End Use Industry Type
        • Manufacturing
        • Healthcare
        • Transportation and Logistics
        • Energy and Utilities
      • MEXICO Outlook (USD Billion, 2020-2034)
      • MEXICO Smart Connected Assets and Operations Market by Technology Type
        • Internet of Things
        • Artificial Intelligence
        • Blockchain
        • Big Data Analytics
      • MEXICO Smart Connected Assets and Operations Market by Deployment Type
        • On-Premises
        • Cloud-Based
        • Hybrid
      • MEXICO Smart Connected Assets and Operations Market by Solution Type
        • Asset Management
        • Operations Management
        • Field Service Management
        • Supply Chain Management
      • MEXICO Smart Connected Assets and Operations Market by End Use Industry Type
        • Manufacturing
        • Healthcare
        • Transportation and Logistics
        • Energy and Utilities
      • ARGENTINA Outlook (USD Billion, 2020-2034)
      • ARGENTINA Smart Connected Assets and Operations Market by Technology Type
        • Internet of Things
        • Artificial Intelligence
        • Blockchain
        • Big Data Analytics
      • ARGENTINA Smart Connected Assets and Operations Market by Deployment Type
        • On-Premises
        • Cloud-Based
        • Hybrid
      • ARGENTINA Smart Connected Assets and Operations Market by Solution Type
        • Asset Management
        • Operations Management
        • Field Service Management
        • Supply Chain Management
      • ARGENTINA Smart Connected Assets and Operations Market by End Use Industry Type
        • Manufacturing
        • Healthcare
        • Transportation and Logistics
        • Energy and Utilities
      • REST OF SOUTH AMERICA Outlook (USD Billion, 2020-2034)
      • REST OF SOUTH AMERICA Smart Connected Assets and Operations Market by Technology Type
        • Internet of Things
        • Artificial Intelligence
        • Blockchain
        • Big Data Analytics
      • REST OF SOUTH AMERICA Smart Connected Assets and Operations Market by Deployment Type
        • On-Premises
        • Cloud-Based
        • Hybrid
      • REST OF SOUTH AMERICA Smart Connected Assets and Operations Market by Solution Type
        • Asset Management
        • Operations Management
        • Field Service Management
        • Supply Chain Management
      • REST OF SOUTH AMERICA Smart Connected Assets and Operations Market by End Use Industry Type
        • Manufacturing
        • Healthcare
        • Transportation and Logistics
        • Energy and Utilities
    • MEA Outlook (USD Billion, 2020-2034)
      • MEA Smart Connected Assets and Operations Market by Technology Type
        • Internet of Things
        • Artificial Intelligence
        • Blockchain
        • Big Data Analytics
      • MEA Smart Connected Assets and Operations Market by Deployment Type
        • On-Premises
        • Cloud-Based
        • Hybrid
      • MEA Smart Connected Assets and Operations Market by Solution Type
        • Asset Management
        • Operations Management
        • Field Service Management
        • Supply Chain Management
      • MEA Smart Connected Assets and Operations Market by End Use Industry Type
        • Manufacturing
        • Healthcare
        • Transportation and Logistics
        • Energy and Utilities
      • MEA Smart Connected Assets and Operations Market by Regional Type
        • GCC Countries
        • South Africa
        • Rest of MEA
      • GCC COUNTRIES Outlook (USD Billion, 2020-2034)
      • GCC COUNTRIES Smart Connected Assets and Operations Market by Technology Type
        • Internet of Things
        • Artificial Intelligence
        • Blockchain
        • Big Data Analytics
      • GCC COUNTRIES Smart Connected Assets and Operations Market by Deployment Type
        • On-Premises
        • Cloud-Based
        • Hybrid
      • GCC COUNTRIES Smart Connected Assets and Operations Market by Solution Type
        • Asset Management
        • Operations Management
        • Field Service Management
        • Supply Chain Management
      • GCC COUNTRIES Smart Connected Assets and Operations Market by End Use Industry Type
        • Manufacturing
        • Healthcare
        • Transportation and Logistics
        • Energy and Utilities
      • SOUTH AFRICA Outlook (USD Billion, 2020-2034)
      • SOUTH AFRICA Smart Connected Assets and Operations Market by Technology Type
        • Internet of Things
        • Artificial Intelligence
        • Blockchain
        • Big Data Analytics
      • SOUTH AFRICA Smart Connected Assets and Operations Market by Deployment Type
        • On-Premises
        • Cloud-Based
        • Hybrid
      • SOUTH AFRICA Smart Connected Assets and Operations Market by Solution Type
        • Asset Management
        • Operations Management
        • Field Service Management
        • Supply Chain Management
      • SOUTH AFRICA Smart Connected Assets and Operations Market by End Use Industry Type
        • Manufacturing
        • Healthcare
        • Transportation and Logistics
        • Energy and Utilities
      • REST OF MEA Outlook (USD Billion, 2020-2034)
      • REST OF MEA Smart Connected Assets and Operations Market by Technology Type
        • Internet of Things
        • Artificial Intelligence
        • Blockchain
        • Big Data Analytics
      • REST OF MEA Smart Connected Assets and Operations Market by Deployment Type
        • On-Premises
        • Cloud-Based
        • Hybrid
      • REST OF MEA Smart Connected Assets and Operations Market by Solution Type
        • Asset Management
        • Operations Management
        • Field Service Management
        • Supply Chain Management
      • REST OF MEA Smart Connected Assets and Operations Market by End Use Industry Type
        • Manufacturing
        • Healthcare
        • Transportation and Logistics
        • Energy and Utilities
    Report Infographic
    Free Sample Request

    Kindly complete the form below to receive a free sample of this Report

    Customer Strories

    “I am very pleased with how market segments have been defined in a relevant way for my purposes (such as "Portable Freezers & refrigerators" and "last-mile"). In general the report is well structured. Thanks very much for your efforts.”

    Victoria Milne Founder
    Case Study

    Chemicals and Materials