• Cat-intel
  • MedIntelliX
  • Resources
  • About Us
  • Request Free Sample ×

    Kindly complete the form below to receive a free sample of this Report

    Leading companies partner with us for data-driven Insights

    clients tt-cursor

    IT Operation Analytics Market

    ID: MRFR/ICT/4460-HCR
    100 Pages
    Ankit Gupta
    September 2025

    IT Operation Analytics Market Research Report Information By Technology (Visual Analytics, Machine-Based Learning, Predictive Analytics, User-Behavior Analytics And Root-Cause Analytics) And By Region (North America, Europe, Asia-Pacific, And Rest Of The World) –Market Forecast Till 2032

    Share:
    Download PDF ×

    We do not share your information with anyone. However, we may send you emails based on your report interest from time to time. You may contact us at any time to opt-out.

    IT Operation Analytics Market Research Report – Forecast to 2032 Infographic
    Purchase Options
    $ 4,950.0
    $ 5,950.0
    $ 7,250.0
    Table of Contents

    IT Operation Analytics Market Summary

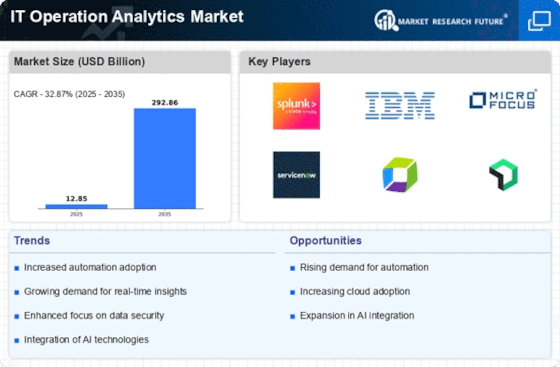
    The Global IT Operation Analytics Market is projected to grow from 12.8 USD Billion in 2024 to 292.7 USD Billion by 2035, reflecting a robust growth trajectory.

    Key Market Trends & Highlights

    IT Operation Analytics Key Trends and Highlights

    • The market is expected to experience a compound annual growth rate (CAGR) of 32.87 percent from 2025 to 2035.
    • By 2035, the market valuation is anticipated to reach 292.7 USD Billion, indicating substantial growth potential.
    • In 2024, the market is valued at 12.8 USD Billion, showcasing a strong foundation for future expansion.
    • Growing adoption of advanced analytics tools due to the increasing need for operational efficiency is a major market driver.

    Market Size & Forecast

    2024 Market Size 12.8 (USD Billion)
    2035 Market Size 292.7 (USD Billion)
    CAGR (2025-2035) 32.87%

    Major Players

    Oracle Corporation (U.S.), IBM Corporation (U.S.), SAP SE (Germany), Hewlett Packard Enterprise Company (U.S.), Splunk Inc. (U.S.), Microsoft Corporation (U.S.), Evolven Software Inc. (U.S.), ExtraHop Networks (U.S.), VMware Inc. (U.S.), Prelert Inc. (U.S.)

    IT Operation Analytics Market Trends

    Growth of big data and need for its management led to the market growth

    The rapid growth of the IT industry has resulted in an increase in the complexity of operations and data. The enormous and complicated nature of this data, frequently referred to as "big data," necessitates the use of a management and analytics system. According to IDC, new data generation will expand at a market CAGR of 23% from 2022 to 2032, culminating in roughly 175ZB of data creation by 2032. According to IDC, by 2032, over 30% of all data generated will be real-time.

    As a result, in order to manage this volume of big data in real time in the future, IT operation analytics will be required. It can process large amounts of data from many applications and deliver real-time analytical results. According to Gartner, about 15% of organizations would actively use ITOA (IT Operations Analytics) technology to provide insight into both business execution and IT operations. These big data operations analytics solutions can aid with better performance, analysis to enable leaders make more educated investment decisions, and therefore drive the market.

    Additionally, artificial and human intelligence interfaces are rapidly driving digital supply chains, requiring cyber-physical viewpoints in operations and supply chain management. The Internet of Things has a big market impact. This is because the demand for effective IT operational analytics, as well as data extraction and administration, is increasing. The increased use of 5G networks opens up new opportunities for AI-based applications in industrial systems and supply chains employing IT operations analytics. 5G networks expand support for machine-to-machine communication while striving for lower prices and lower battery consumption.

    According to the findings, 65% of enterprises intend to build 5G networks by 2020, primarily for IoT and video communications. A 2017 CEO survey of 5G potential applications revealed five different services that could be supported. In 2021, Capgemini Whitepapers showcases that customer analytics only creates a profit of $38 billion ly while operational improvement has a massive profit increase of up to $117 billion. As a result of growing automated technology, there are more innovative solutions in IT operations analytics which is predicted to drive this market in future.

    For instance, in 2021, Capgemini Whitepapers showcases that customer analytics only creates a profit of $38 billion ly while operational improvement has a massive profit increase of up to $117 billion. As a result of growing automated technology, there are more innovative solutions in IT operations analytics which is predicted to drive this market in future. Thus, driving the IT operation analytics market revenue.

    The Global IT Operation Analytics Market is poised for substantial growth as organizations increasingly seek to leverage data-driven insights for enhanced operational efficiency and decision-making.

    U.S. Department of Commerce

    IT Operation Analytics Market Drivers

    Focus on Cybersecurity

    The growing emphasis on cybersecurity is a significant driver for the Global IT Operation Analytics Market Industry. As cyber threats become more sophisticated, organizations are investing in analytics to enhance their security posture. IT operation analytics provides insights into potential vulnerabilities and helps in the detection of anomalies that may indicate security breaches. This proactive approach to cybersecurity not only protects sensitive data but also ensures compliance with regulatory requirements. The increasing allocation of budgets towards cybersecurity initiatives is expected to further propel the market, as organizations prioritize safeguarding their digital assets.

    Market Growth Projections

    The Global IT Operation Analytics Market Industry is poised for remarkable growth, with projections indicating a market size of 12.8 USD Billion in 2024 and an anticipated expansion to 292.7 USD Billion by 2035. This growth trajectory reflects a compound annual growth rate (CAGR) of 32.87% from 2025 to 2035. The increasing reliance on data analytics across various sectors underscores the market's potential. As organizations continue to recognize the value of IT operation analytics in driving efficiency and innovation, the industry is expected to attract significant investments and technological advancements.

    Cloud Adoption and Scalability

    Cloud adoption is reshaping the Global IT Operation Analytics Market Industry by providing scalable solutions that meet the evolving needs of businesses. Organizations are increasingly migrating their operations to the cloud, which facilitates access to advanced analytics tools without significant upfront investments. This shift allows for greater flexibility and scalability, enabling companies to adapt to changing market conditions. As cloud-based analytics solutions gain traction, the market is poised for robust growth, with a projected CAGR of 32.87% from 2025 to 2035. The ability to leverage cloud technology for analytics is becoming a critical factor for organizations aiming to remain competitive.

    Regulatory Compliance and Governance

    Regulatory compliance and governance are critical drivers influencing the Global IT Operation Analytics Market Industry. Organizations are mandated to adhere to various regulations that govern data management and privacy. Analytics plays a vital role in ensuring compliance by providing insights into data usage and governance practices. Companies are leveraging IT operation analytics to monitor compliance metrics and identify areas for improvement. As regulatory frameworks evolve, the demand for analytics solutions that facilitate compliance is likely to increase, driving market growth. Organizations that prioritize compliance through analytics can mitigate risks and enhance their reputation.

    Integration of Artificial Intelligence

    The integration of artificial intelligence (AI) into IT operations is a pivotal driver for the Global IT Operation Analytics Market Industry. AI technologies enhance predictive analytics, enabling organizations to anticipate issues before they escalate. This capability not only reduces downtime but also optimizes resource utilization. As AI adoption accelerates, the market is likely to witness substantial growth, with projections indicating a market size of 292.7 USD Billion by 2035. Companies that harness AI-driven analytics can achieve a competitive edge, as they streamline operations and enhance customer experiences through personalized services.

    Rising Demand for Data-Driven Insights

    The Global IT Operation Analytics Market Industry experiences a surge in demand for data-driven insights as organizations increasingly rely on analytics to enhance operational efficiency. In 2024, the market is projected to reach 12.8 USD Billion, driven by the need for real-time data analysis and decision-making. Companies are leveraging analytics to identify patterns, optimize resource allocation, and improve service delivery. This trend is particularly evident in sectors such as finance and healthcare, where data analytics plays a crucial role in risk management and patient care. As organizations recognize the value of actionable insights, the market is expected to grow significantly.

    Market Segment Insights

    IT Operation Analytics Technology Insights

    The IT operation analytics market segmentation, based on technology includes visual analytics, machine-based learning, predictive analytics, user-behavior analytics and root-cause analytics. In 2022, the root cause analytics sector held the greatest market share of more than 30%. The growth of IT operations data, the amount of sensors for problem detection, and the number of Internet of Things (IoT) devices has increased organizational need for root cause analytics. The root cause is the primary reason for a decrease in an asset's quality or overall device/equipment efficacy. The application of analytics in this industry has grown in relevance.

    Furthermore, the development of additional technologies such as industrial IoT and AI has increased demand for advanced root cause analytics solutions.

    The predictive analytics category is predicted to increase at a higher rate over the projection period. According to a market analysis, the application of predictive analytics for operational tasks can save the manufacturing industry up to USD 700 billion over the next two decades.

    Figure2: IT Operation Analytics Market, by Technology, 2022 & 2032 (USD billion)

    IT Operation Analytics Market, by Technology, 2022 & 2032

    Source: Secondary Research, Primary Research, Market Research Future Database and Analyst Review

    Regional Insights

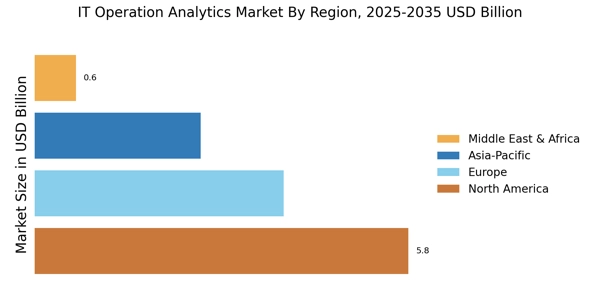
    By Region, the study provides the market insights into North America, Europe, Asia-Pacific and the Rest of the World. North America dominated the IT Operations Analytics Market in 2022, accounting for 38% of total market size, and is expected to increase significantly during the forecast period 2022-2032. With the support of IT operation analytics, IoT-connected devices collect a vast amount of unstructured data, which is processed and analyzed for root cause analysis, log and inventory management, and customer relationship management.

    Further, the major countries studied in the market report are The U.S., Canada, German, France, the UK, Italy, Spain, China, Japan, India, Australia, South Korea, and Brazil.

    Figure3: IT OPERATION ANALYTICS MARKET SHARE BY REGION 2022 (%)

    IT OPERATION ANALYTICS MARKET SHARE BY REGION 2022

    Source: Secondary Research, Primary Research, Market Research Future Database and Analyst Review

    Europe’s IT operation analytics market accounts for the second-largest market share due to rise in technology adoption from retail and consumer goods, transportation & logistics, and manufacturing end-user to improve consumer experience is predicted to provide to the growth of the market in the region. Further, the German IT operation analytics market held the largest market share, and the UK IT operation analytics market was the fastest-growing market in the European region

    The Asia-Pacific IT Operation Analytics Market is expected to grow at the fastest CAGR from 2023 to 2032. This is due to the growing awareness of operational analytics among businesses in emerging markets such as China and India. Moreover, China’s IT operation analytics market held the largest market share, and the Indian IT operation analytics market was the fastest-growing market in the Asia-Pacific region.

    Key Players and Competitive Insights

    Leading market players are investing heavily in R&D in order to expand their product lines, which will help the IT operation analytics market, grow even more. Market participants are also undertaking a variety of strategic activities to expand their footprint, with important market developments including new product launches, contractual agreements, mergers and acquisitions, higher investments, and collaboration with other organizations. To expand and survive in a more competitive and rising market climate, IT operation analytics industry must offer cost-effective items.

    One of the most important business strategies employed by manufacturers in the IT operation analytics industry to assist customers and expand the market sector is local manufacturing to reduce operational costs. Some of the most important benefits to medicine have recently been provided by the IT operation analytics industry.

    Major players in the IT operation analytics market, such as Oracle Corporation (U.S.), IBM Corporation (U.S.), SAP SE (Germany), Hewlett Packard Enterprise Company (U.S.), Splunk Inc. (U.S.), Microsoft Corporation (U.S.), Evolven Software Inc. (U.S.), ExtraHop Networks (U.S.), and others, are attempting to boost market demand by investing in research and development activities.

    Microsoft Corporation is a multinational technology company based in Redmond, Washington. The Windows operating system, the Microsoft Office suite, and the Internet Explorer and Edge web browsers are among Microsoft's most well-known software products. The Xbox video game consoles and the Microsoft Surface family of touchscreen personal PCs are its major hardware products. Microsoft placed 14th in the 2022 Fortune 500 list of the largest US firms by total revenue; as of 2022, it was the world's largest software maker by revenue.

    Together with Alphabet (parent company of Google), Amazon, Apple, and Meta, it is regarded one of the Big Five American information technology corporations (formerly Facebook). In October 2020, Microsoft announced the broad availability of the Desktop Analytics product This cloud-connected service connects with System Center Configuration Manager, to control Windows endpoints based on the data. It combines data from your organization with data aggregated from millions of devices connected to Microsoft cloud services to save time of IT personnel.

    Citrix Systems, Inc. is a worldwide cloud computing and virtualization technology business based in the United States that offers server, application, and desktop virtualization, networking, software as a service (SaaS), and cloud computing solutions. Citrix claims that its solutions are used by over 400,000 clients ly, including 99% of the Fortune 100 and 98% of the Fortune 500. Ed Iacobucci, who served as chairman until his resignation in 2000, launched the company in Richardson, Texas, in 1989.

    It began by producing remote access products for Microsoft operating systems, licensing source code from Microsoft, and has worked in close collaboration with the firm ever since. Citrix sprang to prominence as an industry leader in thin client technology by the 1990s, allowing purpose-built devices to connect to remote servers. In July 2020, Citrix and Microsoft will collaborate on tools and services to make the migration of on-premises Citrix clients to Microsoft Azure easier and faster.

    Through the deepening of this partnership, Citrix and Microsoft are helping CIOs to minimize the risk, cost, and complexity in accelerating their transformation to cloud for greater agility, productivity, and security.

    Key Companies in the IT Operation Analytics Market market include

    Industry Developments

    • Q2 2024: Splunk launches new AI-driven IT operations analytics platform Splunk announced the release of its next-generation IT operations analytics platform, integrating advanced AI features to automate incident detection and resolution for enterprise customers.
    • Q2 2024: IBM acquires startup Databand.ai to bolster IT operations analytics capabilities IBM completed the acquisition of Databand.ai, a data observability platform, to enhance its IT operations analytics offerings and provide customers with improved data pipeline monitoring and troubleshooting.
    • Q3 2024: ServiceNow announces partnership with Google Cloud for IT operations analytics ServiceNow and Google Cloud entered a strategic partnership to deliver integrated IT operations analytics solutions, leveraging Google’s AI and ServiceNow’s workflow automation.
    • Q2 2024: Dynatrace appoints new Chief Technology Officer to drive analytics innovation Dynatrace named Dr. Priya Raman as its new CTO, tasking her with leading the company’s IT operations analytics product development and AI strategy.
    • Q3 2024: Elastic launches unified observability and IT operations analytics suite Elastic introduced a new suite combining observability and IT operations analytics, aiming to provide enterprises with end-to-end visibility and faster root cause analysis.
    • Q2 2024: Microsoft secures multi-year IT operations analytics contract with UK government Microsoft signed a multi-year agreement to provide IT operations analytics and cloud monitoring solutions to several UK government agencies, supporting digital transformation initiatives.
    • Q3 2024: PagerDuty acquires incident automation startup Jeli PagerDuty acquired Jeli, a startup specializing in incident analysis and automation, to expand its IT operations analytics and incident response capabilities.
    • Q2 2024: Cisco launches new AI-powered IT operations analytics features in AppDynamics Cisco unveiled new AI-powered analytics features for its AppDynamics platform, designed to help enterprises proactively identify and resolve IT performance issues.
    • Q3 2024: New Relic announces general availability of AIOps-powered IT operations analytics New Relic launched its AIOps-powered IT operations analytics solution, offering automated anomaly detection and predictive insights for IT teams.
    • Q2 2024: Oracle expands IT operations analytics capabilities with new cloud observability tools Oracle introduced new cloud observability and IT operations analytics tools, enhancing its Oracle Cloud Infrastructure platform for enterprise customers.
    • Q3 2024: BMC Software partners with AWS to deliver IT operations analytics as a managed service BMC Software and AWS announced a partnership to offer IT operations analytics as a managed service, targeting large enterprises migrating to the cloud.
    • Q2 2024: Moogsoft raises $30M to accelerate IT operations analytics product development Moogsoft secured $30 million in new funding to expand its IT operations analytics platform, focusing on AI-driven incident management and automation.

    Future Outlook

    IT Operation Analytics Market Future Outlook

    The IT Operation Analytics Market is poised for robust growth at 32.87% CAGR from 2024 to 2035, driven by increasing data complexity, demand for real-time insights, and automation technologies.

    New opportunities lie in:

    • Develop AI-driven analytics tools to enhance predictive maintenance capabilities.
    • Leverage cloud-based solutions for scalable IT operations management.
    • Create integrated platforms that unify IT operations and business analytics.

    By 2035, the IT Operation Analytics Market is expected to achieve substantial growth, reflecting its critical role in digital transformation.

    Market Segmentation

    IT Operation Analytics Regional Outlook

    • Middle East
    • Africa
    • Latin America

    IT Operation Analytics Market Technology Outlook

    • Visual Analytics
    • Machine-Based Learning
    • Predictive Analytics
    • User-Behavior Analytics
    • Root-Cause Analytics

    Report Scope

    Report Attribute/Metric Details
    Market Size 2023 USD 9.3 billion
    Market Size 2024 USD 12.84981 billion
    Market Size 2032 USD 124.8 billion
    Compound Annual Growth Rate (CAGR) 32.87% (2024-2032)
    Base Year 2023
    Market Forecast Period 2024-2032
    Historical Data 2019- 2021
    Market Forecast Units Value (USD Billion)
    Report Coverage Revenue Forecast, Market Competitive Landscape, Growth Factors, and Trends
    Segments Covered Technology and Region
    Geographies Covered North America, Europe, Asia Pacific, and the Rest of the World
    Countries Covered The U.S., Canada, German, France, UK, Italy, Spain, China, Japan, India, Australia, South Korea, and Brazil
    Key Companies Profiled Oracle Corporation (U.S.), IBM Corporation (U.S.), SAP SE (Germany), Hewlett Packard Enterprise Company (U.S.), Splunk Inc. (U.S.), Microsoft Corporation (U.S.), Evolven Software Inc. (U.S.), ExtraHop Networks (U.S.), VMware Inc. (U.S.), and Prelert Inc. (U.S.).
    Key Market Opportunities Growing need of companies for holistic 360degree visibility.
    Key Market Dynamics Proliferation of huge amounts of IT operations data.

    Market Highlights

    Author
    Ankit Gupta
    Senior Research Analyst

    Ankit Gupta is an analyst in market research industry in ICT and SEMI industry. With post-graduation in "Telecom and Marketing Management" and graduation in "Electronics and Telecommunication" vertical he is well versed with recent development in ICT industry as a whole. Having worked on more than 150+ reports including consultation for fortune 500 companies such as Microsoft and Rio Tinto in identifying solutions with respect to business problems his opinions are inclined towards mixture of technical and managerial aspects.

    Leave a Comment

    FAQs

    How much is the IT operation analytics market?

    The IT operation analytics market size was valued at USD 9.3 Billion in 2023.

    What is the growth rate of the IT operation analytics market?

    The market is projected to grow at a CAGR of 32.87% during the forecast period, 2024-2032.

    Which region held the largest market share in the IT operation analytics market?

    North America had the largest share of the market

    Who are the key players in the IT operation analytics market?

    The key players in the market are Oracle Corporation (U.S.), IBM Corporation (U.S.), SAP SE (Germany), Hewlett Packard Enterprise Company (U.S.), Splunk Inc. (U.S.), Microsoft Corporation (U.S.), Evolven Software Inc. (U.S.), ExtraHop Networks (U.S.).

    Which technology led the IT operation analytics market?

    The root-cause IT operation analytics category dominated the market in 2022.

    1. Executive Summary
    2. Scope of the Report
      1. Market
    3. Definition
      1. Scope of the Study
        1. Research Objectives
        2. Assumptions & Limitations
    4. Markets Structure
    5. Market Research Methodology
      1. Research Process
    6. Secondary Research
      1. Primary Research
      2. Forecast Model
    7. Market Landscape
    8. Porter’s Five Forces Analysis
      1. Threat of New Entrants
    9. Bargaining power of buyers
      1. Threat of substitutes
        1. Segment rivalry
    10. Bargaining power of suppliers
      1. Value Chain/Supply Chain of Global IT Operation
    11. Analytics Market
    12. Industry Overview of Global IT Operation Analytics Market
    13. Introduction
      1. Growth Drivers
      2. Impact analysis
      3. Market
    14. Challenges
    15. Market Trends
      1. Introduction
      2. Growth Trends
      3. Impact
    16. analysis
    17. Global IT Operation Analytics Market by Technology
      1. Introduction
    18. Visual Analytics
      1. Market Estimates & Forecast, 2023-2032
        1. Market
    19. Estimates & Forecast by Region, 2023-2032
      1. Machine-Based Learning
    20. Market Estimates & Forecast, 2023-2032
      1. Market Estimates & Forecast
    21. by Region, 2023-2032
      1. Predictive Analytics
        1. Market Estimates & Forecast,
        2. Market Estimates & Forecast by Region, 2023-2032
      2. User-Behavior
    22. Analytics
      1. Market Estimates & Forecast, 2023-2032
        1. Market Estimates & Forecast
    23. by Region, 2023-2032
      1. Root-Cause Analytics
        1. Market Estimates & Forecast,
        2. Market Estimates & Forecast by Region, 2023-2032
    24. Global IT Operation Analytics Market by Organization Size
      1. Introduction
      2. Cloud
    25. Market Estimates & Forecast, 2023-2032
      1. Market Estimates & Forecast
    26. by Region, 2023-2032
      1. On Premise
        1. Market Estimates & Forecast,
        2. Market Estimates & Forecast by Region, 2023-2032
    27. Global IT Operation Analytics Market by Deployment
      1. Introduction
      2. Cloud
        1. Market Estimates & Forecast, 2023-2032
        2. Market Estimates & Forecast
    28. by Region, 2023-2032
      1. On Premise
        1. Market Estimates & Forecast,
        2. Market Estimates & Forecast by Region, 2023-2032
    29. Global IT Operation Analytics Market by Application
      1. Introduction
      2. Real-Time
    30. Log Analytics
      1. Market Estimates & Forecast, 2023-2032
    31. Market Estimates & Forecast by Region, 2023-2032
      1. Application Performance Management
    32. Market Estimates & Forecast, 2023-2032
      1. Market Estimates &
    33. Forecast by Region, 2023-2032
      1. Infrastructure Management
        1. Market
    34. Estimates & Forecast, 2023-2032
      1. Market Estimates & Forecast
    35. by Region, 2023-2032
      1. Network & Security Management
        1. Market Estimates &
    36. Forecast, 2023-2032
      1. Market Estimates & Forecast by Region, 2023-2032
    37. Others
      1. Market Estimates & Forecast, 2023-2032
        1. Market Estimates &
    38. Forecast by Region, 2023-2032
    39. Global IT Operation Analytics Market
    40. by Vertical
      1. Introduction
      2. BFSI
        1. Market Estimates &
    41. Forecast, 2023-2032
      1. Market Estimates & Forecast by Region, 2023-2032
    42. Healthcare
      1. Market Estimates & Forecast, 2023-2032
        1. Market Estimates &
    43. Forecast by Region, 2023-2032
      1. Manufacturing
        1. Market Estimates &
    44. Forecast, 2023-2032
      1. Market Estimates & Forecast by Region, 2023-2032
    45. Retail
      1. Market Estimates & Forecast, 2023-2032
        1. Market Estimates &
    46. Forecast by Region, 2023-2032
      1. IT & Telecommunication
        1. Market
    47. Estimates & Forecast, 2023-2032
      1. Market Estimates & Forecast
    48. by Region, 2023-2032
      1. Media & Entertainment
        1. Market Estimates &
    49. Forecast, 2023-2032
      1. Market Estimates & Forecast by Region, 2023-2032
    50. Government
      1. Market Estimates & Forecast, 2023-2032
        1. Market Estimates &
    51. Forecast by Region, 2023-2032
      1. Others
        1. Market Estimates &
    52. Forecast, 2023-2032
      1. Market Estimates & Forecast by Region, 2023-2032
    53. Global IT Operation Analytics Market by Region
      1. Introduction
      2. North
    54. America
      1. Market Estimates & Forecast, 2023-2032
        1. Market Estimates &
    55. Forecast by Technology, 2023-2032
      1. Market Estimates & Forecast by Organization
    56. Size, 2023-2032
      1. Market Estimates & Forecast by Deployment, 2023-2032
    57. Market Estimates & Forecast by Application, 2023-2032
      1. Market Estimates &
    58. Forecast by Vertical, 2023-2032
      1. U.S.
        1. Market Estimates &
    59. Forecast, 2023-2032
      1. Market Estimates & Forecast by Technology, 2023-2032
    60. Market Estimates & Forecast by Organization Size, 2023-2032
      1. Market
    61. Estimates & Forecast by Deployment, 2023-2032
      1. Market Estimates &
    62. Forecast by Application, 2023-2032
      1. Market Estimates & Forecast
    63. by Vertical, 2023-2032
      1. Canada
        1. Market Estimates & Forecast, 2023-2032
    64. Market Estimates & Forecast by Technology, 2023-2032
      1. Market Estimates &
    65. Forecast by Organization Size, 2023-2032
      1. Market Estimates & Forecast
    66. by Deployment, 2023-2032
      1. Market Estimates & Forecast by Application,
        1. Market Estimates & Forecast by Vertical, 2023-2032
    67. Mexico
      1. Market Estimates & Forecast, 2023-2032
        1. Market Estimates &
    68. Forecast by Technology, 2023-2032
      1. Market Estimates & Forecast by Organization
    69. Size, 2023-2032
      1. Market Estimates & Forecast by Deployment, 2023-2032
    70. Market Estimates & Forecast by Application, 2023-2032
      1. Market Estimates &
    71. Forecast by Vertical, 2023-2032
      1. Europe
        1. Market Estimates &
    72. Forecast, 2023-2032
      1. Market Estimates & Forecast by Technology, 2023-2032
    73. Market Estimates & Forecast by Organization Size, 2023-2032
      1. Market
    74. Estimates & Forecast by Deployment, 2023-2032
      1. Market Estimates &
    75. Forecast by Application, 2023-2032
      1. Market Estimates & Forecast
    76. by Vertical, 2023-2032
      1. Germany
        1. Market Estimates &
    77. Forecast, 2023-2032
      1. Market Estimates & Forecast by Technology, 2023-2032
    78. Market Estimates & Forecast by Organization Size, 2023-2032
      1. Market
    79. Estimates & Forecast by Deployment, 2023-2032
      1. Market Estimates &
    80. Forecast by Application, 2023-2032
      1. Market Estimates & Forecast
    81. by Vertical, 2023-2032
      1. France
        1. Market Estimates &
    82. Forecast, 2023-2032
      1. Market Estimates & Forecast by Technology, 2023-2032
    83. Market Estimates & Forecast by Organization Size, 2023-2032
      1. Market
    84. Estimates & Forecast by Deployment, 2023-2032
      1. Market Estimates &
    85. Forecast by Application, 2023-2032
      1. Market Estimates & Forecast
    86. by Vertical, 2023-2032
      1. Italy
        1. Market Estimates &
    87. Forecast, 2023-2032
      1. Market Estimates & Forecast by Technology, 2023-2032
    88. Market Estimates & Forecast by Organization Size, 2023-2032
      1. Market
    89. Estimates & Forecast by Deployment, 2023-2032
      1. Market Estimates &
    90. Forecast by Application, 2023-2032
      1. Market Estimates & Forecast
    91. by Vertical, 2023-2032
      1. Spain
        1. Market Estimates &
    92. Forecast, 2023-2032
      1. Market Estimates & Forecast by Technology, 2023-2032
    93. Market Estimates & Forecast by Organization Size 2023-2032
    94. Market Estimates & Forecast by Deployment, 2023-2032
      1. Market Estimates &
    95. Forecast by Application, 2023-2032
      1. Market Estimates & Forecast
    96. by Vertical, 2023-2032
      1. U.K
        1. Market Estimates &
    97. Forecast, 2023-2032
      1. Market Estimates & Forecast by Technology, 2023-2032
    98. Market Estimates & Forecast by Organization Size, 2023-2032
    99. Market Estimates & Forecast by Deployment, 2023-2032
      1. Market Estimates &
    100. Forecast by Application, 2023-2032
      1. Market Estimates & Forecast
    101. by Vertical, 2023-2032
      1. Asia Pacific
        1. Market Estimates &
    102. Forecast, 2023-2032
      1. Market Estimates & Forecast by Technology, 2023-2032
    103. Market Estimates & Forecast by Organization Size, 2023-2032
      1. Market
    104. Estimates & Forecast by Deployment, 2023-2032
      1. Market Estimates &
    105. Forecast by Application, 2023-2032
      1. Market Estimates & Forecast
    106. by Vertical, 2023-2032
      1. China
        1. Market Estimates &
    107. Forecast, 2023-2032
      1. Market Estimates & Forecast by Technology, 2023-2032
    108. Market Estimates & Forecast by Organization Size, 2023-2032
      1. Market
    109. Estimates & Forecast by Deployment, 2023-2032
      1. Market Estimates &
    110. Forecast by Application, 2023-2032
      1. Market Estimates & Forecast
    111. by Vertical, 2023-2032
      1. India
        1. Market Estimates & Forecast, 2023-2032
    112. Market Estimates & Forecast by Technology, 2023-2032
      1. Market Estimates &
    113. Forecast by Organization Size, 2023-2032
      1. Market Estimates & Forecast
    114. by Deployment, 2023-2032
      1. Market Estimates & Forecast by Application,
        1. Market Estimates & Forecast by Vertical, 2023-2032
    115. Japan
      1. Market Estimates & Forecast, 2023-2032
        1. Market Estimates &
    116. Forecast by Technology, 2023-2032
      1. Market Estimates & Forecast by Organization
    117. Size, 2023-2032
      1. Market Estimates & Forecast by Deployment, 2023-2032
    118. Market Estimates & Forecast by Application, 2023-2032
      1. Market Estimates &
    119. Forecast by Vertical, 2023-2032
      1. Rest of Asia Pacific
    120. Market Estimates & Forecast, 2023-2032
      1. Market Estimates &
    121. Forecast by Technology, 2023-2032
      1. Market Estimates & Forecast by Organization
    122. Size, 2023-2032
      1. Market Estimates & Forecast by Deployment, 2023-2032
    123. Market Estimates & Forecast by Application, 2023-2032
      1. Market Estimates &
    124. Forecast by Vertical, 2023-2032
      1. Rest of the World
        1. Market
    125. Estimates & Forecast, 2023-2032
      1. Market Estimates & Forecast
    126. by Technology, 2023-2032
      1. Market Estimates & Forecast by Organization
    127. Size, 2023-2032
      1. Market Estimates & Forecast by Deployment, 2023-2032
    128. Market Estimates & Forecast by Application, 2023-2032
      1. Market Estimates &
    129. Forecast by Vertical, 2023-2032
      1. The Middle East & Africa
    130. Market Estimates & Forecast, 2023-2032
      1. Market Estimates &
    131. Forecast by Technology, 2023-2032
      1. Market Estimates & Forecast by Organization
    132. Size, 2023-2032
      1. Market Estimates & Forecast by Deployment, 2023-2032
    133. Market Estimates & Forecast by Application, 2023-2032
      1. Market Estimates &
    134. Forecast by Vertical, 2023-2032
      1. Latin America
        1. Market Estimates &
    135. Forecast, 2023-2032
      1. Market Estimates & Forecast by Technology, 2023-2032
    136. Market Estimates & Forecast by Organization Size, 2023-2032
      1. Market
    137. Estimates & Forecast by Deployment, 2023-2032
      1. Market Estimates &
    138. Forecast by Application, 2023-2032
      1. Market Estimates & Forecast
    139. by Vertical, 2023-2032
    140. Company Landscape
    141. Company Profiles
    142. Oracle Corporation (U.S.)
      1. Company Overview
        1. Product/Business Segment
    143. Overview
      1. Financial Updates
        1. Key Developments
      2. IBM Corporation (U.S.)
    144. Company Overview
      1. Product/Business Segment Overview
        1. Financial Updates
    145. Key Developments
      1. SAP SE (Germany)
        1. Company Overview
    146. Product/Business Segment Overview
      1. Financial Updates
        1. Key Developments
    147. Hewlett Packard Enterprise Company (U.S.)
      1. Company Overview
    148. Product/Business Segment Overview
      1. Financial Updates
        1. Key Developments
    149. Splunk Inc. (U.S.)
      1. Company Overview
        1. Product/Business Segment
    150. Overview
      1. Financial Updates
        1. Key Developments
      2. Microsoft Corporation (U.S.)
    151. Company Overview
      1. Product/Business Segment Overview
        1. Financial Updates
    152. Key Developments
      1. Evolven Software Inc. (U.S.)
        1. Company Overview
    153. Product/Business Segment Overview
      1. Financial Updates
        1. Key Developments
    154. ExtraHop Networks (U.S.)
      1. Company Overview
        1. Product/Business Segment
    155. Overview
      1. Financial Updates
        1. Key Developments
      2. VMware Inc. (U.S.)
    156. Company Overview
      1. Product/Business Segment Overview
        1. Financial Updates
    157. Key Developments
      1. Prelert Inc. (U.S.)
        1. Company Overview
    158. Product/Business Segment Overview
      1. Financial Updates
        1. Key Developments
    159. Conclusion
    160. Market: By Region, 2023-2032
    161. By Country, 2023-2032
    162. Country, 2023-2032
    163. Market: By Country, 2023-2032
    164. Technology Market: By Country, 2023-2032
    165. by Organization Size Market: By Regions, 2023-2032
    166. Analytics by Organization Size Market: By Country, 2023-2032
    167. IT Operation Analytics by Organization Size Market: By Country, 2023-2032
    168. Asia-Pacific IT Operation Analytics by Organization Size Market: By Country, 2023-2032
    169. Size Market: By Country, 2023-2032
    170. by Organization Size Market: By Country, 2023-2032
    171. by Deployment Market: By Regions, 2023-2032
    172. Analytics by Deployment Market: By Country, 2023-2032
    173. by Deployment Market: By Country, 2023-2032
    174. Analytics by Deployment Market: By Country, 2023-2032
    175. Africa IT Operation Analytics by Deployment Market: By Country, 2023-2032
    176. Latin America IT Operation Analytics by Deployment Market: By Country, 2023-2032
    177. Country, 2023-2032
    178. By Country, 2023-2032
    179. By Country, 2023-2032
    180. by Application Market: By Country, 2023-2032
    181. Analytics by Application Market: By Country, 2023-2032
    182. by Vertical Market: By Regions, 2023-2032
    183. Analytics by Vertical Market: By Country, 2023-2032
    184. by Vertical Market: By Country, 2023-2032
    185. Analytics by Vertical Market: By Country, 2023-2032
    186. Africa IT Operation Analytics by Vertical Market: By Country, 2023-2032
    187. Latin America IT Operation Analytics by Vertical Market: By Country, 2023-2032
    188. Global Organization Size Market: By Region, 2023-2032
    189. By Region, 2023-2032
    190. North America IT Operation Analytics Market, By Organization Size
    191. America IT Operation Analytics Market, By Deployment
    192. Analytics Market, By Application
    193. By Vertical
    194. Europe: IT Operation Analytics Market, By Technology
    195. Market, By Organization Size
    196. Deployment
    197. Europe: IT Operation Analytics Market, By Vertical
    198. Analytics Market, By Country
    199. By Technology
    200. Size
    201. Asia Pacific: IT Operation Analytics Market, By Application
    202. Pacific: IT Operation Analytics Market, By Vertical
    203. Africa: IT Operation Analytics Market, By Country
    204. Africa IT Operation Analytics Market, By Technology
    205. Africa IT Operation Analytics Market, By Organization Size
    206. Africa: IT Operation Analytics Market, By Deployment
    207. Africa: IT Operation Analytics Market, By Application
    208. Africa: IT Operation Analytics Market, By Vertical
    209. Analytics Market, By Country
    210. By Technology
    211. Size
    212. Latin America: IT Operation Analytics Market, By Application
    213. Analytics Market, By Vertical
    214. IT Operation Analytics Market Segmentation
    215. Five Forces Analysis of Global IT Operation Analytics Market
    216. Chain of Global IT Operation Analytics Market
    217. Analytics Market in 2020, by Country (%)
    218. Market, 2023-2032,
    219. Market size by Technology, 2023-2032
    220. Analytics Market by Technology, 2023-2032
    221. Analytics Market size by Organization Size, 2023-2032
    222. Analytics Market by Organization Size, 2023-2032
    223. Analytics Market size by Deployment, 2023-2032
    224. Analytics Market by Deployment, 2023-2032
    225. Analytics Market size by Application, 2023-2032
    226. Analytics Market by Application, 2023-2032
    227. Analytics Market size by Vertical, 2023-2032
    228. Analytics Market by Vertical, 2023-2032'

    IT Operation Analytics Market Segmentation

    IT Operation Analytics Market Technology Outlook (USD Billion, 2022-2032)

    • Visual Analytics
    • Machine-Based Learning
    • Predictive Analytics
    • User-Behavior Analytics
    • Root-Cause Analytics
    • North America Outlook (USD Billion, 2022-2032)

      • North America IT Operation Analytics Market by Technology
    • Visual Analytics
    • Machine-Based Learning
    • Predictive Analytics
    • User-Behavior Analytics
    • Root-Cause Analytics
      • US Outlook (USD Billion, 2022-2032)

      • US IT Operation Analytics Market by Technology
    • Visual Analytics
    • Machine-Based Learning
    • Predictive Analytics
    • User-Behavior Analytics
    • Root-Cause Analytics
      • CANADA Outlook (USD Billion, 2022-2032)

      • CANADA IT Operation Analytics Market by Technology
    • Visual Analytics
    • Machine-Based Learning
    • Predictive Analytics
    • User-Behavior Analytics
    • Root-Cause Analytics
    • Europe Outlook (USD Billion, 2022-2032)

      • Europe IT Operation Analytics Market by Technology
    • Visual Analytics
    • Machine-Based Learning
    • Predictive Analytics
    • User-Behavior Analytics
    • Root-Cause Analytics
      • Germany Outlook (USD Billion, 2022-2032)

      • Germany IT Operation Analytics Market by Technology
    • Visual Analytics
    • Machine-Based Learning
    • Predictive Analytics
    • User-Behavior Analytics
    • Root-Cause Analytics
      • France Outlook (USD Billion, 2022-2032)

      • France IT Operation Analytics Market by Technology
    • Visual Analytics
    • Machine-Based Learning
    • Predictive Analytics
    • User-Behavior Analytics
    • Root-Cause Analytics
      • UK Outlook (USD Billion, 2022-2032)

      • UK IT Operation Analytics Market by Technology
    • Visual Analytics
    • Machine-Based Learning
    • Predictive Analytics
    • User-Behavior Analytics
    • Root-Cause Analytics
      • IT ALY Outlook (USD Billion, 2022-2032)

      • IT ALY IT Operation Analytics Market by Technology
    • Visual Analytics
    • Machine-Based Learning
    • Predictive Analytics
    • User-Behavior Analytics
    • Root-Cause Analytics
      • SPAIN Outlook (USD Billion, 2022-2032)

      • Spain IT Operation Analytics Market by Technology
    • Visual Analytics
    • Machine-Based Learning
    • Predictive Analytics
    • User-Behavior Analytics
    • Root-Cause Analytics
      • Rest Of Europe Outlook (USD Billion, 2022-2032)

      • Rest Of Europe IT Operation Analytics Market by Technology
    • Visual Analytics
    • Machine-Based Learning
    • Predictive Analytics
    • User-Behavior Analytics
    • Root-Cause Analytics
    • Asia-Pacific Outlook (USD Billion, 2022-2032)

      • Asia-Pacific IT Operation Analytics Market by Technology
    • Visual Analytics
    • Machine-Based Learning
    • Predictive Analytics
    • User-Behavior Analytics
    • Root-Cause Analytics
      • China Outlook (USD Billion, 2022-2032)

      • China IT Operation Analytics Market by Technology
    • Visual Analytics
    • Machine-Based Learning
    • Predictive Analytics
    • User-Behavior Analytics
    • Root-Cause Analytics
      • Japan Outlook (USD Billion, 2022-2032)

      • Japan IT Operation Analytics Market by Technology
    • Visual Analytics
    • Machine-Based Learning
    • Predictive Analytics
    • User-Behavior Analytics
    • Root-Cause Analytics
      • India Outlook (USD Billion, 2022-2032)

      • India IT Operation Analytics Market by Technology
    • Visual Analytics
    • Machine-Based Learning
    • Predictive Analytics
    • User-Behavior Analytics
    • Root-Cause Analytics
      • Australia Outlook (USD Billion, 2022-2032)

      • Australia IT Operation Analytics Market by Technology
    • Visual Analytics
    • Machine-Based Learning
    • Predictive Analytics
    • User-Behavior Analytics
    • Root-Cause Analytics
      • Rest of Asia-Pacific Outlook (USD Billion, 2022-2032)

      • Rest of Asia-Pacific IT Operation Analytics Market by Technology
    • Visual Analytics
    • Machine-Based Learning
    • Predictive Analytics
    • User-Behavior Analytics
    • Root-Cause Analytics
    • Rest of the World Outlook (USD Billion, 2022-2032)

      • Rest of the World IT Operation Analytics Market by Technology
    • Visual Analytics
    • Machine-Based Learning
    • Predictive Analytics
    • User-Behavior Analytics
    • Root-Cause Analytics
      • Middle East Outlook (USD Billion, 2022-2032)

      • Middle East IT Operation Analytics Market by Technology
    • Visual Analytics
    • Machine-Based Learning
    • Predictive Analytics
    • User-Behavior Analytics
    • Root-Cause Analytics
      • Africa Outlook (USD Billion, 2022-2032)

      • Africa IT Operation Analytics Market by Technology
    • Visual Analytics
    • Machine-Based Learning
    • Predictive Analytics
    • User-Behavior Analytics
    • Root-Cause Analytics
      • Latin America Outlook (USD Billion, 2022-2032)

      • Latin America IT Operation Analytics Market by Technology
    • Visual Analytics
    • Machine-Based Learning
    • Predictive Analytics
    • User-Behavior Analytics
    • Root-Cause Analytics
    IT Operation Analytics Market Research Report – Forecast to 2032 Infographic
    Free Sample Request

    Kindly complete the form below to receive a free sample of this Report

    Customer Strories

    “I am very pleased with how market segments have been defined in a relevant way for my purposes (such as "Portable Freezers & refrigerators" and "last-mile"). In general the report is well structured. Thanks very much for your efforts.”

    Victoria Milne Founder
    Case Study

    Chemicals and Materials