Reverse Vending Machine Market Trends
Reverse Vending Machine Market research report information By Product Type (Metal recycling machine, Glass recycling machine, Plastic recycling machine, and Hybrid recycling machine), By Capacity, (Less than 300 bottles/Cans, 300 to 700 bottles/Cans, and More than 700 bottles/Cans), By Application, (Railway Station, Airports, Supermarkets, Tourist Places, Shopping Malls, and Others (Bus stand, ...

Market Summary
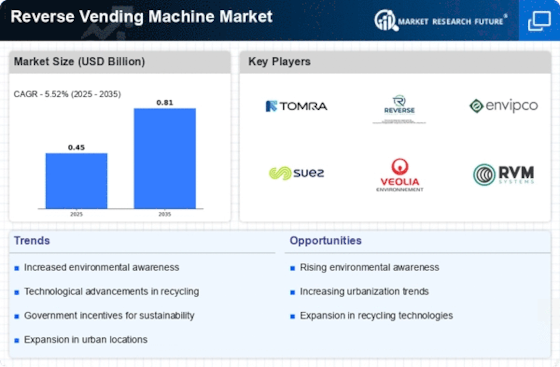
As per Market Research Future Analysis, the Global Reverse Vending Machine Market was valued at 0.45 USD Billion in 2024 and is projected to reach 0.81 USD Billion by 2035, growing at a CAGR of 5.52% from 2025 to 2035. The market growth is driven by increasing waste production and rising environmental awareness, particularly in the food and beverage sectors. The demand for reverse vending machines (RVMs) is expected to rise significantly due to the need for effective waste management and recycling solutions.
Key Market Trends & Highlights
Key trends driving the Reverse Vending Machine Market include technological advancements and regulatory support.
- Asia-Pacific held the largest market share of 33% in 2022. Plastic recycling machines dominated the market in 2022, contributing significantly to revenue. The railway station segment is expected to exhibit the highest CAGR during the forecast period. Over 20,000 RVMs are installed in the Netherlands, aiming for a 90% recycling rate by 2025.
Market Size & Forecast
2024 Market Size | USD 0.45 Billion |
2035 Market Size | USD 0.81 Billion |
CAGR (2025-2035) | 5.52% |
Major Players
<p>TOMRA System ASA, ACO Recycling, ENVIPCO, Veolia, RVM Systems, Endlos Sielaff GmbH, AKE Environmental, Incom Recycle Co., Ltd, Kansmacker Mfg.</p>
Market Trends
Increase in the amount of waste produced and rise in environmental awareness are driving the market growth.
The demand for reverse vending machines (RVMs) to collect and dispose of waste is expected to increase due to the expansion of the food and beverage industries around the world, which is anticipated to result in a rise in the amount of waste produced by the population. According to the World Economic Forum, 400 million tons of plastic garbage are created globally each year. In the United States, 40 million tons of plastic garbage were generated in 2021, with just 5.0% to 6.0%, or approximately two million tons, recycled.
In 2020, the total bottle recycling rate was 27.2%, down from 28.7% in 2019.
Every hour, approximately 2.5 million plastic bottles and 110 million glass bottles are discarded in the United States. Thus, demand for reverse vending machines to recycle several types of bottle waste is increasing throughout the region. Also, rising environmental awareness is driving the Vending Machine Market due to the increasing need for effective waste management and recycling. With the growing concern for environmental sustainability, many countries have implemented laws and regulations to promote the use of RVMs. The rise in urbanization and changing lifestyles have also contributed to the growth of the RVM market.
The market has also witnessed technological advancements, including the incorporation of IoT and artificial intelligence, leading to improved efficiency and convenience.
Further, rising environmental awareness is driving the Reverse vending machines Market for bottle recycling equipment due to the increasing need for effective waste management and recycling. RVMs are automated machines that collect, sort, and process used beverage containers, such as plastic bottles and aluminum cans, for recycling. The machines incentivize people to recycle by providing a deposit refund for each container deposited. This encourages individuals to recycle and reduces littering, thus helping to create a more sustainable environment. With the growing concern for environmental sustainability, many countries have implemented laws and regulations to promote the use of RVMs.
The rise in urbanization and changing lifestyles have also contributed to the growth of the RVM market, which is boosting the growth of the Reverse Vending Machine Market.
<p>The increasing emphasis on sustainable waste management practices is likely to drive the adoption of reverse vending machines as a pivotal component in enhancing recycling rates and promoting circular economy initiatives.</p>
U.S. Environmental Protection Agency
Reverse Vending Machine Market Market Drivers
Growing Environmental Awareness
The increasing global focus on sustainability and environmental conservation drives the Global Reverse Vending Machine Market Industry. As consumers become more conscious of their ecological footprint, the demand for solutions that promote recycling and waste reduction rises. Governments worldwide are implementing policies that encourage recycling, which further propels the adoption of reverse vending machines. For instance, in 2024, the market is projected to reach 0.45 USD Billion, reflecting a shift towards greener practices. This trend indicates a potential for growth as more municipalities and businesses invest in reverse vending technology to meet regulatory requirements and consumer expectations.
Market Segment Insights
Reverse vending machine market product types Insights
<p>The reverse vending machine market segmentation is bifurcated into Metal recycling machine, Glass recycling machine, Plastic recycling machine, and Hybrid recycling machine. The plastic recycling machine segment held the majority share in 2022 contributing to significant percentage respect to the Reverse vending machines Market for bottle recycling revenue. Metal recycling machines are expected to exhibit the highest CAGR during the forecast period. Plastic recycling machines are an effective way to incentivize recycling and reduce the amount of waste that ends up in landfills or the environment.</p>
<p>When it comes to plastics recycling in reverse vending machines (RVMs), the process is straightforward.</p>
<p>The user simply inserts their used plastic bottle into the machine, which then scans and verifies the material before accepting it. The machine then crushes the bottle and stores it for later transport to a recycling facility. The collected plastic is typically recycled into new products, such as packaging materials or textiles. Metal recycling through reverse vending machines is an innovative way to encourage recycling and reduce waste. These machines are designed bottles and used beverage containers, such as aluminum and other metal cans and bottles, and give users a refund in exchange for their recycling efforts.</p>
Reverse vending machine capacity Insights
<p>The reverse vending machine market segmentation, based on capacity, includes Less than 300 bottles/Cans, 300 to 700 bottles/Cans, and more than 700 bottles/Cans. The 300 to 700 bottles/Cans held the majority share in 2022 contributing 38% respect to the Smart Reverse Vending Machine Market revenue. More than 700 bottles/Cans segment is expected to exhibit the highest CAGR during the forecast period. A reverse recycling vending machine with a capacity of 300 to 700 bottles/cans is a type of recycling machine that accepts moderate amount empty beverage containers.</p>
<p>These machines use advanced technology to scan, sort, and compact empty containers, making them more efficient than traditional recycling methods. RVMs with a capacity of 300 to 700 bottles/cans are ideal for medium-sized businesses or public areas such as bus stands or transit stations, parks, and colleges. These machines are easy to use, with a simple touch screen interface that guides users through the recycling process.</p>
<p>A capacity of less than 300 bottles/cans is a smaller version of the standard machines that are used for recycling. These machines are ideal for locations where space is limited, and there is a lower volume of bottles/cans to be recycled. While these machines have a smaller capacity, they can still make a significant impact on reducing waste and promoting sustainability in smaller communities, such as in small offices, schools, cafes, or retail shops. A capacity of more than 700 bottles/cans is a large-capacity recycling machine designed to manage a high volume of beverage containers.</p>
Reverse vending machine application Insights
<p>The reverse vending machine market segmentation, based on application, includes railway stations, airports, supermarkets, tourist places, shopping malls and others. The tourist places held the majority share in 2022 of the <a href="https://www.marketresearchfuture.com/reports/smart-vending-machine-market-32574">Smart Vending Machine Market</a> revenue. The railway station’s segment is expected to exhibit the highest CAGR during the forecast period. Reverse recycling vending machines can be a useful addition to tourist places as they encourage visitors to dispose of their waste responsibly. RVMs operate by accepting used cans, bottles, or other recyclable materials and dispensing a reward.</p>
<p>In tourist places, RVMs can help reduce litter and promote a cleaner environment, as visitors are more likely to recycle when there are convenient and accessible options available.</p>
<p>Installing RVMs in railway stations could be a wonderful way to promote recycling and sustainability. Passengers can deposit empty beverage containers into the RVM and receive a reward in the form of cash or vouchers. The RVM can then sort and process the materials for recycling, reducing the amount of waste sent to landfills. This initiative can also help to keep railway stations cleaner and more organized by providing a designated place for passengers to dispose of their waste.</p>
Get more detailed insights about Reverse Vending Machine Market Research Report—Global Forecast till 2034
Regional Insights
By Region, the study segments the market into North America, Europe, Asia-Pacific, Middle East & Africa, and South America. Asia-Pacific accounted for the largest market share of 33% in 2022. It is expected to register significant growth during the forecast period. The Asia Pacific region is home to some of the world's largest and fastest-growing economies, including China, India, and Japan, and has a large and rapidly expanding consumer market. This presents a significant opportunity for RVM manufacturers and operators to tap into the growing demand for sustainable and environmentally friendly products and services.
China is expected to be the largest market for RVMs in the region, due to its large population and significant environmental challenges.
The European region is expected to witness the highest growth in the Reverse Vending Machine Market due to the increasing number of manufacturing industries. The RVM market in Europe is primarily driven by government initiatives and regulations aimed at reducing waste and promoting recycling. Several European countries have implemented deposit-return schemes, which require consumers to pay a deposit on beverage containers and receive a refund when they return them to RVMs. For example, Norway, Germany, and the Netherlands have successful deposit-return schemes.
In Netherlands, there are over 20,000 RVMs installed across the country, and the government aims to achieve a 90% recycling rate for plastic bottles by 2025.
Further, the Germany Reverse Vending Machine Market held a significant market share, and the UK Reverse Vending Machine Market was the fastest-growing market in the European region.
Figure 2: Reverse Vending Machine Market Share By Region 2022 & 2032
Source: Secondary Research, Primary Research, Market Research Future Database, and Analyst Review
Further, the major countries studied are US, Canada, Mexico France, Italy, Spain, Japan, India, Australia, South Korea, and Brazil.
Key Players and Competitive Insights
Major reverse vending machine companies are spending a lot of money on R&D to increase their product lines, which will help the Reverse Vending Machine Industry grow even more. Market participants are also expanding their global footprint through a variety of strategic activities such as new product releases, contractual agreements, mergers and acquisitions, higher investments, and collaboration with other companies. Reverse Vending Machine’ competitors must offer cost-effective things in order to flourish and thrive in an increasingly competitive and rising market climate.
One of the primary business strategies adopted by manufacturers in the Reverse Vending Machine industry to benefit clients and expand the Industrial Vending Machines sector is to manufacture locally to reduce operating costs.
Key Companies in the Reverse Vending Machine Market market include

Industry Developments
In August 2022, TOMRA M1, the smallest three-material reverse vending machine, was introduced by Tomra Systems ASA. TOMRA M1 requires only 0.62 square meters of floor space, allowing smaller stores to participate in deposit return schemes and recycle. This company is heavily focused on providing economical and tiny RVM that is appropriate for convenience/small retailers.
In November 2021, The G-1 Smart Reverse Vending Machine was introduced by Aco Recycling. This Al-powered machine can effortlessly recycle plastic, glass, and aluminum waste. It offers the user a remote monitoring solution.
In June 2021, EcoVend Reverse Vending installed its new RVM 400 reverse vending machines in one of Portugal's leading supermarkets. Plastic bottles are accepted by the RVM 400. In addition, on August 2021, the firm unveiled a new RVM 400 reverse vending machine with improved speech and touchless control features, as well as a huge advertising screen.
Future Outlook
Reverse Vending Machine Market Future Outlook
<p>The Reverse Vending Machine Market is projected to grow at a 5.52% CAGR from 2025 to 2035, driven by increasing environmental awareness and regulatory support.</p>
New opportunities lie in:
- <p>Develop advanced AI algorithms for improved sorting accuracy and efficiency. Expand partnerships with municipalities for widespread deployment in urban areas. Innovate user-friendly interfaces to enhance consumer engagement and recycling rates.</p>
<p>By 2035, the market is expected to achieve substantial growth, reflecting heightened sustainability efforts globally.</p>
Market Segmentation
Reverse Vending Machine Regional Outlook
- {""=>["US"
- "Canada"
- "Mexico"]}
- {""=>["UK "
- "Germany"
- "France"
- "Italy"
- "Spain"
- "Rest Of Europe"]}
- {""=>["China"
- "India"
- "Japan"
- "Australia"
- "South Korea"
- "Rest of Asia-Pacific"]}
- {""=>["Saudi Arabia"
- "South Africa"
- "UAE"
- "Rest of Middle East & Africa"]}
- {""=>["Brazil"
- "Argentina"
- "Rest of South America"]}
Reverse Vending Machine Market Capacity Outlook
- Less than 300 bottles/Cans
- 300 to 700 bottles/Cans
- More than 700 bottles/Cans
Reverse Vending Machine Market Application Outlook
- Railway Station
- Airports
- Supermarkets
- Tourist Places
- Shopping Malls
- Others (Bus stand
- Institutes
- Offices etc.)
Reverse Vending Machine Market Product Types Outlook
- Metal recycling machine
- Glass recycling machine
- Plastic recycling machine
- Hybrid recycling machine
Report Scope
Report Attribute/Metric | Details |
Market Size 2024 | 0.45 (USD Billion) |
Market Size 2025 | 0.47 (USD Billion) |
Market Size 2035 | 0.81 (USD Billion) |
Compound Annual Growth Rate (CAGR) | 5.52% (2025 - 2035) |
Report Coverage | Revenue Forecast, Competitive Landscape, Growth Factors, and Trends |
Base Year | 2024 |
Market Forecast Period | 2025 - 2035 |
Historical Data | 2019 - 2023 |
Report Coverage | Revenue Forecast, Market Competitive Landscape, Growth Factors, and Trends |
Segments Covered | Product Type, Capacity Type, Application Type and Region |
Geographies Covered | North America, Europe, Asia Pacific, and the Rest of the World |
Countries Covered | The US, Canada, German, France, UK, Italy, Spain, China, Japan, India, Australia, South Korea, and Brazil |
Key Companies Profiled | TOMRA System ASA, ACO Recycling, ENVIPCO, Veolia, RVM Systems, Endlos, Sielaff GmbH, AKE Environmental, Incom Recycle Co.,Ltd, Kansmacker Mfg, etc. |
Key Market Opportunities | RVMs industry grow by increasing need for effective waste management and recycling techniques. |
Key Market Dynamics | Increase in the amount of waste produced and rise in environmental awareness Rise in urbanization and changing lifestyles |
Market Highlights
Author
Latest Comments
This is a great article! Really helped me understand the topic better.
Thanks for sharing this. I’ve bookmarked it for later reference.
FAQs
How much is the Reverse Vending Machine Market?
The Reverse Vending Machine Market crossed a valuation of USD 0.45 billion in 2024.
How Big is the U.S Reverse Vending Machine Market?
The U.S Reverse Vending Machine Market was valued at USD 27 million in 2022.
What is the growth rate of the Reverse Vending Machine Market?
The global market is projected to grow at a CAGR of 5.52% during the forecast period, 2025-2034.
Which region held the largest market share in the Reverse Vending Machine Market?
The Asia-Pacific region held the largest market share in the Reverse Vending Machine Market.
Who are the key players in the Reverse Vending Machine Market?
Companies such as TOMRA System ASA, Aco Recycling, ENVIPCO, Veolia, and RVM Systems are the key players in the Reverse Vending Machine Market.
Which industry led the Reverse Vending Machine Market?
Tourism industry is the major type that led the Reverse Vending Machine Market.
-
--- 'Table of Contents
-
Executive Summary
-
MARKET ATTRACTIVENESS ANALYSIS
- REVERSE VENDING MACHINE MARKET, BY PRODUCT TYPE
- REVERSE VENDING MACHINE MARKET, BY CAPACITY
- REVERSE VENDING MACHINE MARKET, BY APPLICATION
- REVERSE VENDING MACHINE MARKET, BY REGION
-
MARKET ATTRACTIVENESS ANALYSIS
-
Market Introduction
- DEFINITION
- Scope of the Study
- RESEARCH OBJECTIVE
- MARKET STRUCTURE
-
Research Methodology
- RESEARCH PROCESS
- PRIMARY RESEARCH
- SECONDARY RESEARCH
- MARKET SIZE ESTIMATION
- FORECAST MODEL
- LIST OF ASSUMPTIONS
-
MARKET DYNAMICS
- INTRODUCTION
-
MARKET DRIVERS
- INCREASE IN THE AMOUNT OF WASTE PRODUCED
- RISE IN ENVIRONMENTAL AWARENESS
-
MARKET RESTRAINTS
- HIGH COST OF REVERSE VENDING MACHINE
-
MARKET OPPORTUNITIES
- TECHNOLOGICAL ADVANCEMENT IN REVERSE VENDING MACHINE
-
IMPACT OF COVID-19
- IMPACT OF COVID-19 ON THE GLOBAL ECONOMY
- IMPACT OF COVID-19 ON THE REVERSE VENDING MACHINE MARKET
- SUPPLY CHAIN IMPACT
- MARKET RECOVERY ANALYSIS
-
MARKET FACTORS
-
SUPPLY CHAIN ANALYSIS
- DESIGN & DEVELOPMENT
- PROCUREMENT OF RAW MATERIALS
- MANUFACTURING
- SALES & DISTRIBUTION
- POST-SALES SERVICES
-
PORTER’S FIVE FORCES MODEL
- THREAT OF NEW ENTRANTS
- BARGAINING POWER OF SUPPLIERS
- THREAT OF SUBSTITUTES
- BARGAINING POWER OF BUYERS
- INTENSITY OF RIVALRY
-
SUPPLY CHAIN ANALYSIS
-
REVERSE VENDING MACHINE MARKET, BY PRODUCT TYPE
- OVERVIEW
- METAL RECYCLING MACHINE
- GLASS RECYCLING MACHINE
- PLASTIC RECYCLING MACHINE
- HYBRID RECYCLING MACHINE
- REVERSE VENDING MACHINE MARKET, BY PRODUCT TYPE, 2018–2032 (USD BILLION)
-
REVERSE VENDING MACHINE MARKET, BY CAPACITY
- OVERVIEW
- LESS THAN 300 BOTTLES/CANS
- 300 TO 700 BOTTLES/CANS
- MORE THAN 700 BOTTLES/CANS
- REVERSE VENDING MACHINE MARKET, BY CAPACITY, 2018–2032 (USD BILLION)
-
REVERSE VENDING MACHINE MARKET, BY APPLICATION
- OVERVIEW
- RAILWAY STATION
- AIRPORTS
- SUPERMARKETS
- TOURIST PLACES
- SHOPPING MALLS
- OTHERS (BUS STAND, INSTITUTES, OFFICES ETC.)
- REVERSE VENDING MACHINE MARKET, BY APPLICATION, 2018–2032 (USD BILLION)
-
REVERSE VENDING MACHINE MARKET, BY REGION
- OVERVIEW
-
NORTH AMERICA
- NORTH AMERICA: REVERSE VENDING MACHINE MARKET, BY COUNTRY, 2018–2032 (USD BILLION)
- NORTH AMERICA: REVERSE VENDING MACHINE MARKET, BY PRODUCT TYPE, 2018–2032 (USD BILLION)
- NORTH AMERICA: REVERSE VENDING MACHINE MARKET, BY CAPACITY, 2018–2032 (USD BILLION)
- NORTH AMERICA: REVERSE VENDING MACHINE MARKET, BY APPLICATION, 2018–2032 (USD BILLION)
- US
- CANADA
- MEXICO
-
EUROPE
- EUROPE: REVERSE VENDING MACHINE MARKET, BY COUNTRY, 2018–2032 (USD BILLION)
- EUROPE: REVERSE VENDING MACHINE MARKET, BY PRODUCT TYPE, 2018–2032 (USD BILLION)
- EUROPE: REVERSE VENDING MACHINE MARKET, BY CAPACITY, 2018–2032 (USD BILLION)
- EUROPE: REVERSE VENDING MACHINE MARKET, BY APPLICATION, 2018–2032 (USD BILLION
- UK
- GERMANY
- FRANCE
- ITALY
- SPAIN
- REST OF EUROPE
-
ASIA PACIFIC
- ASIA PACIFIC: REVERSE VENDING MACHINE MARKET, BY COUNTRY, 2018–2032 (USD BILLION)
- ASIA PACIFIC: REVERSE VENDING MACHINE MARKET, BY PRODUCT TYPE, 2018–2032 (USD BILLION)
- ASIA PACIFIC: REVERSE VENDING MACHINE MARKET, BY CAPACITY, 2018–2032 (USD BILLION)
- ASIA PACIFIC: REVERSE VENDING MACHINE MARKET, BY APPLICATION, 2018–2032 (USD BILLION)
- CHINA
- INDIA
- JAPAN
- AUSTRALIA
- SOUTH KOREA
- REST OF ASIA PACIFIC
-
MIDDLE EAST & AFRICA
- MIDDLE EAST & AFRICA: REVERSE VENDING MACHINE MARKET, BY REGION, 2018–2032 (USD BILLION)
- MIDDLE EAST & AFRICA: REVERSE VENDING MACHINE MARKET, BY PRODUCT TYPE, 2018–2032 (USD BILLION)
- MIDDLE EAST & AFRICA: REVERSE VENDING MACHINE MARKET, BY CAPACITY, 2018–2032 (USD BILLION)
- MIDDLE EAST & AFRICA: REVERSE VENDING MACHINE MARKET, BY APPLICATION, 2018–2032 (USD BILLION)
- SAUDI ARABIA
- SOUTH AFRICA
- UAE
- REST OF MIDDLE EAST & AFRICA
- REST OF MIDDLE EAST & AFRICA: REVERSE VENDING MACHINE MARKET, BY PRODUCT TYPE, 2018–2032 (USD BILLION)
- REST OF MIDDLE EAST & AFRICA: REVERSE VENDING MACHINE MARKET, BY CAPACITY, 2018–2032 (USD BILLION)
- REST OF MIDDLE EAST & AFRICA: REVERSE VENDING MACHINE MARKET, BY APPLICATION, 2018–2032 (USD BILLION)
-
SOUTH AMERICA
- SOUTH AMERICA: REVERSE VENDING MACHINE MARKET, BY REGION, 2018–2032 (USD BILLION)
- SOUTH AMERICA: REVERSE VENDING MACHINE MARKET, BY PRODUCT TYPE, 2018–2032 (USD BILLION)
- SOUTH AMERICA: REVERSE VENDING MACHINE MARKET, BY CAPACITY, 2018–2032 (USD BILLION)
- SOUTH AMERICA: REVERSE VENDING MACHINE MARKET, BY APPLICATION, 2018–2032 (USD BILLION)
- BRAZIL
- ARGENTINA
- REST OF SOUTH AMERICA
- REST OF SOUTH AMERICA: REVERSE VENDING MACHINE MARKET, BY PRODUCT TYPE, 2018–2032 (USD BILLION)
- REST OF SOUTH AMERICA: REVERSE VENDING MACHINE MARKET, BY CAPACITY, 2018–2032 (USD BILLION)
- REST OF SOUTH AMERICA: REVERSE VENDING MACHINE MARKET, BY APPLICATION, 2018–2032 (USD BILLION)
-
Competitive LandscapeS
- COMPETITIVE OVERVIEW
- MARKET SHARE ANALYSIS
- MAJOR GROWTH STRATEGIES IN THE REVERSE VENDING MACHINE MARKET
- LEADING PLAYERS IN TERMS OF NUMBER OF DEVELOPMENTS IN THE REVERSE VENDING MACHINE MARKET
-
KEY DEVELOPMENTS & GROWTH STRATEGIES
- CONTRACTS & AGREEMENTS
-
KEY DEVELOPMENTS & GROWTH STRATEGIES
- PRODUCT LAUNCHES/ DEVELOPMENTS
- COLLABORATIONS/FUNDING/PARTNERSHIPS/ACQUISITION
-
COMPANY PROFILES
-
TOMRA SYSTEM ASA
- COMPANY OVERVIEW
- FINANCIAL OVERVIEW
- PRODUCTS/SERVICES OFFERED
- KEY DEVELOPMENTS
- SWOT ANALYSIS
- KEY STRATEGIES
-
ACO RECYCLING
- COMPANY OVERVIEW
- FINANCIAL OVERVIEW
- PRODUCTS/SERVICES OFFERED
- KEY DEVELOPMENTS
- SWOT ANALYSIS
- KEY STRATEGIES
-
ENVIPCO
- COMPANY OVERVIEW
- FINANCIAL OVERVIEW
- PRODUCTS/SERVICES OFFERED
- KEY DEVELOPMENTS
- SWOT ANALYSIS
- KEY STRATEGIES
-
VEOLIA
- COMPANY OVERVIEW
- FINANCIAL OVERVIEW
- PRODUCTS/SERVICES OFFERED
- KEY DEVELOPMENTS
- SWOT ANALYSIS
- KEY STRATEGIES
-
RVM SYSTEMS.
- COMPANY OVERVIEW
- FINANCIAL OVERVIEW
- PRODUCTS/SERVICES OFFERED
- KEY DEVELOPMENTS
- SWOT ANALYSIS
- KEY STRATEGIES
-
ENDLOS
- COMPANY OVERVIEW
- FINANCIAL OVERVIEW
- PRODUCTS/SERVICES OFFERED
- KEY DEVELOPMENTS
- SWOT ANALYSIS
- KEY STRATEGIES
-
SIELAFF GMBH
- COMPANY OVERVIEW
- FINANCIAL OVERVIEW
- PRODUCTS/SERVICES OFFERED
- KEY DEVELOPMENTS
- SWOT ANALYSIS
- KEY STRATEGIES
-
AKE ENVIRONMENTAL
- COMPANY OVERVIEW
- FINANCIAL OVERVIEW
- PRODUCTS/SERVICES OFFERED
- KEY DEVELOPMENTS
- SWOT ANALYSIS
- KEY STRATEGIES
-
INCOM RECYCLE CO., LTD
- COMPANY OVERVIEW
- FINANCIAL OVERVIEW
- PRODUCTS/SERVICES OFFERED
- KEY DEVELOPMENTS
- SWOT ANALYSIS
- KEY STRATEGIES
-
KANSMACKER MFG
- COMPANY OVERVIEW
- FINANCIAL OVERVIEW
- PRODUCTS/SERVICES OFFERED
- KEY DEVELOPMENTS
- SWOT ANALYSIS
- KEY STRATEGIES
-
TOMRA SYSTEM ASA
-
APPENDICES
- REFERENCES
- LIST OF ABBREVIATION
-
-
List of Tables and Figures
- LIST OF TABLES
- TABLE 1 LIST OF ASSUMPTIONS
- TABLE 2 REVERSE VENDING MACHINE MARKET, BY PRODUCT TYPE, 2018–2032 (USD BILLION)
- TABLE 3 REVERSE VENDING MACHINE MARKET, BY CAPACITY, 2018–2032 (USD BILLION)
- TABLE 4 REVERSE VENDING MACHINE MARKET, BY APPLICATION, 2018–2032 (USD BILLION)
- TABLE 5 REVERSE VENDING MACHINE MARKET, BY REGION, 2018–2032 (USD BILLION)
- TABLE 6 NORTH AMERICA: REVERSE VENDING MACHINE MARKET, BY COUNTRY, 2018–2032 (USD BILLION)
- TABLE 7 NORTH AMERICA: REVERSE VENDING MACHINE MARKET, BY PRODUCT TYPE, 2018–2032 (USD BILLION)
- TABLE 8 NORTH AMERICA: REVERSE VENDING MACHINE MARKET, BY CAPACITY, 2018–2032 (USD BILLION)
- TABLE 9 NORTH AMERICA: REVERSE VENDING MACHINE MARKET, BY APPLICATION, 2018–2032 (USD BILLION)
- TABLE 10 US: REVERSE VENDING MACHINE MARKET, BY PRODUCT TYPE, 2018–2032 (USD BILLION)
- TABLE 11 US: REVERSE VENDING MACHINE MARKET, BY CAPACITY, 2018–2032 (USD BILLION)
- TABLE 12 US: REVERSE VENDING MACHINE MARKET, BY APPLICATION, 2018–2032 (USD BILLION)
- TABLE 13 CANADA: REVERSE VENDING MACHINE MARKET, BY PRODUCT TYPE, 2018–2032 (USD BILLION)
- TABLE 14 CANADA: REVERSE VENDING MACHINE MARKET, BY CAPACITY, 2018–2032 (USD BILLION)
- TABLE 15 CANADA: REVERSE VENDING MACHINE MARKET, BY APPLICATION, 2018–2032 (USD BILLION
- TABLE 16 MEXICO: REVERSE VENDING MACHINE MARKET, BY PRODUCT TYPE, 2018–2032 (USD BILLION)
- TABLE 17 MEXICO: REVERSE VENDING MACHINE MARKET, BY CAPACITY, 2018–2032 (USD BILLION)
- TABLE 18 MEXICO: REVERSE VENDING MACHINE MARKET, BY APPLICATION, 2018–2032 (USD BILLION)
- TABLE 19 EUROPE: REVERSE VENDING MACHINE MARKET, BY COUNTRY, 2018–2032 (USD BILLION)
- TABLE 20 EUROPE: REVERSE VENDING MACHINE MARKET, BY PRODUCT TYPE, 2018–2032 (USD BILLION)
- TABLE 21 EUROPE: REVERSE VENDING MACHINE MARKET, BY CAPACITY, 2018–2032 (USD BILLION)
- TABLE 22 EUROPE: REVERSE VENDING MACHINE MARKET, BY APPLICATION, 2018–2032 (USD BILLION)
- TABLE 23 UK: REVERSE VENDING MACHINE MARKET, BY PRODUCT TYPE, 2018–2032 (USD BILLION)
- TABLE 24 UK: REVERSE VENDING MACHINE MARKET, BY CAPACITY, 2018–2032 (USD BILLION)
- TABLE 25 UK: REVERSE VENDING MACHINE MARKET, BY APPLICATION, 2018–2032 (USD BILLION)
- TABLE 26 GERMANY: REVERSE VENDING MACHINE MARKET, BY PRODUCT TYPE, 2018–2032 (USD BILLION)
- TABLE 27 GERMANY: REVERSE VENDING MACHINE MARKET, BY CAPACITY, 2018–2032 (USD BILLION)
- TABLE 28 GERMANY: REVERSE VENDING MACHINE MARKET, BY APPLICATION, 2018–2032 (USD BILLION)
- TABLE 29 FRANCE: REVERSE VENDING MACHINE MARKET, BY PRODUCT TYPE, 2018–2032 (USD BILLION)
- TABLE 30 FRANCE: REVERSE VENDING MACHINE MARKET, BY CAPACITY, 2018–2032 (USD BILLION)
- TABLE 31 FRANCE: REVERSE VENDING MACHINE MARKET, BY APPLICATION, 2018–2032 (USD BILLION)
- TABLE 32 ITALY: REVERSE VENDING MACHINE MARKET, BY PRODUCT TYPE, 2018–2032 (USD BILLION)
- TABLE 33 ITALY: REVERSE VENDING MACHINE MARKET, BY CAPACITY, 2018–2032 (USD BILLION)
- TABLE 34 ITALY: REVERSE VENDING MACHINE MARKET, BY APPLICATION, 2018–2032 (USD BILLION)
- TABLE 35 SPAIN: REVERSE VENDING MACHINE MARKET, BY PRODUCT TYPE, 2018–2032 (USD BILLION)
- TABLE 36 SPAIN: REVERSE VENDING MACHINE MARKET, BY CAPACITY, 2018–2032 (USD BILLION)
- TABLE 37 SPAIN: REVERSE VENDING MACHINE MARKET, BY APPLICATION, 2018–2032 (USD BILLION)
- TABLE 38 REST OF EUROPE: REVERSE VENDING MACHINE MARKET, BY PRODUCT TYPE, 2018–2032 (USD BILLION)
- TABLE 39 REST OF EUROPE: REVERSE VENDING MACHINE MARKET, BY CAPACITY, 2018–2032 (USD BILLION)
- TABLE 40 REST OF EUROPE: REVERSE VENDING MACHINE MARKET, BY APPLICATION, 2018–2032 (USD BILLION)
- TABLE 41 ASIA PACIFIC: REVERSE VENDING MACHINE MARKET, BY COUNTRY, 2018–2032 (USD BILLION)
- TABLE 42 ASIA PACIFIC: REVERSE VENDING MACHINE MARKET, BY PRODUCT TYPE, 2018–2032 (USD BILLION)
- TABLE 43 ASIA PACIFIC: REVERSE VENDING MACHINE MARKET, BY CAPACITY, 2018–2032 (USD BILLION)
- TABLE 44 ASIA PACIFIC: REVERSE VENDING MACHINE MARKET, BY APPLICATION, 2018–2032 (USD BILLION)
- TABLE 45 CHINA: REVERSE VENDING MACHINE MARKET, BY PRODUCT TYPE, 2018–2032 (USD BILLION)
- TABLE 46 CHINA: REVERSE VENDING MACHINE MARKET, BY CAPACITY, 2018–2032 (USD BILLION)
- TABLE 47 CHINA: REVERSE VENDING MACHINE MARKET, BY APPLICATION, 2018–2032 (USD BILLION)
- TABLE 48 INDIA: REVERSE VENDING MACHINE MARKET, BY PRODUCT TYPE, 2018–2032 (USD BILLION)
- TABLE 49 INDIA: REVERSE VENDING MACHINE MARKET, BY CAPACITY, 2018–2032 (USD BILLION)
- TABLE 50 INDIA: REVERSE VENDING MACHINE MARKET, BY APPLICATION, 2018–2032 (USD BILLION)
- TABLE 51 JAPAN: REVERSE VENDING MACHINE MARKET, BY PRODUCT TYPE, 2018–2032 (USD BILLION)
- TABLE 52 JAPAN: REVERSE VENDING MACHINE MARKET, BY CAPACITY, 2018–2032 (USD BILLION)
- TABLE 53 JAPAN: REVERSE VENDING MACHINE MARKET, BY APPLICATION, 2018–2032 (USD BILLION)
- TABLE 54 AUSTRALIA: REVERSE VENDING MACHINE MARKET, BY PRODUCT TYPE, 2018–2032 (USD BILLION)
- TABLE 55 AUSTRALIA: REVERSE VENDING MACHINE MARKET, BY CAPACITY, 2018–2032 (USD BILLION)
- TABLE 56 AUSTRALIA: REVERSE VENDING MACHINE MARKET, BY APPLICATION, 2018–2032 (USD BILLION)
- TABLE 57 SOUTH KOREA: REVERSE VENDING MACHINE MARKET, BY PRODUCT TYPE, 2018–2032 (USD BILLION)
- TABLE 58 SOUTH KOREA: REVERSE VENDING MACHINE MARKET, BY CAPACITY, 2018–2032 (USD BILLION)
- TABLE 59 SOUTH KOREA: REVERSE VENDING MACHINE MARKET, BY APPLICATION, 2018–2032 (USD BILLION)
- TABLE 60 REST OF ASIA-PACIFIC: REVERSE VENDING MACHINE MARKET, BY PRODUCT TYPE, 2018–2032 (USD BILLION)
- TABLE 61 REST OF ASIA-PACIFIC: REVERSE VENDING MACHINE MARKET, BY CAPACITY, 2018–2032 (USD BILLION)
- TABLE 62 REST OF ASIA-PACIFIC: REVERSE VENDING MACHINE MARKET, BY APPLICATION, 2018–2032 (USD BILLION)
- TABLE 63 MIDDLE EAST & AFRICA: REVERSE VENDING MACHINE MARKET, BY REGION, 2018–2032 (USD BILLION)
- TABLE 64 MIDDLE EAST & AFRICA: REVERSE VENDING MACHINE MARKET, BY PRODUCT TYPE, 2018–2032 (USD BILLION)
- TABLE 65 MIDDLE EAST & AFRICA: REVERSE VENDING MACHINE MARKET, BY CAPACITY, 2018–2032 (USD BILLION)
- TABLE 66 MIDDLE EAST & AFRICA: REVERSE VENDING MACHINE MARKET, BY APPLICATION, 2018–2032 (USD BILLION)
- TABLE 67 SAUDI ARABIA: REVERSE VENDING MACHINE MARKET, BY PRODUCT TYPE, 2018–2032 (USD BILLION)
- TABLE 68 SAUDI ARABIA: REVERSE VENDING MACHINE MARKET, BY CAPACITY, 2018–2032 (USD BILLION)
- TABLE 69 SAUDI ARABIA: REVERSE VENDING MACHINE MARKET, BY APPLICATION, 2018–2032 (USD BILLION)
- TABLE 70 SOUTH AFRICA: REVERSE VENDING MACHINE MARKET, BY PRODUCT TYPE, 2018–2032 (USD BILLION)
- TABLE 71 SOUTH AFRICA: REVERSE VENDING MACHINE MARKET, BY CAPACITY, 2018–2032 (USD BILLION)
- TABLE 72 SOUTH AFRICA: REVERSE VENDING MACHINE MARKET, BY APPLICATION, 2018–2032 (USD BILLION)
- TABLE 73 UAE: REVERSE VENDING MACHINE MARKET, BY PRODUCT TYPE, 2018–2032 (USD BILLION)
- TABLE 74 UAE: REVERSE VENDING MACHINE MARKET, BY CAPACITY, 2018–2032 (USD BILLION)
- TABLE 75 UAE: REVERSE VENDING MACHINE MARKET, BY APPLICATION, 2018–2032 (USD BILLION)
- TABLE 76 REST OF MIDDLE EAST & AFRICA: REVERSE VENDING MACHINE MARKET, BY PRODUCT TYPE, 2018–2032 (USD BILLION)
- TABLE 77 REST OF MIDDLE EAST & AFRICA: REVERSE VENDING MACHINE MARKET, BY CAPACITY, 2018–2032 (USD BILLION)
- TABLE 78 REST OF MIDDLE EAST & AFRICA: REVERSE VENDING MACHINE MARKET, BY APPLICATION, 2018–2032 (USD BILLION)
- TABLE 79 SOUTH AMERICA: REVERSE VENDING MACHINE MARKET, BY REGION, 2018–2032 (USD BILLION)
- TABLE 80 SOUTH AMERICA: REVERSE VENDING MACHINE MARKET, BY PRODUCT TYPE, 2018–2032 (USD BILLION)
- TABLE 81 SOUTH AMERICA: REVERSE VENDING MACHINE MARKET, BY CAPACITY, 2018–2032 (USD BILLION)
- TABLE 82 SOUTH AMERICA: REVERSE VENDING MACHINE MARKET, BY APPLICATION, 2018–2032 (USD BILLION)
- TABLE 83 BRAZIL: REVERSE VENDING MACHINE MARKET, BY PRODUCT TYPE, 2018–2032 (USD BILLION)
- TABLE 84 BRAZIL: REVERSE VENDING MACHINE MARKET, BY CAPACITY, 2018–2032 (USD BILLION)
- TABLE 85 BRAZIL: REVERSE VENDING MACHINE MARKET, BY APPLICATION, 2018–2032 (USD BILLION)
- TABLE 86 ARGENTINA: REVERSE VENDING MACHINE MARKET, BY PRODUCT TYPE, 2018–2032 (USD BILLION)
- TABLE 87 ARGENTINA: REVERSE VENDING MACHINE MARKET, BY CAPACITY, 2018–2032 (USD BILLION)
- TABLE 88 ARGENTINA: REVERSE VENDING MACHINE MARKET, BY APPLICATION, 2018–2032 (USD BILLION)
- TABLE 89 REST OF SOUTH AMERICA: REVERSE VENDING MACHINE MARKET, BY PRODUCT TYPE, 2018–2032 (USD BILLION)
- TABLE 90 REST OF SOUTH AMERICA: REVERSE VENDING MACHINE MARKET, BY CAPACITY, 2018–2032 (USD BILLION)
- TABLE 91 REST OF SOUTH AMERICA: REVERSE VENDING MACHINE MARKET, BY APPLICATION, 2018–2032 (USD BILLION)
- TABLE 92 THE MOST ACTIVE PLAYERS IN THE REVERSE VENDING MACHINE MARKET
- TABLE 93 CONTRACTS & AGREEMENTS
- TABLE 94 PRODUCT LAUNCHES/ DEVELOPMENTS
- TABLE 95 COLLABORATIONS/FUNDING/PARTNERSHIPS/ACQUISITION
- TABLE 96 TOMRA SYSTEM ASA: PRODUCTS/SERVICES OFFERED
- TABLE 97 TOMRA SYSTEM ASA: KEY DEVELOPMENTS
- TABLE 98 ACO RECYCLING: PRODUCTS/SERVICES OFFERED
- TABLE 99 ACO RECYCLING: KEY DEVELOPMENTS
- TABLE 100 ENVIPCO: PRODUCTS/SERVICES OFFERED
- TABLE 101 ENVIPCO: KEY DEVELOPMENTS
- TABLE 102 VEOLIA: PRODUCTS/SERVICES OFFERED
- TABLE 103 VEOLIA: KEY DEVELOPMENTS
- TABLE 104 RVM SYSTEMS.: PRODUCTS/SERVICES OFFERED
- TABLE 105 RVM SYSTEMS.: KEY DEVELOPMENTS
- TABLE 106 ENDLOS: PRODUCTS/SERVICES OFFERED
- TABLE 107 ENDLOS: PRODUCTS/SERVICES OFFERED
- TABLE 108 SIELAFF GMBH: PRODUCTS/SERVICES OFFERED
- TABLE 109 SIELAFF GMBH: KEY DEVELOPMENTS
- TABLE 110 AKE ENVIRONMENTAL: PRODUCTS/SERVICES OFFERED
- TABLE 111 AKE ENVIRONMENTAL: PRODUCTS/SERVICES OFFERED
- TABLE 112 INCOM RECYCLE CO., LTD: PRODUCTS/SERVICES OFFERED
- TABLE 113 INCOM RECYCLE CO., LTD: PRODUCTS/SERVICES OFFERED
- TABLE 114 KANSMACKER MFG: PRODUCTS/SERVICES OFFERED
- TABLE 115 KANSMACKER MFG: PRODUCTS/SERVICES OFFERED LIST OF FIGURES
- FIGURE 1 MARKET SYNOPSIS
- FIGURE 2 MARKET ATTRACTIVENESS ANALYSIS: REVERSE VENDING MACHINE MARKET
- FIGURE 3 REVERSE VENDING MACHINE MARKET ANALYSIS, BY PRODUCT TYPE
- FIGURE 4 REVERSE VENDING MACHINE MARKET ANALYSIS, BY CAPACITY
- FIGURE 5 REVERSE VENDING MACHINE MARKET ANALYSIS, BY APPLICATION
- FIGURE 6 REVERSE VENDING MACHINE MARKET ANALYSIS, BY REGION
- FIGURE 7 REVERSE VENDING MACHINE MARKET: STRUCTURE
- FIGURE 8 RESEARCH PROCESS
- FIGURE 9 TOP-DOWN AND Bottom-up ApproachES
- FIGURE 10 MARKET DYNAMICS: REVERSE VENDING MACHINE MARKET
- FIGURE 11 DRIVERS: IMPACT ANALYSIS
- FIGURE 12 RESTRAINT: IMPACT ANALYSIS
- FIGURE 13 SUPPLY CHAIN ANALYSIS: REVERSE VENDING MACHINE MARKET
- FIGURE 14 PORTER''S FIVE FORCES ANALYSIS: REVERSE VENDING MACHINE MARKET
- FIGURE 15 REVERSE VENDING MACHINE MARKET, BY PRODUCT TYPE, 2022 (% SHARE)
- FIGURE 16 REVERSE VENDING MACHINE MARKET, BY CAPACITY, 2022 (% SHARE)
- FIGURE 17 REVERSE VENDING MACHINE MARKET, BY APPLICATION, 2022 (% SHARE)
- FIGURE 18 REVERSE VENDING MACHINE MARKET SHARE, BY REGION, 2022 (% SHARE)
- FIGURE 19 NORTH AMERICA: REVERSE VENDING MACHINE MARKET SHARE, BY COUNTRY, 2022 (% SHARE)
- FIGURE 20 EUROPE: REVERSE VENDING MACHINE MARKET SHARE, BY COUNTRY, 2022 (% SHARE)
- FIGURE 21 ASIA PACIFIC: REVERSE VENDING MACHINE MARKET SHARE, BY COUNTRY, 2022 (% SHARE)
- FIGURE 22 MIDDLE EAST & AFRICA: REVERSE VENDING MACHINE MARKET SHARE, BY COUNTRY, 2022 (% SHARE)
- FIGURE 23 SOUTH AMERICA: REVERSE VENDING MACHINE MARKET SHARE, BY COUNTRY, 2022 (% SHARE)
- FIGURE 24 MAJOR MANUFACTURERS MARKET SHARE ANALYSIS, 2022
- FIGURE 25 CONTRACTS & AGREEMENTS: THE MAJOR STRATEGY ADOPTED BY KEY PLAYERS IN THE REVERSE VENDING MACHINE MARKET
- FIGURE 26 TOMRA SYSTEM ASA: FINANCIAL OVERVIEW SNAPSHOT
- FIGURE 27 TOMRA SYSTEM ASA: SWOT ANALYSIS
- FIGURE 28 ACO RECYCLING: FINANCIAL OVERVIEW SNAPSHOT
- FIGURE 29 ACO RECYCLING: SWOT ANALYSIS
- FIGURE 30 ENVIPCO: FINANCIAL OVERVIEW SNAPSHOT
- FIGURE 31 ENVIPCO: SWOT ANALYSIS
- FIGURE 32 VEOLIA: FINANCIAL OVERVIEW SNAPSHOT
- FIGURE 33 VEOLIA: SWOT ANALYSIS
- FIGURE 34 RVM SYSTEMS.: FINANCIAL OVERVIEW SNAPSHOT
- FIGURE 35 RVM SYSTEMS.: SWOT ANALYSIS
- FIGURE 36 ENDLOS: FINANCIAL OVERVIEW SNAPSHOT
- FIGURE 37 ENDLOS: SWOT ANALYSIS
- FIGURE 38 SIELAFF GMBH: FINANCIAL OVERVIEW SNAPSHOT
- FIGURE 39 SIELAFF GMBH: SWOT ANALYSIS
- FIGURE 40 AKE ENVIRONMENTAL: FINANCIAL OVERVIEW SNAPSHOT
- FIGURE 41 AKE ENVIRONMENTAL: SWOT ANALYSIS
- FIGURE 42 INCOM RECYCLE CO., LTD: FINANCIAL OVERVIEW SNAPSHOT
- FIGURE 43 INCOM RECYCLE CO., LTD: SWOT ANALYSIS
- FIGURE 44 KANSMACKER MFG: FINANCIAL OVERVIEW SNAPSHOT
- FIGURE 45 KANSMACKER MFG: SWOT ANALYSIS'
Reverse Vending Machine Market Segmentation
Reverse Vending Machine Market by Product Type Outlook (USD Billion, 2018-2032)
- Metal recycling machine
- Glass recycling machine
- Plastic recycling machine
- Hybrid recycling machine
Reverse Vending Machine Market by Capacity Outlook (USD Billion, 2018-2032)
- Less than 300 bottles/Cans
- 300 to 700 bottles/Cans
- More than 700 bottles/Cans
Reverse Vending Machine Market by Application Outlook (USD Billion, 2018-2032)
- Railway Station
- Airports
- Supermarkets
- Tourist Places
- Shopping Malls
- Others (Bus stand, Institutes, Offices etc.)
Reverse Vending Machine Market Regional Outlook (USD Billion, 2018-2032)
- North America Outlook (USD Billion, 2018-2032)
- North America Reverse Vending Machine Market by Product type
- Metal recycling machine
- Glass recycling machine
- Plastic recycling machine
- Hybrid recycling machine
- North America Reverse Vending Machine Market by Capacity
- Less than 300 bottles/Cans
- 300 to 700 bottles/Cans
- More than 700 bottles/Cans
- North America Reverse Vending Machine Market by Application
- Railway Station
- Airports
- Supermarkets
- Tourist Places
- Shopping Malls
- Others (Bus stand, Institutes, Offices etc.)
- US Outlook (USD Billion, 2018-2032)
- US Reverse Vending Machine Market by Product type
- Metal recycling machine
- Glass recycling machine
- Plastic recycling machine
- Hybrid recycling machine
- US Reverse Vending Machine Market by Capacity
- Less than 300 bottles/Cans
- 300 to 700 bottles/Cans
- More than 700 bottles/Cans
- US Reverse Vending Machine Market by Application
- Railway Station
- Airports
- Supermarkets
- Tourist Places
- Shopping Malls
- Others (Bus stand, Institutes, Offices etc.)
- Canada Outlook (USD Billion, 2018-2032)
- Canada Reverse Vending Machine Market by Product type
- Metal recycling machine
- Glass recycling machine
- Plastic recycling machine
- Hybrid recycling machine
- Canada Reverse Vending Machine Market by Capacity
- Less than 300 bottles/Cans
- 300 to 700 bottles/Cans
- More than 700 bottles/Cans
- Canada Reverse Vending Machine Market by Application
- Railway Station
- Airports
- Supermarkets
- Tourist Places
- Shopping Malls
- Others (Bus stand, Institutes, Offices etc.)
- Mexico Outlook (USD Billion, 2018-2032)
- Mexico Reverse Vending Machine Market by Product type
- Metal recycling machine
- Glass recycling machine
- Plastic recycling machine
- Hybrid recycling machine
- Mexico Reverse Vending Machine Market by Capacity
- Less than 300 bottles/Cans
- 300 to 700 bottles/Cans
- More than 700 bottles/Cans
- Mexico Reverse Vending Machine Market by Application
- Railway Station
- Airports
- Supermarkets
- Tourist Places
- Shopping Malls
- Others (Bus stand, Institutes, Offices etc.)
- Europe Outlook (USD Billion, 2018-2032)
- Europe Reverse Vending Machine Market by Product type
- Metal recycling machine
- Glass recycling machine
- Plastic recycling machine
- Hybrid recycling machine
- Europe Reverse Vending Machine Market by Capacity
- Less than 300 bottles/Cans
- 300 to 700 bottles/Cans
- More than 700 bottles/Cans
- Europe Reverse Vending Machine Market by Application
- Railway Station
- Airports
- Supermarkets
- Tourist Places
- Shopping Malls
- Others (Bus stand, Institutes, Offices etc.)
- UK Outlook (USD Billion, 2018-2032)
- UK Reverse Vending Machine Market by Product type
- Metal recycling machine
- Glass recycling machine
- Plastic recycling machine
- Hybrid recycling machine
- UK Reverse Vending Machine Market by Capacity
- Less than 300 bottles/Cans
- 300 to 700 bottles/Cans
- More than 700 bottles/Cans
- UK Reverse Vending Machine Market by Application
- Railway Station
- Airports
- Supermarkets
- Tourist Places
- Shopping Malls
- Others (Bus stand, Institutes, Offices etc.)
- Germany Outlook (USD Billion, 2018-2032)
- Germany Reverse Vending Machine Market by Product type
- Metal recycling machine
- Glass recycling machine
- Plastic recycling machine
- Hybrid recycling machine
- Germany Reverse Vending Machine Market by Capacity
- Less than 300 bottles/Cans
- 300 to 700 bottles/Cans
- More than 700 bottles/Cans
- Germany Reverse Vending Machine Market by Application
- Railway Station
- Airports
- Supermarkets
- Tourist Places
- Shopping Malls
- Others (Bus stand, Institutes, Offices etc.)
- France Outlook (USD Billion, 2018-2032)
- France Reverse Vending Machine Market by Product type
- Metal recycling machine
- Glass recycling machine
- Plastic recycling machine
- Hybrid recycling machine
- France Reverse Vending Machine Market by Capacity
- Less than 300 bottles/Cans
- 300 to 700 bottles/Cans
- More than 700 bottles/Cans
- France Reverse Vending Machine Market by Application
- Railway Station
- Airports
- Supermarkets
- Tourist Places
- Shopping Malls
- Others (Bus stand, Institutes, Offices etc.)
- Italy Outlook (USD Billion, 2018-2032)
- Italy Reverse Vending Machine Market by Product type
- Metal recycling machine
- Glass recycling machine
- Plastic recycling machine
- Hybrid recycling machine
- Italy Reverse Vending Machine Market by Capacity
- Less than 300 bottles/Cans
- 300 to 700 bottles/Cans
- More than 700 bottles/Cans
- Italy Reverse Vending Machine Market by Application
- Railway Station
- Airports
- Supermarkets
- Tourist Places
- Shopping Malls
- Others (Bus stand, Institutes, Offices etc.)
- Spain Outlook (USD Billion, 2018-2032)
- Spain Reverse Vending Machine Market by Product type
- Metal recycling machine
- Glass recycling machine
- Plastic recycling machine
- Hybrid recycling machine
- Spain Reverse Vending Machine Market by Capacity
- Less than 300 bottles/Cans
- 300 to 700 bottles/Cans
- More than 700 bottles/Cans
- Spain Reverse Vending Machine Market by Application
- Railway Station
- Airports
- Supermarkets
- Tourist Places
- Shopping Malls
- Others (Bus stand, Institutes, Offices etc.)
- Rest Of Europe Outlook (USD Billion, 2018-2032)
- Rest Of Europe Reverse Vending Machine Market by Product type
- Metal recycling machine
- Glass recycling machine
- Plastic recycling machine
- Hybrid recycling machine
- Rest Of Europe Reverse Vending Machine Market by Capacity
- Less than 300 bottles/Cans
- 300 to 700 bottles/Cans
- More than 700 bottles/Cans
- Rest Of Europe Reverse Vending Machine Market by Application
- Railway Station
- Airports
- Supermarkets
- Tourist Places
- Shopping Malls
- Others (Bus stand, Institutes, Offices etc.)
- Asia-Pacific Outlook (USD Billion, 2018-2032)
- Asia-Pacific Reverse Vending Machine Market by Product type
- Metal recycling machine
- Glass recycling machine
- Plastic recycling machine
- Hybrid recycling machine
- Asia-Pacific Reverse Vending Machine Market by Capacity
- Less than 300 bottles/Cans
- 300 to 700 bottles/Cans
- More than 700 bottles/Cans
- Asia-Pacific Reverse Vending Machine Market by Application
- Railway Station
- Airports
- Supermarkets
- Tourist Places
- Shopping Malls
- Others (Bus stand, Institutes, Offices etc.)
- China Outlook (USD Billion, 2018-2032)
- China Reverse Vending Machine Market by Product type
- Metal recycling machine
- Glass recycling machine
- Plastic recycling machine
- Hybrid recycling machine
- China Reverse Vending Machine Market by Capacity
- Less than 300 bottles/Cans
- 300 to 700 bottles/Cans
- More than 700 bottles/Cans
- China Reverse Vending Machine Market by Application
- Railway Station
- Airports
- Supermarkets
- Tourist Places
- Shopping Malls
- Others (Bus stand, Institutes, Offices etc.)
- India Outlook (USD Billion, 2018-2032)
- India Reverse Vending Machine Market by Product type
- Metal recycling machine
- Glass recycling machine
- Plastic recycling machine
- Hybrid recycling machine
- India Reverse Vending Machine Market by Capacity
- Less than 300 bottles/Cans
- 300 to 700 bottles/Cans
- More than 700 bottles/Cans
- India Reverse Vending Machine Market by Application
- Railway Station
- Airports
- Supermarkets
- Tourist Places
- Shopping Malls
- Others (Bus stand, Institutes, Offices etc.)
- Japan Outlook (USD Billion, 2018-2032)
- Japan Reverse Vending Machine Market by Product type
- Metal recycling machine
- Glass recycling machine
- Plastic recycling machine
- Hybrid recycling machine
- Japan Reverse Vending Machine Market by Capacity
- Less than 300 bottles/Cans
- 300 to 700 bottles/Cans
- More than 700 bottles/Cans
- Japan Reverse Vending Machine Market by Application
- Railway Station
- Airports
- Supermarkets
- Tourist Places
- Shopping Malls
- Others (Bus stand, Institutes, Offices etc.)
- Australia Outlook (USD Billion, 2018-2032)
- Australia Reverse Vending Machine Market by Product type
- Metal recycling machine
- Glass recycling machine
- Plastic recycling machine
- Hybrid recycling machine
- Australia Reverse Vending Machine Market by Capacity
- Less than 300 bottles/Cans
- 300 to 700 bottles/Cans
- More than 700 bottles/Cans
- Australia Reverse Vending Machine Market by Application
- Railway Station
- Airports
- Supermarkets
- Tourist Places
- Shopping Malls
- Others (Bus stand, Institutes, Offices etc.)
- South Korea Outlook (USD Billion, 2018-2032)
- South Korea Reverse Vending Machine Market by Product type
- Metal recycling machine
- Glass recycling machine
- Plastic recycling machine
- Hybrid recycling machine
- South Korea Reverse Vending Machine Market by Capacity
- Less than 300 bottles/Cans
- 300 to 700 bottles/Cans
- More than 700 bottles/Cans
- South Korea Reverse Vending Machine Market by Application
- Railway Station
- Airports
- Supermarkets
- Tourist Places
- Shopping Malls
- Others (Bus stand, Institutes, Offices etc.)
- Rest of Asia-Pacific Outlook (USD Billion, 2018-2032)
- Rest of Asia-Pacific Reverse Vending Machine Market by Product type
- Metal recycling machine
- Glass recycling machine
- Plastic recycling machine
- Hybrid recycling machine
- Rest of Asia-Pacific Reverse Vending Machine Market by Capacity
- Less than 300 bottles/Cans
- 300 to 700 bottles/Cans
- More than 700 bottles/Cans
- Rest of Asia-Pacific Reverse Vending Machine Market by Application
- Railway Station
- Airports
- Supermarkets
- Tourist Places
- Shopping Malls
- Others (Bus stand, Institutes, Offices etc.)
- Middle East and Africa Outlook (USD Billion, 2018-2032)
- Middle East and AfricaReverse Vending Machine Market by Product type
- Metal recycling machine
- Glass recycling machine
- Plastic recycling machine
- Hybrid recycling machine
- Middle East and Africa Reverse Vending Machine Market by Capacity
- Less than 300 bottles/Cans
- 300 to 700 bottles/Cans
- More than 700 bottles/Cans
- Middle East and Africa Reverse Vending Machine Market by Application
- Railway Station
- Airports
- Supermarkets
- Tourist Places
- Shopping Malls
- Others (Bus stand, Institutes, Offices etc.)
- Saudi Arabia Outlook (USD Billion, 2018-2032)
- Saudi Arabia Reverse Vending Machine Market by Product type
- Metal recycling machine
- Glass recycling machine
- Plastic recycling machine
- Hybrid recycling machine
- Saudi Arabia Reverse Vending Machine Market by Capacity
- Less than 300 bottles/Cans
- 300 to 700 bottles/Cans
- More than 700 bottles/Cans
- Saudi Arabia Reverse Vending Machine Market by Application
- Railway Station
- Airports
- Supermarkets
- Tourist Places
- Shopping Malls
- Others (Bus stand, Institutes, Offices etc.)
- South Africa Outlook (USD Billion, 2018-2032)
- South Africa Reverse Vending Machine Market by Product type
- Metal recycling machine
- Glass recycling machine
- Plastic recycling machine
- Hybrid recycling machine
- South Africa Reverse Vending Machine Market by Capacity
- Less than 300 bottles/Cans
- 300 to 700 bottles/Cans
- More than 700 bottles/Cans
- South Africa Reverse Vending Machine Market by Application
- Railway Station
- Airports
- Supermarkets
- Tourist Places
- Shopping Malls
- Others (Bus stand, Institutes, Offices etc.)
- UAE Outlook (USD Billion, 2018-2032)
- UAE Reverse Vending Machine Market by Product type
- Metal recycling machine
- Glass recycling machine
- Plastic recycling machine
- Hybrid recycling machine
- UAE Reverse Vending Machine Market by Capacity
- Less than 300 bottles/Cans
- 300 to 700 bottles/Cans
- More than 700 bottles/Cans
- UAE Reverse Vending Machine Market by Application
- Railway Station
- Airports
- Supermarkets
- Tourist Places
- Shopping Malls
- Others (Bus stand, Institutes, Offices etc.)
- Rest of Middle East & Africa Outlook (USD Billion, 2018-2032)
- Rest of Middle East & Africa Reverse Vending Machine Market by Product type
- Metal recycling machine
- Glass recycling machine
- Plastic recycling machine
- Hybrid recycling machine
- Rest of Middle East & Africa Reverse Vending Machine Market by Capacity
- Less than 300 bottles/Cans
- 300 to 700 bottles/Cans
- More than 700 bottles/Cans
- Rest of Middle East & Africa Reverse Vending Machine Market by Application
- Railway Station
- Airports
- Supermarkets
- Tourist Places
- Shopping Malls
- Others (Bus stand, Institutes, Offices etc.)
- South America Outlook (USD Billion, 2018-2032)
- South America Reverse Vending Machine Market by Product type
- Metal recycling machine
- Glass recycling machine
- Plastic recycling machine
- Hybrid recycling machine
- South America Reverse Vending Machine Market by Capacity
- Less than 300 bottles/Cans
- 300 to 700 bottles/Cans
- More than 700 bottles/Cans
- South America Reverse Vending Machine Market by Application
- Railway Station
- Airports
- Supermarkets
- Tourist Places
- Shopping Malls
- Others (Bus stand, Institutes, Offices etc.)
- Brazil Outlook (USD Billion, 2018-2032)
- Brazil Reverse Vending Machine Market by Product type
- Metal recycling machine
- Glass recycling machine
- Plastic recycling machine
- Hybrid recycling machine
- Brazil Reverse Vending Machine Market by Capacity
- Less than 300 bottles/Cans
- 300 to 700 bottles/Cans
- More than 700 bottles/Cans
- Brazil Reverse Vending Machine Market by Application
- Railway Station
- Airports
- Supermarkets
- Tourist Places
- Shopping Malls
- Others (Bus stand, Institutes, Offices etc.)
- Argentina Outlook (USD Billion, 2018-2032)
- Argentina Reverse Vending Machine Market by Product type
- Metal recycling machine
- Glass recycling machine
- Plastic recycling machine
- Hybrid recycling machine
- Argentina Reverse Vending Machine Market by Capacity
- Less than 300 bottles/Cans
- 300 to 700 bottles/Cans
- More than 700 bottles/Cans
- Argentina Reverse Vending Machine Market by Application
- Railway Station
- Airports
- Supermarkets
- Tourist Places
- Shopping Malls
- Others (Bus stand, Institutes, Offices etc.)
- Rest of South America Outlook (USD Billion, 2018-2032)
- Rest of South America Reverse Vending Machine Market by Product type
- Metal recycling machine
- Glass recycling machine
- Plastic recycling machine
- Hybrid recycling machine
- Rest of South America Reverse Vending Machine Market by Capacity
- Less than 300 bottles/Cans
- 300 to 700 bottles/Cans
- More than 700 bottles/Cans
- Rest of South America Reverse Vending Machine Market by Application
- Railway Station
- Airports
- Supermarkets
- Tourist Places
- Shopping Malls
- Others (Bus stand, Institutes, Offices etc.)
- South America Reverse Vending Machine Market by Product type
- Middle East and AfricaReverse Vending Machine Market by Product type
- Asia-Pacific Reverse Vending Machine Market by Product type
- Europe Reverse Vending Machine Market by Product type
- North America Reverse Vending Machine Market by Product type

Free Sample Request
Kindly complete the form below to receive a free sample of this Report
Customer Strories
“I am very pleased with how market segments have been defined in a relevant way for my purposes (such as "Portable Freezers & refrigerators" and "last-mile"). In general the report is well structured. Thanks very much for your efforts.”
Leave a Comment