• Cat-intel
  • MedIntelliX
  • Resources
  • About Us
  • Request Free Sample ×

    Kindly complete the form below to receive a free sample of this Report

    Leading companies partner with us for data-driven Insights

    clients tt-cursor

    Procurement Analytics Market

    ID: MRFR/ICT/6213-HCR
    200 Pages
    Aarti Dhapte
    September 2025

    Procurement Analytics Market Research Report By Deployment Type (Cloud, On-premises, Hybrid), By Application (Spend Analysis, Supplier Performance Analysis, Contract Management, Risk Management), By End User (Retail, Manufacturing, Healthcare, IT, Telecommunications), By Component (Software, Services) and By Regional (North America, Europe, South America, Asia Pacific, Middle East and Africa) - Forecast to 2035

    Share:
    Download PDF ×

    We do not share your information with anyone. However, we may send you emails based on your report interest from time to time. You may contact us at any time to opt-out.

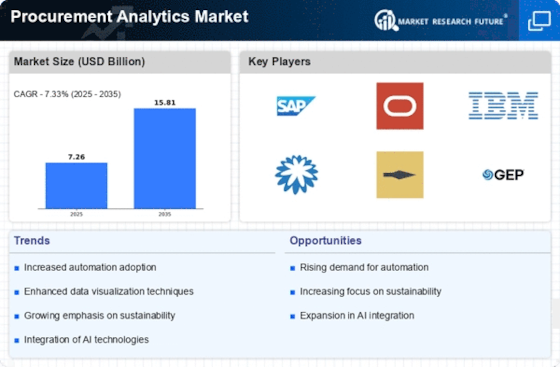
    Procurement Analytics Market Research Report-Forecast to 2035 Infographic
    Purchase Options
    $ 4,950.0
    $ 5,950.0
    $ 7,250.0

    Procurement Analytics Market Summary

    As per Market Research Future Analysis, the Procurement Analytics Market was valued at 6.77 USD Billion in 2023 and is projected to grow to 15.8 USD Billion by 2035, with a CAGR of 7.32% from 2025 to 2035. The market is driven by the need for cost optimization, regulatory compliance, and technological advancements in analytics capabilities.

    Key Market Trends & Highlights

    The Global Procurement Analytics Market is undergoing significant transformation due to technological advancements and increasing demand for data-driven decision-making.

    • The market is expected to reach 7.26 USD Billion in 2024, growing to 15.8 USD Billion by 2035.
    • Cloud solutions are projected to grow from 3.0 USD Billion in 2024 to 6.8 USD Billion by 2035.
    • Retail and Manufacturing sectors are key end users, leveraging analytics for efficiency and cost reduction.

    Market Size & Forecast

    2023 Market Size USD 6.77 Billion
    2024 Market Size USD 7.26 Billion
    2035 Market Size USD 15.8 Billion
    CAGR (2025-2035) 7.32%

    Major Players

    IBM, Ariba, SAP, Bain and Company, Procurify, InfoSys, Coupa Software, Jaggaer, Kinaxis, GEP Worldwide, Zycus, Icertis, Microsoft, SAS Institute, Oracle

    Procurement Analytics Market Trends

    The Procurement Analytics Market is witnessing significant growth due to several key market drivers. The increasing need for organizations to enhance their supply chain efficiencies and make data-driven decisions is pushing demand for procurement analytics tools. Companies are recognizing the necessity of leveraging big data and advanced analytics to optimize procurement strategies, identify cost-saving opportunities, and improve supplier relationships.

    Additionally, the rise of artificial intelligence and machine learning technologies is enabling more sophisticated analytical capabilities, allowing businesses to predict procurement trends and manage risks more effectively.

    Also, small and medium-sized businesses will be able to access procurement analytics tools more easily with the use of more advanced cloud solutions. This will make the market bigger. Recently, there has been a clear trend of companies putting digital transformation projects at the top of their lists of things to do. This has led to more money being spent on procurement analytics solutions.

    This trend is further accelerated by the ongoing challenges related to global supply chain disruptions, which force companies to re-evaluate their sourcing and procurement strategies. A focus on real-time analytics and the adoption of collaborative tools to improve communication between procurement teams and suppliers has also become prominent. As organizations strive for agility and responsiveness, the importance of procurement analytics will continue to rise globally, shaping the future of procurement practices.

    The increasing complexity of global supply chains necessitates enhanced procurement analytics capabilities to drive efficiency and informed decision-making.

    U.S. Department of Commerce

    Procurement Analytics Market Drivers

    Market Growth Projections

    The Global Procurement Analytics Market Industry is poised for substantial growth, with projections indicating a market size of 7.26 USD Billion in 2024 and an anticipated increase to 15.8 USD Billion by 2035. This growth trajectory suggests a compound annual growth rate of 7.33% from 2025 to 2035, reflecting the increasing adoption of analytics solutions across various industries. The rising demand for data-driven insights, coupled with advancements in technology, is likely to drive this market expansion. Organizations are expected to invest significantly in procurement analytics to enhance decision-making and improve operational efficiency.

    Global Supply Chain Resilience

    The need for global supply chain resilience is a significant driver in the Global Procurement Analytics Market Industry. Organizations are recognizing the importance of building resilient supply chains that can withstand disruptions and adapt to changing market conditions. Procurement analytics plays a vital role in enhancing supply chain visibility, enabling companies to identify vulnerabilities and develop contingency plans. As businesses strive to create more agile and responsive supply chains, the demand for analytics solutions is likely to increase. This focus on resilience is expected to shape the future of procurement analytics, fostering innovation and strategic planning.

    Integration of Advanced Technologies

    The integration of advanced technologies such as artificial intelligence and machine learning is transforming the Global Procurement Analytics Market Industry. These technologies enable organizations to analyze vast amounts of procurement data, identify patterns, and forecast future trends. As a result, companies can streamline their procurement processes, reduce costs, and enhance supplier performance. The anticipated growth of the market to 15.8 USD Billion by 2035 underscores the potential of these technologies in driving efficiency and innovation within procurement functions. Organizations that adopt these advanced analytics solutions are likely to achieve significant improvements in their procurement outcomes.

    Focus on Cost Reduction and Efficiency

    Cost reduction remains a primary focus for organizations within the Global Procurement Analytics Market Industry. As businesses face increasing pressure to optimize their budgets, procurement analytics provides valuable insights into spending patterns and supplier performance. By utilizing analytics tools, organizations can identify areas for cost savings, negotiate better contracts, and enhance supplier collaboration. The projected compound annual growth rate of 7.33% from 2025 to 2035 indicates a sustained commitment to leveraging analytics for cost efficiency. This focus on reducing procurement costs while maintaining quality is likely to drive further adoption of analytics solutions.

    Regulatory Compliance and Risk Management

    Regulatory compliance and risk management are critical drivers in the Global Procurement Analytics Market Industry. Organizations are increasingly required to adhere to stringent regulations and standards, necessitating robust analytics solutions to monitor compliance and mitigate risks. Procurement analytics enables companies to assess supplier risks, track compliance metrics, and ensure adherence to industry regulations. As the market evolves, the emphasis on risk management is expected to grow, prompting organizations to invest in analytics tools that provide real-time insights into compliance and risk factors. This trend highlights the importance of analytics in maintaining operational integrity.

    Rising Demand for Data-Driven Decision Making

    The Global Procurement Analytics Market Industry experiences a notable surge in demand for data-driven decision-making processes. Organizations increasingly recognize the value of leveraging analytics to enhance procurement strategies, optimize supplier relationships, and improve overall operational efficiency. In 2024, the market is projected to reach 7.26 USD Billion, reflecting a growing trend among businesses to utilize data insights for informed purchasing decisions. This shift towards analytics-driven procurement is likely to continue, as companies seek to gain competitive advantages through enhanced visibility and predictive capabilities in their supply chains.

    Market Segment Insights

    Procurement Analytics Market Deployment Type Insights

    The Procurement Analytics Market is experiencing notable expansion, particularly within the Deployment Type segment, which comprises Cloud, On-premises, and Hybrid categories. By 2024, the Cloud deployment segment is expected to reach a valuation of 3.0 USD Billion, indicating a significant shift toward cloud-based solutions due to their scalability and cost-effectiveness. This sub-segment is projected to grow to 6.5 USD billion by 2035, reflecting the trend where organizations favor cloud options for improved accessibility and collaboration across global teams.

    Meanwhile, the On-premises segment is valued at 2.5 USD Billion in 2024, with growth expected to elevate it to 5.5 USD Billion in 2035. This deployment option remains crucial for organizations prioritizing data security and regulatory compliance, thus holding a considerable share in the market. Additionally, the Hybrid deployment model is valued at 1.76 USD billion in 2024, expected to grow to 3.8 USD billion by 2035, catering to businesses that require both on-premises stability and cloud flexibility. The Hybrid approach appeals to organizations looking for a balanced solution, combining the benefits of both cloud and on-premises deployments.

    The rise in cloud-first strategies and digital transformation initiatives globally has reinforced the importance of these deployment types. Moreover, the continuous evolution of procurement practices, driven by increasing data requirements and a need for effective supplier management, presents significant opportunities for providers in this space. Challenges such as data integration and security remain, but the demand for procurement analytics tools that can operate across multiple deployment types continues to grow. The segment dynamics reflect broader market trends, showcasing how technology advancements and changing business needs are shaping deployment preferences within the Procurement Analytics Market landscape.

    Source: Primary Research, Secondary Research, Market Research Future Database, and Analyst Review

    Procurement Analytics Market Application Insights

    The Procurement Analytics Market is projected to reach approximately 7.26 USD Billion in 2024, showcasing significant growth within the Application domain. This segment is pivotal in enhancing procurement processes by leveraging data analytics to improve efficiency and decision-making. Within this domain, Spend Analysis plays a crucial role as it helps organizations scrutinize expenditure and identify cost-saving opportunities, leading to optimization. Supplier Performance Analysis is another key aspect, enabling businesses to evaluate suppliers based on various metrics, ensuring high standards and reliability in the supply chain.

    Contract Management stands out for streamlining procurement agreements, facilitating adherence to terms, and minimizing risks associated with non-compliance. Meanwhile, Risk Management is essential for identifying and mitigating potential supply chain vulnerabilities, thereby safeguarding organizational interests. The market reflects a growing emphasis on data-driven decision-making across these applications, underscoring the significance of effective procurement strategies in a globalized economy. As organizations increasingly adopt advanced analytics, the Procurement Analytics Market data indicates robust growth potential driven by the necessity for efficiency and risk mitigation in procurement operations.

    Procurement Analytics Market End User Insights

    The Procurement Analytics Market, focusing on the End User segment, is poised for growth as businesses increasingly recognize the value of data-driven decision-making. By 2024, the market is expected to reach 7.26 USD Billion, reflecting a robust demand across various sectors. Within this landscape, the Retail and Manufacturing industries play a crucial role as they seek efficient supply chain management and cost reduction strategies. Healthcare organizations leverage procurement analytics to optimize resource allocation and improve patient care outcomes.

    The IT sector benefits from enhanced vendor management, while Telecommunications companies utilize analytics for improved service delivery. Collectively, these areas contribute to the market dynamics, with organizations adopting advanced analytical tools to gain insights into procurement processes. The Procurement Analytics Market data showcases varied growth drivers, such as the rise in digital transformation initiatives and increasing demand for efficiency. However, challenges like data integration and cybersecurity concerns remain pertinent.

    Overall, the trends indicate a shift toward smart procurement practices across all sectors, offering significant opportunities for innovative solutions in the market.

    Procurement Analytics Market Component Insights

    The Component segment of the Procurement Analytics Market includes crucial categories such as Software and Services, which play a pivotal role in driving efficiency and strategic decision-making in procurement processes. As the market is projected to reach a valuation of USD 7.26 billion in 2024 and continue to grow significantly, these components are essential in managing procurement data effectively. Software solutions are becoming increasingly important as organizations recognize the need for advanced analytics to gain insights from their supplier relationships and purchasing behaviors.

    This segment generally garners a majority holding in terms of market revenue, as businesses invest heavily in technologies that enhance visibility and control over procurement activities. Services, on the other hand, encompass critical functions such as consulting, implementation, and support, which enable companies to maximize the benefits of procurement analytics tools. The growing trend towards automation and digitization in procurement strategies further underlines the importance of these components, presenting opportunities for innovative solutions and improved resource management in a highly competitive global market.

    Get more detailed insights about Procurement Analytics Market Research Report-Forecast to 2035

    Regional Insights

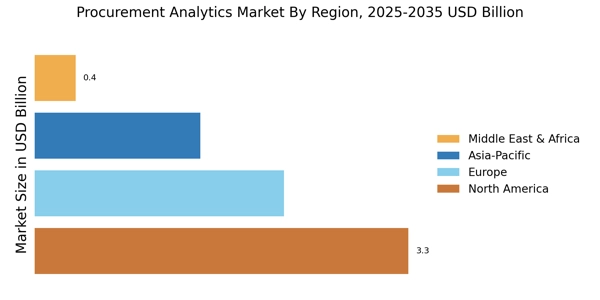
    The Regional segment of the Procurement Analytics Market exhibits notable diversity in valuations and growth trajectories. In 2024, North America leads this segment with an expected value of 2.2 USD Billion, growing to 4.7 USD billion by 2035, largely driven by the strong technological adoption and a mature market for analytics solutions. Europe follows closely with a valuation of 1.8 USD Billion in 2024, anticipated to reach 3.9 USD billion in 2035, underscoring its importance in the analytics landscape.

    The Asia Pacific region, valued at 2.0 USD Billion in 2024 and projected to attain 4.3 USD billion by 2035, demonstrates significant growth potential due to increasing digital transformation and investment in procurement strategies.

    South America and the Middle East, and Africa represent smaller segments, with values of 0.6 USD Billion and 0.66 USD billion in 2024, respectively, yet both are poised for gradual growth as awareness of procurement analytics expands. These figures reflect the Procurement Analytics Market segmentation, highlighting the contributions from different regions, which are crucial for understanding market dynamics and the overall industry landscape. The increasing adoption of data-driven decision-making in procurement practices signifies the importance of these regional markets, driving their respective valuations forward.

    Procurement Analytics Market Regional Insights

    Source: Primary Research, Secondary Research, Market Research Future Database, and Analyst Review

    Key Players and Competitive Insights

    The Procurement Analytics Market has been witnessing significant growth as organizations increasingly recognize the value of data-driven insights in improving procurement processes and decision-making. This market is characterized by a rapidly evolving landscape where numerous key players are striving to leverage advanced technologies such as artificial intelligence, machine learning, and big data analytics. Competitive insights reveal that market participants are not only focused on enhancing their product offerings but are also actively seeking to establish strategic partnerships and collaborations to strengthen their market positions.

    As more companies adopt procurement analytics solutions, the focus on innovative features, capabilities, and customer service is becoming increasingly important to differentiate one offering from another in this growing market.

    Basware has positioned itself as a strong player in the Procurement Analytics Market, with a robust portfolio of solutions designed to enhance procurement efficiency and decision-making. The company's strengths lie in its comprehensive analytics tools that offer insights into procurement processes, supplier performance, and spending patterns. Basware caters to a diverse range of industries, which reinforces its presence in the global market. The company has made substantial investments in research and development, continuously innovating to ensure that its offerings remain at the forefront of technological advancements.

    This commitment to innovation, combined with a strong reputation for reliability and client support, has solidified Basware's standing as a trusted provider in procurement analytics.

    Tealbook is another notable entity within the Procurement Analytics Market, known for its unique approach to supplier data and insights. The company focuses on providing a comprehensive platform that centralizes supplier information, thereby improving procurement agility and transparency. Tealbook’s key products and services include its robust supplier data management tools and advanced analytics capabilities, enabling organizations to make informed procurement decisions. With a strong emphasis on integrating artificial intelligence into its offerings, Tealbook enhances the accuracy of supplier evaluations and market insights.

    The company has been proactive in forging strategic partnerships and collaborations to expand its market presence, and its commitment to innovation is evident in its continuous efforts to enhance its product functionality. Overall, Tealbook stands out in the global procurement analytics landscape due to its focus on data-driven insights that empower organizations to optimize their supplier relationships and procurement strategies.

    Key Companies in the Procurement Analytics Market market include

    Industry Developments

    There have been a lot of changes in the Procurement Analytics Market lately, especially from big companies like Basware, Tealbook, Coupa, Oracle, and GEP. GEP QUANTUM, GEP's AI-first platform, was launched in October 2023. Its goal is to provide more information about procurement, supply chains, and sustainability initiatives. This was a major breakthrough in how artificial intelligence can be used in platforms for procurement analytics.

    Thoma Bravo bought Coupa in February 2023, and the company has continued to improve its data capabilities through its unified spend platform. But, despite what was said, Coupa did not announce the purchase of a dedicated analytics company in September 2023.

    IBM is still improving its procurement-related products, but there was no announcement of a new procurement intelligence suite in July 2023. Ivalua is said to have grown its user base, which shows that there is a growing need for strong procurement analytics tools. However, the exact number of 20% growth has not been confirmed in public sources.

    In general, the procurement analytics market has grown steadily. This is because more money is being spent on digital transformation, supplier risk management, and data-driven decision-making, especially since companies have had to deal with problems in the global supply chain since 2020. Companies like SAP, Zycus, Jaggaer, and SpendHQ are always coming up with new ways to help businesses better manage their costs and work with suppliers by using real-time analytics.

    Future Outlook

    Procurement Analytics Market Future Outlook

    The Procurement Analytics Market is projected to grow at a 7.33% CAGR from 2024 to 2035, driven by digital transformation, data-driven decision-making, and supply chain optimization.

    New opportunities lie in:

    • Leverage AI-driven analytics to enhance supplier performance evaluation.
    • Develop cloud-based procurement solutions for real-time data access.
    • Implement predictive analytics to optimize inventory management strategies.

    By 2035, the Procurement Analytics Market is expected to achieve substantial growth, reflecting evolving business needs and technological advancements.

    Market Segmentation

    Procurement Analytics Market End User Outlook

    • Retail
    • Manufacturing
    • Healthcare
    • IT
    • Telecommunications

    Procurement Analytics Market Regional Outlook

    • North America
    • Europe
    • South America
    • Asia Pacific
    • Middle East and Africa

    Procurement Analytics Market Component Outlook

    • Software
    • Services

    Procurement Analytics Market Application Outlook

    • Spend Analysis
    • Supplier Performance Analysis
    • Contract Management
    • Risk Management

    Procurement Analytics Market Deployment Type Outlook

    • Cloud
    • On-premises
    • Hybrid

    Report Scope

    Report Attribute/Metric

    Details

    Market Size 2023

    6.77 (USD Billion)

    Market Size 2024

    7.26 (USD Billion)

    Market Size 2035

    15.8 (USD Billion)

    Compound Annual Growth Rate (CAGR)

    7.33% (2025 - 2035)

    Report Coverage

    Revenue Forecast, Competitive Landscape, Growth Factors, and Trends

    Base Year

    2024

    Market Forecast Period

    2025 - 2035

    Historical Data

    2019 - 2024

    Market Forecast Units

    USD Billion

    Key Companies Profiled

    Basware, Tealbook, Coupa, Determine, Oracle, GEP, Ivalua, IBM, SpendHQ, Jaggaer, SynerTrade, Zycus, SAP, Procurify, ProcurementIQ

    Segments Covered

    Deployment Type, Application, End User, Component, Regional

    Key Market Opportunities

    AI and machine learning integration, Real-time data analysis demand, Increased focus on cost reduction, Supplier risk management enhancement, Cloud-based solutions adoption

    Key Market Dynamics

    Increasing data-driven decision making, Rising demand for cost efficiency, Integration of AI technologies, Need for supplier risk management, and Growing adoption of cloud solutions.

    Countries Covered

    North America, Europe, APAC, South America, MEA

    Market Highlights

    Author
    Aarti Dhapte
    Team Lead - Research

    She holds an experience of about 6+ years in Market Research and Business Consulting, working under the spectrum of Information Communication Technology, Telecommunications and Semiconductor domains. Aarti conceptualizes and implements a scalable business strategy and provides strategic leadership to the clients. Her expertise lies in market estimation, competitive intelligence, pipeline analysis, customer assessment, etc.

    Leave a Comment

    FAQs

    What is the expected market size of the Procurement Analytics Market in 2024?

    The Procurement Analytics Market is expected to be valued at 7.26 USD billion in 2024.

    What is the projected market growth rate for the Procurement Analytics Market from 2025 to 2035?

    The market is expected to grow at a CAGR of 7.33% from 2025 to 2035.

    How much is the North American segment of the Procurement Analytics Market expected to be worth in 2035?

    The North American segment is projected to reach a value of 4.7 USD billion by 2035.

    What is the market value of the Cloud deployment type in the Procurement Analytics Market for 2024?

    The Cloud deployment type is expected to be valued at 3.0 USD Billion in 2024.

    Who are the key players in the Procurement Analytics Market?

    Major players include Basware, Coupa, Oracle, GEP, and SAP, among others.

    What is the expected market size of the Procurement Analytics Market in Asia Pacific for 2035?

    The Asia Pacific region is expected to reach a market size of 4.3 USD billion by 2035.

    What is the projected market size for the On-premises deployment type in 2035?

    The On-premises deployment type is projected to be valued at 5.5 USD Billion in 2035.

    How much is the South American segment expected to grow by 2035?

    The South American segment is expected to grow to 1.3 USD billion by 2035.

    What are the growth drivers for the Procurement Analytics Market?

    Increasing need for data-driven decision-making and cost reduction initiatives are key growth drivers.

    What is the projected market value for the Hybrid deployment type in 2035?

    The Hybrid deployment type is expected to be valued at 3.8 USD billion by 2035.

    1. EXECUTIVE SUMMARY
    2. Market Overview
    3. Key Findings
    4. Market Segmentation
    5. Competitive Landscape
    6. Challenges and Opportunities
    7. Future Outlook
    8. MARKET INTRODUCTION
    9. Definition
    10. Scope of the study
    11. Research Objective
    12. Assumption
    13. Limitations
    14. RESEARCH
    15. METHODOLOGY
    16. Overview
    17. Data Mining
    18. Secondary Research
    19. Primary Research
    20. Primary Interviews and Information Gathering Process
    21. Breakdown of Primary Respondents
    22. Forecasting Model
    23. Market Size Estimation
    24. Bottom-Up Approach
    25. Top-Down Approach
    26. Data Triangulation
    27. Validation
    28. MARKET DYNAMICS
    29. Overview
    30. Drivers
    31. Restraints
    32. Opportunities
    33. MARKET FACTOR ANALYSIS
    34. Value chain Analysis
    35. Porter's Five Forces
    36. Analysis
    37. Bargaining Power of Suppliers
    38. Bargaining Power of Buyers
    39. Threat of New Entrants
    40. Threat of Substitutes
    41. Intensity of Rivalry
    42. COVID-19 Impact
    43. Analysis
    44. Market Impact Analysis
    45. Regional Impact
    46. Opportunity and
    47. Threat Analysis
    48. PROCUREMENT ANALYTICS MARKET, BY Deployment Type (USD
    49. Billion)
    50. Cloud
    51. On-premises
    52. Hybrid
    53. PROCUREMENT
    54. ANALYTICS MARKET, BY Application (USD Billion)
    55. Spend Analysis
    56. Supplier Performance
    57. Analysis
    58. Contract Management
    59. Risk Management
    60. PROCUREMENT ANALYTICS MARKET, BY
    61. End User (USD Billion)
    62. Retail
    63. Manufacturing
    64. Healthcare
    65. IT
    66. Telecommunications
    67. PROCUREMENT ANALYTICS MARKET, BY
    68. Component (USD Billion)
    69. Software
    70. Services
    71. PROCUREMENT
    72. ANALYTICS MARKET, BY Regional (USD Billion)
    73. North America
    74. US
    75. Canada
    76. Europe
    77. Germany
    78. UK
    79. France
    80. Russia
    81. Italy
    82. Spain
    83. Rest of Europe
    84. APAC
    85. China
    86. India
    87. Japan
    88. South Korea
    89. Malaysia
    90. Thailand
    91. Indonesia
    92. Rest of APAC
    93. South America
    94. Brazil
    95. Mexico
    96. Argentina
    97. Rest of South America
    98. MEA
    99. GCC Countries
    100. South Africa
    101. Rest of MEA
    102. Competitive Landscape
    103. Overview
    104. Competitive Analysis
    105. Market share Analysis
    106. Major Growth Strategy in the PROCUREMENT
    107. ANALYTICS MARKET
    108. Competitive Benchmarking
    109. Leading Players
    110. in Terms of Number of Developments in the PROCUREMENT ANALYTICS MARKET
    111. Key developments
    112. and growth strategies
    113. New Product Launch/Service Deployment
    114. Merger & Acquisitions
    115. Joint Ventures
    116. Major Players Financial Matrix
    117. Sales and Operating Income
    118. Major Players R&D Expenditure.
    119. Company Profiles
    120. Basware
    121. Financial Overview
    122. Products Offered
    123. Key Developments
    124. SWOT Analysis
    125. Key Strategies
    126. Tealbook
    127. Financial Overview
    128. Products Offered
    129. Key Developments
    130. SWOT Analysis
    131. Key Strategies
    132. Coupa
    133. Financial Overview
    134. Products Offered
    135. Key Developments
    136. SWOT Analysis
    137. Key Strategies
    138. Determine
    139. Financial Overview
    140. Products Offered
    141. Key Developments
    142. SWOT Analysis
    143. Key Strategies
    144. Oracle
    145. Financial Overview
    146. Products Offered
    147. Key Developments
    148. SWOT Analysis
    149. Key Strategies
    150. GEP
    151. Financial Overview
    152. Products Offered
    153. Key Developments
    154. SWOT Analysis
    155. Key Strategies
    156. Ivalua
    157. Financial Overview
    158. Products Offered
    159. Key Developments
    160. SWOT Analysis
    161. Key Strategies
    162. IBM
    163. Financial Overview
    164. Products Offered
    165. Key Developments
    166. SWOT Analysis
    167. Key Strategies
    168. SpendHQ
    169. Financial Overview
    170. Products Offered
    171. Key Developments
    172. SWOT Analysis
    173. Key Strategies
    174. Jaggaer
    175. Financial Overview
    176. Products Offered
    177. Key Developments
    178. SWOT Analysis
    179. Key Strategies
    180. SynerTrade
    181. Financial Overview
    182. Products Offered
    183. Key Developments
    184. SWOT Analysis
    185. Key Strategies
    186. Zycus
    187. Financial Overview
    188. Products Offered
    189. Key Developments
    190. SWOT Analysis
    191. Key Strategies
    192. SAP
    193. Financial Overview
    194. Products Offered
    195. Key Developments
    196. SWOT Analysis
    197. Key Strategies
    198. Procurify
    199. Financial Overview
    200. Products Offered
    201. Key Developments
    202. SWOT Analysis
    203. Key Strategies
    204. ProcurementIQ
    205. Financial Overview
    206. Products Offered
    207. Key Developments
    208. SWOT Analysis
    209. Key Strategies
    210. References
    211. Related Reports
    212. North America Market SIZE ESTIMATES & FORECAST, BY DEPLOYMENT
    213. TYPE, 2019-2035 (USD Billions)
    214. North
    215. America Market SIZE ESTIMATES & FORECAST, BY APPLICATION, 2019-2035 (USD Billions)
    216. North America Market SIZE ESTIMATES & FORECAST, BY END USER,
    217. 2035 (USD Billions)
    218. North America
    219. Market SIZE ESTIMATES & FORECAST, BY COMPONENT, 2019-2035 (USD Billions)
    220. North America Market SIZE ESTIMATES & FORECAST, BY REGIONAL,
    221. 2035 (USD Billions)
    222. US Market
    223. SIZE ESTIMATES & FORECAST, BY DEPLOYMENT TYPE, 2019-2035 (USD Billions)
    224. US Market SIZE ESTIMATES & FORECAST, BY APPLICATION, 2019-2035
    225. (USD Billions)
    226. US Market SIZE ESTIMATES & FORECAST, BY
    227. END USER, 2019-2035 (USD Billions)
    228. US
    229. Market SIZE ESTIMATES & FORECAST, BY COMPONENT, 2019-2035 (USD Billions)
    230. US Market SIZE ESTIMATES & FORECAST, BY REGIONAL, 2019-2035
    231. (USD Billions)
    232. Canada Market SIZE ESTIMATES & FORECAST,
    233. BY DEPLOYMENT TYPE, 2019-2035 (USD Billions)
    234. Canada
    235. Market SIZE ESTIMATES & FORECAST, BY APPLICATION, 2019-2035 (USD Billions)
    236. Canada Market SIZE ESTIMATES & FORECAST, BY END USER, 2019-2035
    237. (USD Billions)
    238. Canada Market SIZE ESTIMATES & FORECAST,
    239. BY COMPONENT, 2019-2035 (USD Billions)
    240. Canada
    241. Market SIZE ESTIMATES & FORECAST, BY REGIONAL, 2019-2035 (USD Billions)
    242. Europe Market SIZE ESTIMATES & FORECAST, BY DEPLOYMENT TYPE,
    243. 2035 (USD Billions)
    244. Europe Market
    245. SIZE ESTIMATES & FORECAST, BY APPLICATION, 2019-2035 (USD Billions)
    246. Europe
    247. Market SIZE ESTIMATES & FORECAST, BY END USER, 2019-2035 (USD Billions)
    248. Europe Market SIZE ESTIMATES & FORECAST, BY COMPONENT, 2019-2035
    249. (USD Billions)
    250. Europe Market SIZE ESTIMATES & FORECAST,
    251. BY REGIONAL, 2019-2035 (USD Billions)
    252. Germany
    253. Market SIZE ESTIMATES & FORECAST, BY DEPLOYMENT TYPE, 2019-2035 (USD Billions)
    254. Germany Market SIZE ESTIMATES & FORECAST, BY APPLICATION, 2019-2035
    255. (USD Billions)
    256. Germany Market SIZE ESTIMATES & FORECAST,
    257. BY END USER, 2019-2035 (USD Billions)
    258. Germany
    259. Market SIZE ESTIMATES & FORECAST, BY COMPONENT, 2019-2035 (USD Billions)
    260. Germany Market SIZE ESTIMATES & FORECAST, BY REGIONAL, 2019-2035
    261. (USD Billions)
    262. UK Market SIZE ESTIMATES & FORECAST, BY
    263. DEPLOYMENT TYPE, 2019-2035 (USD Billions)
    264. UK
    265. Market SIZE ESTIMATES & FORECAST, BY APPLICATION, 2019-2035 (USD Billions)
    266. UK Market SIZE ESTIMATES & FORECAST, BY END USER, 2019-2035
    267. (USD Billions)
    268. UK Market SIZE ESTIMATES & FORECAST, BY
    269. COMPONENT, 2019-2035 (USD Billions)
    270. UK
    271. Market SIZE ESTIMATES & FORECAST, BY REGIONAL, 2019-2035 (USD Billions)
    272. France Market SIZE ESTIMATES & FORECAST, BY DEPLOYMENT TYPE,
    273. 2035 (USD Billions)
    274. France Market
    275. SIZE ESTIMATES & FORECAST, BY APPLICATION, 2019-2035 (USD Billions)
    276. France
    277. Market SIZE ESTIMATES & FORECAST, BY END USER, 2019-2035 (USD Billions)
    278. France Market SIZE ESTIMATES & FORECAST, BY COMPONENT, 2019-2035
    279. (USD Billions)
    280. France Market SIZE ESTIMATES & FORECAST,
    281. BY REGIONAL, 2019-2035 (USD Billions)
    282. Russia
    283. Market SIZE ESTIMATES & FORECAST, BY DEPLOYMENT TYPE, 2019-2035 (USD Billions)
    284. Russia Market SIZE ESTIMATES & FORECAST, BY APPLICATION, 2019-2035
    285. (USD Billions)
    286. Russia Market SIZE ESTIMATES & FORECAST,
    287. BY END USER, 2019-2035 (USD Billions)
    288. Russia
    289. Market SIZE ESTIMATES & FORECAST, BY COMPONENT, 2019-2035 (USD Billions)
    290. Russia Market SIZE ESTIMATES & FORECAST, BY REGIONAL, 2019-2035
    291. (USD Billions)
    292. Italy Market SIZE ESTIMATES & FORECAST,
    293. BY DEPLOYMENT TYPE, 2019-2035 (USD Billions)
    294. Italy
    295. Market SIZE ESTIMATES & FORECAST, BY APPLICATION, 2019-2035 (USD Billions)
    296. Italy Market SIZE ESTIMATES & FORECAST, BY END USER, 2019-2035
    297. (USD Billions)
    298. Italy Market SIZE ESTIMATES & FORECAST,
    299. BY COMPONENT, 2019-2035 (USD Billions)
    300. Italy
    301. Market SIZE ESTIMATES & FORECAST, BY REGIONAL, 2019-2035 (USD Billions)
    302. Spain Market SIZE ESTIMATES & FORECAST, BY DEPLOYMENT TYPE,
    303. 2035 (USD Billions)
    304. Spain Market
    305. SIZE ESTIMATES & FORECAST, BY APPLICATION, 2019-2035 (USD Billions)
    306. Spain
    307. Market SIZE ESTIMATES & FORECAST, BY END USER, 2019-2035 (USD Billions)
    308. Spain Market SIZE ESTIMATES & FORECAST, BY COMPONENT, 2019-2035
    309. (USD Billions)
    310. Spain Market SIZE ESTIMATES & FORECAST,
    311. BY REGIONAL, 2019-2035 (USD Billions)
    312. Rest
    313. of Europe Market SIZE ESTIMATES & FORECAST, BY DEPLOYMENT TYPE, 2019-2035 (USD
    314. Billions)
    315. Rest of Europe Market SIZE ESTIMATES &
    316. FORECAST, BY APPLICATION, 2019-2035 (USD Billions)
    317. Rest
    318. of Europe Market SIZE ESTIMATES & FORECAST, BY END USER, 2019-2035 (USD Billions)
    319. Rest of Europe Market SIZE ESTIMATES & FORECAST, BY COMPONENT,
    320. 2035 (USD Billions)
    321. Rest of Europe
    322. Market SIZE ESTIMATES & FORECAST, BY REGIONAL, 2019-2035 (USD Billions)
    323. APAC Market SIZE ESTIMATES & FORECAST, BY DEPLOYMENT TYPE, 2019-2035
    324. (USD Billions)
    325. APAC Market SIZE ESTIMATES & FORECAST,
    326. BY APPLICATION, 2019-2035 (USD Billions)
    327. APAC
    328. Market SIZE ESTIMATES & FORECAST, BY END USER, 2019-2035 (USD Billions)
    329. APAC Market SIZE ESTIMATES & FORECAST, BY COMPONENT, 2019-2035
    330. (USD Billions)
    331. APAC Market SIZE ESTIMATES & FORECAST,
    332. BY REGIONAL, 2019-2035 (USD Billions)
    333. China
    334. Market SIZE ESTIMATES & FORECAST, BY DEPLOYMENT TYPE, 2019-2035 (USD Billions)
    335. China Market SIZE ESTIMATES & FORECAST, BY APPLICATION, 2019-2035
    336. (USD Billions)
    337. China Market SIZE ESTIMATES & FORECAST,
    338. BY END USER, 2019-2035 (USD Billions)
    339. China
    340. Market SIZE ESTIMATES & FORECAST, BY COMPONENT, 2019-2035 (USD Billions)
    341. China Market SIZE ESTIMATES & FORECAST, BY REGIONAL, 2019-2035
    342. (USD Billions)
    343. India Market SIZE ESTIMATES & FORECAST,
    344. BY DEPLOYMENT TYPE, 2019-2035 (USD Billions)
    345. India
    346. Market SIZE ESTIMATES & FORECAST, BY APPLICATION, 2019-2035 (USD Billions)
    347. India Market SIZE ESTIMATES & FORECAST, BY END USER, 2019-2035
    348. (USD Billions)
    349. India Market SIZE ESTIMATES & FORECAST,
    350. BY COMPONENT, 2019-2035 (USD Billions)
    351. India
    352. Market SIZE ESTIMATES & FORECAST, BY REGIONAL, 2019-2035 (USD Billions)
    353. Japan Market SIZE ESTIMATES & FORECAST, BY DEPLOYMENT TYPE,
    354. 2035 (USD Billions)
    355. Japan Market
    356. SIZE ESTIMATES & FORECAST, BY APPLICATION, 2019-2035 (USD Billions)
    357. Japan
    358. Market SIZE ESTIMATES & FORECAST, BY END USER, 2019-2035 (USD Billions)
    359. Japan Market SIZE ESTIMATES & FORECAST, BY COMPONENT, 2019-2035
    360. (USD Billions)
    361. Japan Market SIZE ESTIMATES & FORECAST,
    362. BY REGIONAL, 2019-2035 (USD Billions)
    363. South
    364. Korea Market SIZE ESTIMATES & FORECAST, BY DEPLOYMENT TYPE, 2019-2035 (USD Billions)
    365. South Korea Market SIZE ESTIMATES & FORECAST, BY APPLICATION,
    366. 2035 (USD Billions)
    367. South Korea
    368. Market SIZE ESTIMATES & FORECAST, BY END USER, 2019-2035 (USD Billions)
    369. South Korea Market SIZE ESTIMATES & FORECAST, BY COMPONENT,
    370. 2035 (USD Billions)
    371. South Korea
    372. Market SIZE ESTIMATES & FORECAST, BY REGIONAL, 2019-2035 (USD Billions)
    373. Malaysia Market SIZE ESTIMATES & FORECAST, BY DEPLOYMENT TYPE,
    374. 2035 (USD Billions)
    375. Malaysia
    376. Market SIZE ESTIMATES & FORECAST, BY APPLICATION, 2019-2035 (USD Billions)
    377. Malaysia Market SIZE ESTIMATES & FORECAST, BY END USER, 2019-2035
    378. (USD Billions)
    379. Malaysia Market SIZE ESTIMATES & FORECAST,
    380. BY COMPONENT, 2019-2035 (USD Billions)
    381. Malaysia
    382. Market SIZE ESTIMATES & FORECAST, BY REGIONAL, 2019-2035 (USD Billions)
    383. Thailand Market SIZE ESTIMATES & FORECAST, BY DEPLOYMENT TYPE,
    384. 2035 (USD Billions)
    385. Thailand
    386. Market SIZE ESTIMATES & FORECAST, BY APPLICATION, 2019-2035 (USD Billions)
    387. Thailand Market SIZE ESTIMATES & FORECAST, BY END USER, 2019-2035
    388. (USD Billions)
    389. Thailand Market SIZE ESTIMATES & FORECAST,
    390. BY COMPONENT, 2019-2035 (USD Billions)
    391. Thailand
    392. Market SIZE ESTIMATES & FORECAST, BY REGIONAL, 2019-2035 (USD Billions)
    393. Indonesia Market SIZE ESTIMATES & FORECAST, BY DEPLOYMENT TYPE,
    394. 2035 (USD Billions)
    395. Indonesia
    396. Market SIZE ESTIMATES & FORECAST, BY APPLICATION, 2019-2035 (USD Billions)
    397. Indonesia Market SIZE ESTIMATES & FORECAST, BY END USER, 2019-2035
    398. (USD Billions)
    399. Indonesia Market SIZE ESTIMATES & FORECAST,
    400. BY COMPONENT, 2019-2035 (USD Billions)
    401. Indonesia
    402. Market SIZE ESTIMATES & FORECAST, BY REGIONAL, 2019-2035 (USD Billions)
    403. Rest of APAC Market SIZE ESTIMATES & FORECAST, BY DEPLOYMENT
    404. TYPE, 2019-2035 (USD Billions)
    405. Rest
    406. of APAC Market SIZE ESTIMATES & FORECAST, BY APPLICATION, 2019-2035 (USD Billions)
    407. Rest of APAC Market SIZE ESTIMATES & FORECAST, BY END USER,
    408. 2035 (USD Billions)
    409. Rest of APAC
    410. Market SIZE ESTIMATES & FORECAST, BY COMPONENT, 2019-2035 (USD Billions)
    411. Rest of APAC Market SIZE ESTIMATES & FORECAST, BY REGIONAL,
    412. 2035 (USD Billions)
    413. South America
    414. Market SIZE ESTIMATES & FORECAST, BY DEPLOYMENT TYPE, 2019-2035 (USD Billions)
    415. South America Market SIZE ESTIMATES & FORECAST, BY APPLICATION,
    416. 2035 (USD Billions)
    417. South America
    418. Market SIZE ESTIMATES & FORECAST, BY END USER, 2019-2035 (USD Billions)
    419. South America Market SIZE ESTIMATES & FORECAST, BY COMPONENT,
    420. 2035 (USD Billions)
    421. South America
    422. Market SIZE ESTIMATES & FORECAST, BY REGIONAL, 2019-2035 (USD Billions)
    423. Brazil Market SIZE ESTIMATES & FORECAST, BY DEPLOYMENT TYPE,
    424. 2035 (USD Billions)
    425. Brazil Market
    426. SIZE ESTIMATES & FORECAST, BY APPLICATION, 2019-2035 (USD Billions)
    427. Brazil
    428. Market SIZE ESTIMATES & FORECAST, BY END USER, 2019-2035 (USD Billions)
    429. Brazil Market SIZE ESTIMATES & FORECAST, BY COMPONENT, 2019-2035
    430. (USD Billions)
    431. Brazil Market SIZE ESTIMATES & FORECAST,
    432. BY REGIONAL, 2019-2035 (USD Billions)
    433. Mexico
    434. Market SIZE ESTIMATES & FORECAST, BY DEPLOYMENT TYPE, 2019-2035 (USD Billions)
    435. Mexico Market SIZE ESTIMATES & FORECAST, BY APPLICATION, 2019-2035
    436. (USD Billions)
    437. Mexico Market SIZE ESTIMATES & FORECAST,
    438. BY END USER, 2019-2035 (USD Billions)
    439. Mexico
    440. Market SIZE ESTIMATES & FORECAST, BY COMPONENT, 2019-2035 (USD Billions)
    441. Mexico Market SIZE ESTIMATES & FORECAST, BY REGIONAL, 2019-2035
    442. (USD Billions)
    443. Argentina Market SIZE ESTIMATES & FORECAST,
    444. BY DEPLOYMENT TYPE, 2019-2035 (USD Billions)
    445. Argentina
    446. Market SIZE ESTIMATES & FORECAST, BY APPLICATION, 2019-2035 (USD Billions)
    447. Argentina Market SIZE ESTIMATES & FORECAST, BY END USER, 2019-2035
    448. (USD Billions)
    449. Argentina Market SIZE ESTIMATES & FORECAST,
    450. BY COMPONENT, 2019-2035 (USD Billions)
    451. Argentina
    452. Market SIZE ESTIMATES & FORECAST, BY REGIONAL, 2019-2035 (USD Billions)
    453. Rest of South America Market SIZE ESTIMATES & FORECAST, BY DEPLOYMENT
    454. TYPE, 2019-2035 (USD Billions)
    455. Rest
    456. of South America Market SIZE ESTIMATES & FORECAST, BY APPLICATION, 2019-2035
    457. (USD Billions)
    458. Rest of South America Market SIZE ESTIMATES
    459. & FORECAST, BY END USER, 2019-2035 (USD Billions)
    460. Rest
    461. of South America Market SIZE ESTIMATES & FORECAST, BY COMPONENT, 2019-2035 (USD
    462. Billions)
    463. Rest of South America Market SIZE ESTIMATES
    464. & FORECAST, BY REGIONAL, 2019-2035 (USD Billions)
    465. MEA
    466. Market SIZE ESTIMATES & FORECAST, BY DEPLOYMENT TYPE, 2019-2035 (USD Billions)
    467. MEA Market SIZE ESTIMATES & FORECAST, BY APPLICATION, 2019-2035
    468. (USD Billions)
    469. MEA Market SIZE ESTIMATES & FORECAST, BY
    470. END USER, 2019-2035 (USD Billions)
    471. MEA
    472. Market SIZE ESTIMATES & FORECAST, BY COMPONENT, 2019-2035 (USD Billions)
    473. MEA Market SIZE ESTIMATES & FORECAST, BY REGIONAL, 2019-2035
    474. (USD Billions)
    475. GCC Countries Market SIZE ESTIMATES & FORECAST,
    476. BY DEPLOYMENT TYPE, 2019-2035 (USD Billions)
    477. GCC
    478. Countries Market SIZE ESTIMATES & FORECAST, BY APPLICATION, 2019-2035 (USD Billions)
    479. GCC Countries Market SIZE ESTIMATES & FORECAST, BY END USER,
    480. 2035 (USD Billions)
    481. GCC Countries
    482. Market SIZE ESTIMATES & FORECAST, BY COMPONENT, 2019-2035 (USD Billions)
    483. GCC Countries Market SIZE ESTIMATES & FORECAST, BY REGIONAL,
    484. 2035 (USD Billions)
    485. South Africa
    486. Market SIZE ESTIMATES & FORECAST, BY DEPLOYMENT TYPE, 2019-2035 (USD Billions)
    487. South Africa Market SIZE ESTIMATES & FORECAST, BY APPLICATION,
    488. 2035 (USD Billions)
    489. South Africa
    490. Market SIZE ESTIMATES & FORECAST, BY END USER, 2019-2035 (USD Billions)
    491. South Africa Market SIZE ESTIMATES & FORECAST, BY COMPONENT,
    492. 2035 (USD Billions)
    493. South Africa
    494. Market SIZE ESTIMATES & FORECAST, BY REGIONAL, 2019-2035 (USD Billions)
    495. Rest of MEA Market SIZE ESTIMATES & FORECAST, BY DEPLOYMENT
    496. TYPE, 2019-2035 (USD Billions)
    497. Rest
    498. of MEA Market SIZE ESTIMATES & FORECAST, BY APPLICATION, 2019-2035 (USD Billions)
    499. Rest of MEA Market SIZE ESTIMATES & FORECAST, BY END USER, 2019-2035
    500. (USD Billions)
    501. Rest of MEA Market SIZE ESTIMATES & FORECAST,
    502. BY COMPONENT, 2019-2035 (USD Billions)
    503. Rest
    504. of MEA Market SIZE ESTIMATES & FORECAST, BY REGIONAL, 2019-2035 (USD Billions)
    505. PRODUCT LAUNCH/PRODUCT DEVELOPMENT/APPROVAL
    506. ACQUISITION/PARTNERSHIP
    507. MARKET SYNOPSIS
    508. NORTH AMERICA MARKET ANALYSIS
    509. US MARKET ANALYSIS BY DEPLOYMENT TYPE
    510. US MARKET ANALYSIS
    511. BY APPLICATION
    512. US
    513. MARKET ANALYSIS BY END USER
    514. US MARKET ANALYSIS BY COMPONENT
    515. US MARKET ANALYSIS BY REGIONAL
    516. CANADA MARKET ANALYSIS BY DEPLOYMENT
    517. TYPE
    518. CANADA
    519. MARKET ANALYSIS BY APPLICATION
    520. CANADA MARKET ANALYSIS BY END USER
    521. CANADA MARKET ANALYSIS BY COMPONENT
    522. CANADA MARKET ANALYSIS BY REGIONAL
    523. EUROPE MARKET ANALYSIS
    524. GERMANY MARKET ANALYSIS BY DEPLOYMENT
    525. TYPE
    526. GERMANY
    527. MARKET ANALYSIS BY APPLICATION
    528. GERMANY MARKET ANALYSIS BY END USER
    529. GERMANY MARKET ANALYSIS BY COMPONENT
    530. GERMANY MARKET
    531. ANALYSIS BY REGIONAL
    532. UK
    533. MARKET ANALYSIS BY DEPLOYMENT TYPE
    534. UK MARKET ANALYSIS BY APPLICATION
    535. UK MARKET ANALYSIS BY END USER
    536. UK MARKET ANALYSIS BY COMPONENT
    537. UK MARKET ANALYSIS BY REGIONAL
    538. FRANCE MARKET ANALYSIS BY DEPLOYMENT
    539. TYPE
    540. FRANCE
    541. MARKET ANALYSIS BY APPLICATION
    542. FRANCE MARKET ANALYSIS BY END USER
    543. FRANCE MARKET ANALYSIS BY COMPONENT
    544. FRANCE MARKET ANALYSIS BY REGIONAL
    545. RUSSIA MARKET ANALYSIS BY DEPLOYMENT
    546. TYPE
    547. RUSSIA
    548. MARKET ANALYSIS BY APPLICATION
    549. RUSSIA MARKET ANALYSIS BY END USER
    550. RUSSIA MARKET ANALYSIS BY COMPONENT
    551. RUSSIA MARKET ANALYSIS BY REGIONAL
    552. ITALY MARKET ANALYSIS BY DEPLOYMENT TYPE
    553. ITALY MARKET
    554. ANALYSIS BY APPLICATION
    555. ITALY MARKET ANALYSIS BY END USER
    556. ITALY MARKET ANALYSIS BY COMPONENT
    557. ITALY MARKET ANALYSIS BY REGIONAL
    558. SPAIN MARKET ANALYSIS BY DEPLOYMENT TYPE
    559. SPAIN MARKET
    560. ANALYSIS BY APPLICATION
    561. SPAIN MARKET ANALYSIS BY END USER
    562. SPAIN MARKET ANALYSIS BY COMPONENT
    563. SPAIN MARKET ANALYSIS BY REGIONAL
    564. REST OF EUROPE MARKET ANALYSIS BY DEPLOYMENT
    565. TYPE
    566. REST
    567. OF EUROPE MARKET ANALYSIS BY APPLICATION
    568. REST OF EUROPE MARKET ANALYSIS BY END
    569. USER
    570. REST
    571. OF EUROPE MARKET ANALYSIS BY COMPONENT
    572. REST OF EUROPE MARKET ANALYSIS BY REGIONAL
    573. APAC MARKET ANALYSIS
    574. CHINA MARKET
    575. ANALYSIS BY DEPLOYMENT TYPE
    576. CHINA MARKET ANALYSIS BY APPLICATION
    577. CHINA MARKET ANALYSIS BY END USER
    578. CHINA MARKET ANALYSIS BY COMPONENT
    579. CHINA MARKET ANALYSIS BY REGIONAL
    580. INDIA MARKET ANALYSIS BY DEPLOYMENT TYPE
    581. INDIA MARKET
    582. ANALYSIS BY APPLICATION
    583. INDIA MARKET ANALYSIS BY END USER
    584. INDIA MARKET ANALYSIS BY COMPONENT
    585. INDIA MARKET ANALYSIS BY REGIONAL
    586. JAPAN MARKET ANALYSIS BY DEPLOYMENT TYPE
    587. JAPAN MARKET
    588. ANALYSIS BY APPLICATION
    589. JAPAN MARKET ANALYSIS BY END USER
    590. JAPAN MARKET ANALYSIS BY COMPONENT
    591. JAPAN MARKET ANALYSIS BY REGIONAL
    592. SOUTH KOREA MARKET ANALYSIS BY DEPLOYMENT
    593. TYPE
    594. SOUTH
    595. KOREA MARKET ANALYSIS BY APPLICATION
    596. SOUTH KOREA MARKET ANALYSIS BY END USER
    597. SOUTH KOREA MARKET ANALYSIS BY COMPONENT
    598. SOUTH KOREA MARKET
    599. ANALYSIS BY REGIONAL
    600. MALAYSIA
    601. MARKET ANALYSIS BY DEPLOYMENT TYPE
    602. MALAYSIA MARKET ANALYSIS BY APPLICATION
    603. MALAYSIA MARKET ANALYSIS BY END USER
    604. MALAYSIA MARKET
    605. ANALYSIS BY COMPONENT
    606. MALAYSIA
    607. MARKET ANALYSIS BY REGIONAL
    608. THAILAND MARKET ANALYSIS BY DEPLOYMENT TYPE
    609. THAILAND MARKET ANALYSIS BY APPLICATION
    610. THAILAND MARKET
    611. ANALYSIS BY END USER
    612. THAILAND
    613. MARKET ANALYSIS BY COMPONENT
    614. THAILAND MARKET ANALYSIS BY REGIONAL
    615. INDONESIA MARKET ANALYSIS BY DEPLOYMENT
    616. TYPE
    617. INDONESIA
    618. MARKET ANALYSIS BY APPLICATION
    619. INDONESIA MARKET ANALYSIS BY END USER
    620. INDONESIA MARKET ANALYSIS BY COMPONENT
    621. INDONESIA MARKET
    622. ANALYSIS BY REGIONAL
    623. REST
    624. OF APAC MARKET ANALYSIS BY DEPLOYMENT TYPE
    625. REST OF APAC MARKET ANALYSIS BY APPLICATION
    626. REST OF APAC
    627. MARKET ANALYSIS BY END USER
    628. REST OF APAC MARKET ANALYSIS BY COMPONENT
    629. REST OF APAC MARKET ANALYSIS BY REGIONAL
    630. SOUTH AMERICA
    631. MARKET ANALYSIS
    632. BRAZIL
    633. MARKET ANALYSIS BY DEPLOYMENT TYPE
    634. BRAZIL MARKET ANALYSIS BY APPLICATION
    635. BRAZIL MARKET ANALYSIS BY END USER
    636. BRAZIL MARKET ANALYSIS BY COMPONENT
    637. BRAZIL MARKET ANALYSIS BY REGIONAL
    638. MEXICO MARKET ANALYSIS BY DEPLOYMENT
    639. TYPE
    640. MEXICO
    641. MARKET ANALYSIS BY APPLICATION
    642. MEXICO MARKET ANALYSIS BY END USER
    643. MEXICO MARKET ANALYSIS BY COMPONENT
    644. MEXICO MARKET ANALYSIS BY REGIONAL
    645. ARGENTINA MARKET ANALYSIS BY DEPLOYMENT
    646. TYPE
    647. ARGENTINA
    648. MARKET ANALYSIS BY APPLICATION
    649. ARGENTINA MARKET ANALYSIS BY END USER
    650. ARGENTINA MARKET ANALYSIS BY COMPONENT
    651. ARGENTINA MARKET
    652. ANALYSIS BY REGIONAL
    653. REST
    654. OF SOUTH AMERICA MARKET ANALYSIS BY DEPLOYMENT TYPE
    655. REST OF SOUTH AMERICA MARKET ANALYSIS
    656. BY APPLICATION
    657. REST
    658. OF SOUTH AMERICA MARKET ANALYSIS BY END USER
    659. REST OF SOUTH AMERICA MARKET ANALYSIS
    660. BY COMPONENT
    661. REST
    662. OF SOUTH AMERICA MARKET ANALYSIS BY REGIONAL
    663. MEA MARKET ANALYSIS
    664. GCC COUNTRIES MARKET ANALYSIS BY DEPLOYMENT
    665. TYPE
    666. GCC
    667. COUNTRIES MARKET ANALYSIS BY APPLICATION
    668. GCC COUNTRIES MARKET ANALYSIS BY END
    669. USER
    670. GCC
    671. COUNTRIES MARKET ANALYSIS BY COMPONENT
    672. GCC COUNTRIES MARKET ANALYSIS BY REGIONAL
    673. SOUTH AFRICA
    674. MARKET ANALYSIS BY DEPLOYMENT TYPE
    675. SOUTH AFRICA MARKET ANALYSIS BY APPLICATION
    676. SOUTH AFRICA MARKET ANALYSIS BY END USER
    677. SOUTH AFRICA
    678. MARKET ANALYSIS BY COMPONENT
    679. SOUTH AFRICA MARKET ANALYSIS BY REGIONAL
    680. REST OF MEA MARKET ANALYSIS BY DEPLOYMENT
    681. TYPE
    682. REST
    683. OF MEA MARKET ANALYSIS BY APPLICATION
    684. REST OF MEA MARKET ANALYSIS BY END USER
    685. REST OF MEA MARKET
    686. ANALYSIS BY COMPONENT
    687. REST
    688. OF MEA MARKET ANALYSIS BY REGIONAL
    689. KEY BUYING CRITERIA OF PROCUREMENT ANALYTICS MARKET
    690. RESEARCH PROCESS
    691. OF MRFR
    692. DRO
    693. ANALYSIS OF PROCUREMENT ANALYTICS MARKET
    694. DRIVERS IMPACT ANALYSIS: PROCUREMENT
    695. ANALYTICS MARKET
    696. RESTRAINTS
    697. IMPACT ANALYSIS: PROCUREMENT ANALYTICS MARKET
    698. SUPPLY / VALUE CHAIN: PROCUREMENT ANALYTICS
    699. MARKET
    700. PROCUREMENT
    701. ANALYTICS MARKET, BY DEPLOYMENT TYPE, 2025 (% SHARE)
    702. PROCUREMENT ANALYTICS MARKET, BY DEPLOYMENT
    703. TYPE, 2019 TO 2035 (USD Billions)
    704. PROCUREMENT ANALYTICS MARKET, BY APPLICATION, 2025 (%
    705. SHARE)
    706. PROCUREMENT
    707. ANALYTICS MARKET, BY APPLICATION, 2019 TO 2035 (USD Billions)
    708. PROCUREMENT ANALYTICS MARKET, BY END
    709. USER, 2025 (% SHARE)
    710. PROCUREMENT
    711. ANALYTICS MARKET, BY END USER, 2019 TO 2035 (USD Billions)
    712. PROCUREMENT ANALYTICS MARKET, BY COMPONENT,
    713. (% SHARE)
    714. PROCUREMENT
    715. ANALYTICS MARKET, BY COMPONENT, 2019 TO 2035 (USD Billions)
    716. PROCUREMENT ANALYTICS MARKET, BY REGIONAL,
    717. (% SHARE)
    718. PROCUREMENT
    719. ANALYTICS MARKET, BY REGIONAL, 2019 TO 2035 (USD Billions)
    720. BENCHMARKING OF MAJOR COMPETITORS

    Procurement Analytics Market Segmentation

    • Procurement Analytics Market By Deployment Type (USD Billion, 2019-2035)
      • Cloud
      • On-premises
      • Hybrid


    • Procurement Analytics Market By Application (USD Billion, 2019-2035)
      • Spend Analysis
      • Supplier Performance Analysis
      • Contract Management
      • Risk Management


    • Procurement Analytics Market By End User (USD Billion, 2019-2035)
      • Retail
      • Manufacturing
      • Healthcare
      • IT
      • Telecommunications


    • Procurement Analytics Market By Component (USD Billion, 2019-2035)
      • Software
      • Services


    • Procurement Analytics Market By Regional (USD Billion, 2019-2035)
      • North America
      • Europe
      • South America
      • Asia Pacific
      • Middle East and Africa


    Procurement Analytics Market Regional Outlook (USD Billion, 2019-2035)


    • North America Outlook (USD Billion, 2019-2035)
      • North America Market by Deployment Type
        • Cloud
        • On-premises
        • Hybrid
      • North America Market by Application Type
        • Spend Analysis
        • Supplier Performance Analysis
        • Contract Management
        • Risk Management
      • North America Market by End User Type
        • Retail
        • Manufacturing
        • Healthcare
        • IT
        • Telecommunications
      • North America Market by Component Type
        • Software
        • Services
      • North America Market by Regional Type
        • US
        • Canada
      • US Outlook (USD Billion, 2019-2035)
      • US Market by Deployment Type
        • Cloud
        • On-premises
        • Hybrid
      • US Market by Application Type
        • Spend Analysis
        • Supplier Performance Analysis
        • Contract Management
        • Risk Management
      • US Market by End User Type
        • Retail
        • Manufacturing
        • Healthcare
        • IT
        • Telecommunications
      • US Market by Component Type
        • Software
        • Services
      • CANADA Outlook (USD Billion, 2019-2035)
      • CANADA Market by Deployment Type
        • Cloud
        • On-premises
        • Hybrid
      • CANADA Market by Application Type
        • Spend Analysis
        • Supplier Performance Analysis
        • Contract Management
        • Risk Management
      • CANADA Market by End User Type
        • Retail
        • Manufacturing
        • Healthcare
        • IT
        • Telecommunications
      • CANADA Market by Component Type
        • Software
        • Services
      • Europe Outlook (USD Billion, 2019-2035)
        • Europe Market by Deployment Type
          • Cloud
          • On-premises
          • Hybrid
        • Europe Market by Application Type
          • Spend Analysis
          • Supplier Performance Analysis
          • Contract Management
          • Risk Management
        • Europe Market by End User Type
          • Retail
          • Manufacturing
          • Healthcare
          • IT
          • Telecommunications
        • Europe Market by Component Type
          • Software
          • Services
        • Europe Market by Regional Type
          • Germany
          • UK
          • France
          • Russia
          • Italy
          • Spain
          • Rest of Europe
        • GERMANY Outlook (USD Billion, 2019-2035)
        • GERMANY Market by Deployment Type
          • Cloud
          • On-premises
          • Hybrid
        • GERMANY Market by Application Type
          • Spend Analysis
          • Supplier Performance Analysis
          • Contract Management
          • Risk Management
        • GERMANY Market by End User Type
          • Retail
          • Manufacturing
          • Healthcare
          • IT
          • Telecommunications
        • GERMANY Market by Component Type
          • Software
          • Services
        • UK Outlook (USD Billion, 2019-2035)
        • UK Market by Deployment Type
          • Cloud
          • On-premises
          • Hybrid
        • UK Market by Application Type
          • Spend Analysis
          • Supplier Performance Analysis
          • Contract Management
          • Risk Management
        • UK Market by End User Type
          • Retail
          • Manufacturing
          • Healthcare
          • IT
          • Telecommunications
        • UK Market by Component Type
          • Software
          • Services
        • FRANCE Outlook (USD Billion, 2019-2035)
        • FRANCE Market by Deployment Type
          • Cloud
          • On-premises
          • Hybrid
        • FRANCE Market by Application Type
          • Spend Analysis
          • Supplier Performance Analysis
          • Contract Management
          • Risk Management
        • FRANCE Market by End User Type
          • Retail
          • Manufacturing
          • Healthcare
          • IT
          • Telecommunications
        • FRANCE Market by Component Type
          • Software
          • Services
        • RUSSIA Outlook (USD Billion, 2019-2035)
        • RUSSIA Market by Deployment Type
          • Cloud
          • On-premises
          • Hybrid
        • RUSSIA Market by Application Type
          • Spend Analysis
          • Supplier Performance Analysis
          • Contract Management
          • Risk Management
        • RUSSIA Market by End User Type
          • Retail
          • Manufacturing
          • Healthcare
          • IT
          • Telecommunications
        • RUSSIA Market by Component Type
          • Software
          • Services
        • ITALY Outlook (USD Billion, 2019-2035)
        • ITALY Market by Deployment Type
          • Cloud
          • On-premises
          • Hybrid
        • ITALY Market by Application Type
          • Spend Analysis
          • Supplier Performance Analysis
          • Contract Management
          • Risk Management
        • ITALY Market by End User Type
          • Retail
          • Manufacturing
          • Healthcare
          • IT
          • Telecommunications
        • ITALY Market by Component Type
          • Software
          • Services
        • SPAIN Outlook (USD Billion, 2019-2035)
        • SPAIN Market by Deployment Type
          • Cloud
          • On-premises
          • Hybrid
        • SPAIN Market by Application Type
          • Spend Analysis
          • Supplier Performance Analysis
          • Contract Management
          • Risk Management
        • SPAIN Market by End User Type
          • Retail
          • Manufacturing
          • Healthcare
          • IT
          • Telecommunications
        • SPAIN Market by Component Type
          • Software
          • Services
        • REST OF EUROPE Outlook (USD Billion, 2019-2035)
        • REST OF EUROPE Market by Deployment Type
          • Cloud
          • On-premises
          • Hybrid
        • REST OF EUROPE Market by Application Type
          • Spend Analysis
          • Supplier Performance Analysis
          • Contract Management
          • Risk Management
        • REST OF EUROPE Market by End User Type
          • Retail
          • Manufacturing
          • Healthcare
          • IT
          • Telecommunications
        • REST OF EUROPE Market by Component Type
          • Software
          • Services
        • APAC Outlook (USD Billion, 2019-2035)
          • APAC Market by Deployment Type
            • Cloud
            • On-premises
            • Hybrid
          • APAC Market by Application Type
            • Spend Analysis
            • Supplier Performance Analysis
            • Contract Management
            • Risk Management
          • APAC Market by End User Type
            • Retail
            • Manufacturing
            • Healthcare
            • IT
            • Telecommunications
          • APAC Market by Component Type
            • Software
            • Services
          • APAC Market by Regional Type
            • China
            • India
            • Japan
            • South Korea
            • Malaysia
            • Thailand
            • Indonesia
            • Rest of APAC
          • CHINA Outlook (USD Billion, 2019-2035)
          • CHINA Market by Deployment Type
            • Cloud
            • On-premises
            • Hybrid
          • CHINA Market by Application Type
            • Spend Analysis
            • Supplier Performance Analysis
            • Contract Management
            • Risk Management
          • CHINA Market by End User Type
            • Retail
            • Manufacturing
            • Healthcare
            • IT
            • Telecommunications
          • CHINA Market by Component Type
            • Software
            • Services
          • INDIA Outlook (USD Billion, 2019-2035)
          • INDIA Market by Deployment Type
            • Cloud
            • On-premises
            • Hybrid
          • INDIA Market by Application Type
            • Spend Analysis
            • Supplier Performance Analysis
            • Contract Management
            • Risk Management
          • INDIA Market by End User Type
            • Retail
            • Manufacturing
            • Healthcare
            • IT
            • Telecommunications
          • INDIA Market by Component Type
            • Software
            • Services
          • JAPAN Outlook (USD Billion, 2019-2035)
          • JAPAN Market by Deployment Type
            • Cloud
            • On-premises
            • Hybrid
          • JAPAN Market by Application Type
            • Spend Analysis
            • Supplier Performance Analysis
            • Contract Management
            • Risk Management
          • JAPAN Market by End User Type
            • Retail
            • Manufacturing
            • Healthcare
            • IT
            • Telecommunications
          • JAPAN Market by Component Type
            • Software
            • Services
          • SOUTH KOREA Outlook (USD Billion, 2019-2035)
          • SOUTH KOREA Market by Deployment Type
            • Cloud
            • On-premises
            • Hybrid
          • SOUTH KOREA Market by Application Type
            • Spend Analysis
            • Supplier Performance Analysis
            • Contract Management
            • Risk Management
          • SOUTH KOREA Market by End User Type
            • Retail
            • Manufacturing
            • Healthcare
            • IT
            • Telecommunications
          • SOUTH KOREA Market by Component Type
            • Software
            • Services
          • MALAYSIA Outlook (USD Billion, 2019-2035)
          • MALAYSIA Market by Deployment Type
            • Cloud
            • On-premises
            • Hybrid
          • MALAYSIA Market by Application Type
            • Spend Analysis
            • Supplier Performance Analysis
            • Contract Management
            • Risk Management
          • MALAYSIA Market by End User Type
            • Retail
            • Manufacturing
            • Healthcare
            • IT
            • Telecommunications
          • MALAYSIA Market by Component Type
            • Software
            • Services
          • THAILAND Outlook (USD Billion, 2019-2035)
          • THAILAND Market by Deployment Type
            • Cloud
            • On-premises
            • Hybrid
          • THAILAND Market by Application Type
            • Spend Analysis
            • Supplier Performance Analysis
            • Contract Management
            • Risk Management
          • THAILAND Market by End User Type
            • Retail
            • Manufacturing
            • Healthcare
            • IT
            • Telecommunications
          • THAILAND Market by Component Type
            • Software
            • Services
          • INDONESIA Outlook (USD Billion, 2019-2035)
          • INDONESIA Market by Deployment Type
            • Cloud
            • On-premises
            • Hybrid
          • INDONESIA Market by Application Type
            • Spend Analysis
            • Supplier Performance Analysis
            • Contract Management
            • Risk Management
          • INDONESIA Market by End User Type
            • Retail
            • Manufacturing
            • Healthcare
            • IT
            • Telecommunications
          • INDONESIA Market by Component Type
            • Software
            • Services
          • REST OF APAC Outlook (USD Billion, 2019-2035)
          • REST OF APAC Market by Deployment Type
            • Cloud
            • On-premises
            • Hybrid
          • REST OF APAC Market by Application Type
            • Spend Analysis
            • Supplier Performance Analysis
            • Contract Management
            • Risk Management
          • REST OF APAC Market by End User Type
            • Retail
            • Manufacturing
            • Healthcare
            • IT
            • Telecommunications
          • REST OF APAC Market by Component Type
            • Software
            • Services
          • South America Outlook (USD Billion, 2019-2035)
            • South America Market by Deployment Type
              • Cloud
              • On-premises
              • Hybrid
            • South America Market by Application Type
              • Spend Analysis
              • Supplier Performance Analysis
              • Contract Management
              • Risk Management
            • South America Market by End User Type
              • Retail
              • Manufacturing
              • Healthcare
              • IT
              • Telecommunications
            • South America Market by Component Type
              • Software
              • Services
            • South America Market by Regional Type
              • Brazil
              • Mexico
              • Argentina
              • Rest of South America
            • BRAZIL Outlook (USD Billion, 2019-2035)
            • BRAZIL Market by Deployment Type
              • Cloud
              • On-premises
              • Hybrid
            • BRAZIL Market by Application Type
              • Spend Analysis
              • Supplier Performance Analysis
              • Contract Management
              • Risk Management
            • BRAZIL Market by End User Type
              • Retail
              • Manufacturing
              • Healthcare
              • IT
              • Telecommunications
            • BRAZIL Market by Component Type
              • Software
              • Services
            • MEXICO Outlook (USD Billion, 2019-2035)
            • MEXICO Market by Deployment Type
              • Cloud
              • On-premises
              • Hybrid
            • MEXICO Market by Application Type
              • Spend Analysis
              • Supplier Performance Analysis
              • Contract Management
              • Risk Management
            • MEXICO Market by End User Type
              • Retail
              • Manufacturing
              • Healthcare
              • IT
              • Telecommunications
            • MEXICO Market by Component Type
              • Software
              • Services
            • ARGENTINA Outlook (USD Billion, 2019-2035)
            • ARGENTINA Market by Deployment Type
              • Cloud
              • On-premises
              • Hybrid
            • ARGENTINA Market by Application Type
              • Spend Analysis
              • Supplier Performance Analysis
              • Contract Management
              • Risk Management
            • ARGENTINA Market by End User Type
              • Retail
              • Manufacturing
              • Healthcare
              • IT
              • Telecommunications
            • ARGENTINA Market by Component Type
              • Software
              • Services
            • REST OF SOUTH AMERICA Outlook (USD Billion, 2019-2035)
            • REST OF SOUTH AMERICA Market by Deployment Type
              • Cloud
              • On-premises
              • Hybrid
            • REST OF SOUTH AMERICA Market by Application Type
              • Spend Analysis
              • Supplier Performance Analysis
              • Contract Management
              • Risk Management
            • REST OF SOUTH AMERICA Market by End User Type
              • Retail
              • Manufacturing
              • Healthcare
              • IT
              • Telecommunications
            • REST OF SOUTH AMERICA Market by Component Type
              • Software
              • Services
            • MEA Outlook (USD Billion, 2019-2035)
              • MEA Market by Deployment Type
                • Cloud
                • On-premises
                • Hybrid
              • MEA Market by Application Type
                • Spend Analysis
                • Supplier Performance Analysis
                • Contract Management
                • Risk Management
              • MEA Market by End User Type
                • Retail
                • Manufacturing
                • Healthcare
                • IT
                • Telecommunications
              • MEA Market by Component Type
                • Software
                • Services
              • MEA Market by Regional Type
                • GCC Countries
                • South Africa
                • Rest of MEA
              • GCC COUNTRIES Outlook (USD Billion, 2019-2035)
              • GCC COUNTRIES Market by Deployment Type
                • Cloud
                • On-premises
                • Hybrid
              • GCC COUNTRIES Market by Application Type
                • Spend Analysis
                • Supplier Performance Analysis
                • Contract Management
                • Risk Management
              • GCC COUNTRIES Market by End User Type
                • Retail
                • Manufacturing
                • Healthcare
                • IT
                • Telecommunications
              • GCC COUNTRIES Market by Component Type
                • Software
                • Services
              • SOUTH AFRICA Outlook (USD Billion, 2019-2035)
              • SOUTH AFRICA Market by Deployment Type
                • Cloud
                • On-premises
                • Hybrid
              • SOUTH AFRICA Market by Application Type
                • Spend Analysis
                • Supplier Performance Analysis
                • Contract Management
                • Risk Management
              • SOUTH AFRICA Market by End User Type
                • Retail
                • Manufacturing
                • Healthcare
                • IT
                • Telecommunications
              • SOUTH AFRICA Market by Component Type
                • Software
                • Services
              • REST OF MEA Outlook (USD Billion, 2019-2035)
              • REST OF MEA Market by Deployment Type
                • Cloud
                • On-premises
                • Hybrid
              • REST OF MEA Market by Application Type
                • Spend Analysis
                • Supplier Performance Analysis
                • Contract Management
                • Risk Management
              • REST OF MEA Market by End User Type
                • Retail
                • Manufacturing
                • Healthcare
                • IT
                • Telecommunications
              • REST OF MEA Market by Component Type
                • Software
                • Services


    Procurement Analytics Market Research Report-Forecast to 2035 Infographic
    Free Sample Request

    Kindly complete the form below to receive a free sample of this Report

    Customer Strories

    “I am very pleased with how market segments have been defined in a relevant way for my purposes (such as "Portable Freezers & refrigerators" and "last-mile"). In general the report is well structured. Thanks very much for your efforts.”

    Victoria Milne Founder
    Case Study

    Chemicals and Materials