• Cat-intel
  • MedIntelliX
  • Resources
  • About Us
  • Hero Background
    English
    Chinese
    French
    Japanese
    Korean
    German
    Spanish

    Pickleball Equipment Market Analysis

    ID: MRFR/CR/10968-HCR
    128 Pages
    Pradeep Nandi
    October 2025

    Pickleball Equipment Market Research Report Information By Product (Paddles, Wood, Graphite & Composite, Balls, Indoor Play, Outdoor Play, and Accessories), By Sales Channel (Independent Sports Outlets, Franchised Sports Outlets, Modern Retail, and Online Retail), By Buyer (Individual, Institutional, and Promotional) And By Region (North America, Europe, Asia-Pacific, And Rest Of The World)...

    Share:
    Download PDF ×

    We do not share your information with anyone. However, we may send you emails based on your report interest from time to time. You may contact us at any time to opt-out.

    Pickleball Equipment Market Infographic
    Purchase Options

    Market Analysis

    In-depth Analysis of Pickleball Equipment Market Industry Landscape

    Graphite, renowned for its exceptional conductivity and remarkable lubricating properties, plays a pivotal role in various industries, particularly making substantial contributions to the automotive sector. Its high natural lubrication and lightweight characteristics position graphite as a key material in the manufacturing of diverse automotive components. This versatile substance finds application in critical automotive elements such as gaskets, clutch materials, engines, exhaust systems, and cylinder heads. In the automotive industry's historical context, asbestos stood as the primary component in brake pad linings. However, due to concerns regarding asbestos-related health risks, there arose a need for safer alternatives. Graphite emerged as a highly effective replacement for asbestos in brake pads, presenting additional advantages such as facilitating low-noise braking. This transition not only addresses health and safety concerns but also enhances the overall performance and efficiency of braking systems. Beyond its role in traditional automotive components, graphite assumes a critical position in the production of ultra-lightweight carbon-fiber reinforced plastic (CFRP). While CFRP initially found predominant use in the aerospace and Formula One automotive sectors, its popularity has expanded to the passenger car industry. The lightweight nature of CFRP contributes significantly to reducing fuel consumption and lowering CO2 emissions, aligning with the growing emphasis on sustainable and environmentally friendly automotive solutions. An illustrative example of this trend is the collaboration announced in September 2011 between the SGL Group, a Germany-based carbon graphite company, and the BMW Group. This joint venture aimed to produce CFRPs for BMW's innovative i series of electric vehicles, leveraging the lightweight and durable qualities of graphite-infused materials. Such partnerships signify the integration of advanced materials, like graphite, into the automotive landscape, driving the development of cutting-edge electric vehicle technologies. Furthermore, the SGL Group, in a strategic move to meet the escalating demand for CFRPs, unveiled plans in September 2014 to triple production capacities at its carbon fiber plant in Moses Lake, Washington. This expansion underscores the anticipation of increased demand for graphite, as the automotive industry continues to shift towards lightweight, high-performance materials to enhance overall efficiency and sustainability. Graphite's unique properties, including its conductivity and lubricating capabilities, make it an indispensable element in the automotive industry. Its role extends beyond traditional applications, with graphite now contributing significantly to the development of advanced materials like CFRP. As the automotive sector increasingly embraces lightweight and environmentally conscious solutions, the demand for graphite is poised to escalate. Collaborations between industry leaders and strategic expansions further emphasize the integral role of graphite in shaping the future of automotive technologies.

    Author
    Pradeep Nandi
    Senior Research Analyst

    I have a bachelor's degree in mechanical engineering and an MBA. I have more than two years of expertise in the retail, food, and beverage, chemical, and material industries, and hence have developed a sound cross-domain expertise. A firm believer in lifelong learning and sharing of knowledge. Having a proclivity for hatching ideas and trying to absorb as much information as possible in a short amount of time. Introducing corporates to the data and insight, which enables them to move from probability to possibility, has been my key areas of interest. 

    Leave a Comment

    FAQs

    What is the current valuation of the Pickleball Equipment Market?

    The Pickleball Equipment Market was valued at 71.47 USD Billion in 2024.

    What is the projected market valuation for the Pickleball Equipment Market in 2035?

    The market is projected to reach 199.91 USD Billion by 2035.

    What is the expected CAGR for the Pickleball Equipment Market from 2025 to 2035?

    The expected CAGR for the market during the forecast period 2025 - 2035 is 9.8%.

    Which product segment is anticipated to have the highest growth in the Pickleball Equipment Market?

    The Graphite & Composite paddles segment is expected to grow from 20.0 to 55.0 USD Billion.

    How do online retail sales compare to other sales channels in the Pickleball Equipment Market?

    Online retail sales are projected to increase from 28.47 to 81.91 USD Billion, leading all sales channels.

    What are the expected sales figures for indoor play equipment in the Pickleball Equipment Market?

    Indoor play equipment sales are anticipated to grow from 7.0 to 20.0 USD Billion.

    Market Summary

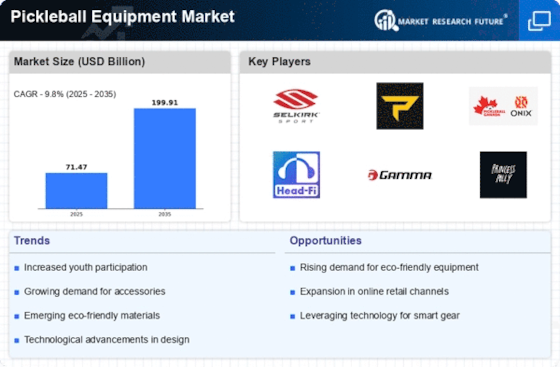
    As per MRFR analysis, the Pickleball Equipment Market Size was estimated at 71.47 USD Billion in 2024. The Pickleball Equipment industry is projected to grow from 78.48 USD Billion in 2025 to 199.91 USD Billion by 2035, exhibiting a compound annual growth rate (CAGR) of 9.8 during the forecast period 2025 - 2035.

    Key Market Trends & Highlights

    The Pickleball Equipment Market is experiencing robust growth driven by increasing participation and evolving consumer preferences.

    • The market is witnessing rising popularity among diverse age groups, particularly in North America.
    • Sustainable product offerings are gaining traction as consumers become more environmentally conscious.
    • Technological advancements in equipment design are enhancing performance and user experience, especially in the paddle segment.
    • Increased participation in recreational sports and the expansion of pickleball facilities are major drivers propelling market growth.

    Market Size & Forecast

    2024 Market Size 71.47 (USD Billion)
    2035 Market Size 199.91 (USD Billion)
    CAGR (2025 - 2035) 9.8%
    Largest Regional Market Share in 2024 North America

    Major Players

    <p>Selkirk Sport (US), Paddletek (US), ONIX Pickleball (US), Head (AT), Gamma Sports (US), Prince (US), Wilson Sporting Goods (US), Babolat (FR)</p>

    Market Trends

    The Pickleball Equipment Market is currently experiencing a notable surge in popularity, driven by a growing interest in the sport among diverse demographics. This increase in participation is likely influenced by the sport's accessibility and social nature, appealing to both younger and older players alike. As more individuals engage in pickleball, the demand for specialized equipment, such as paddles, balls, and nets, appears to be on the rise. Manufacturers are responding to this trend by innovating and enhancing product offerings, which may further stimulate market growth. Moreover, the Pickleball Equipment Market is witnessing a shift towards sustainability, with companies exploring eco-friendly materials and production methods. This trend reflects a broader societal movement towards environmental consciousness, suggesting that consumers are increasingly prioritizing sustainable options in their purchasing decisions. As the market evolves, it seems poised to adapt to these changing preferences, potentially leading to a more diverse range of products that cater to environmentally aware consumers. Overall, the Pickleball Equipment Market is positioned for continued expansion, driven by both increased participation and a commitment to sustainability.

    Rising Popularity Among Diverse Age Groups

    The Pickleball Equipment Market is seeing a significant increase in participation across various age demographics. This trend indicates that the sport is appealing to a wide audience, from young children to seniors, which may lead to a broader customer base for equipment manufacturers.

    Focus on Sustainable Products

    There is a growing emphasis on sustainability within the Pickleball Equipment Market. Companies are increasingly exploring eco-friendly materials and production techniques, reflecting a shift in consumer preferences towards environmentally responsible products.

    Technological Advancements in Equipment Design

    Innovations in equipment design are becoming more prevalent in the Pickleball Equipment Market. Manufacturers are integrating advanced technologies to enhance performance and user experience, which could attract more players and elevate the overall quality of the sport.

    <p>The rising popularity of pickleball is reshaping the landscape of recreational sports, with an increasing demand for specialized equipment that enhances gameplay and accessibility for diverse demographics.</p>

    U.S. Department of Commerce

    Pickleball Equipment Market Market Drivers

    Expansion of Pickleball Facilities

    The proliferation of dedicated pickleball facilities is a key driver in the Pickleball Equipment Market. As communities recognize the sport's appeal, investments in new courts and recreational centers are on the rise. This expansion is supported by local governments and private entities, aiming to cater to the growing number of enthusiasts. Recent statistics indicate that the number of pickleball courts has increased by over 30% in the past two years, creating a favorable environment for equipment sales. The availability of more venues not only facilitates play but also fosters a sense of community, thereby enhancing the sport's visibility and attractiveness.

    Growing Awareness of Health Benefits

    The increasing awareness of the health benefits associated with pickleball is a significant factor propelling the Pickleball Equipment Market. As individuals become more health-conscious, they seek activities that provide both physical and mental benefits. Pickleball is recognized for its ability to improve cardiovascular health, enhance coordination, and promote social interaction. Research indicates that engaging in regular physical activity, such as pickleball, can reduce the risk of chronic diseases. This awareness is likely to drive more individuals to participate in the sport, subsequently increasing the demand for equipment and accessories tailored to enhance the playing experience.

    Emergence of Professional Tournaments

    The rise of professional pickleball tournaments is significantly influencing the Pickleball Equipment Market. As the sport gains recognition, high-stakes competitions attract both players and spectators, leading to increased visibility and interest. Major tournaments, such as the USA Pickleball National Championships, draw thousands of participants and fans, showcasing the sport's competitive nature. This heightened exposure encourages manufacturers to innovate and develop advanced equipment tailored for competitive play. Consequently, the demand for high-quality paddles, balls, and accessories is likely to escalate, reflecting the sport's growing legitimacy and appeal.

    Influence of Social Media and Marketing

    The role of social media in promoting pickleball is a notable driver within the Pickleball Equipment Market. Platforms such as Instagram and TikTok have become vital for sharing gameplay, tutorials, and community events, effectively reaching a broader audience. Influencers and professional players leverage these platforms to showcase their skills and equipment, thereby generating interest among potential players. This digital marketing strategy not only enhances brand visibility but also drives sales as consumers are more inclined to purchase equipment endorsed by trusted figures. The impact of social media is likely to continue shaping consumer behavior and preferences in the market.

    Increased Participation in Recreational Sports

    The Pickleball Equipment Market is experiencing a surge in participation as more individuals seek recreational activities that promote physical fitness and social interaction. This trend is particularly evident among various age demographics, with a notable increase in players aged 50 and above. According to recent data, the number of pickleball players has grown significantly, with estimates suggesting that over 4.2 million people actively engage in the sport. This rising participation not only drives demand for equipment but also encourages the establishment of more courts and facilities, further enhancing the market landscape.

    Market Segment Insights

    By Product: Paddles (Largest) vs. Graphite & Composite (Fastest-Growing)

    <p>In the Pickleball Equipment Market, the product segment showcases a diverse distribution among paddles, balls, indoor play, outdoor play, and accessories. Paddles, being the largest segment, dominate market share due to their essential nature in gameplay. Graphite and composite paddles have gained significant traction, propelled by players seeking enhanced performance and durability. Additionally, balls and accessories contribute substantially, but paddles remain the focal point of consumer preference and investment within the segment. Trend analysis indicates robust growth across several product categories, driven by rising popularity in pickleball as a recreational activity. The demand for quality paddles, particularly graphite and composite options, is surging as players invest in performance-enhancing gear. Furthermore, the expansion of outdoor play opportunities and a growing emphasis on accessories for convenience and customization are propelling the market forward, positioning it for substantial growth in the coming years.</p>

    <p>Paddles: Wood (Dominant) vs. Balls (Emerging)</p>

    <p>Within the product segment, wooden paddles remain dominant due to their traditional appeal and cost-effectiveness, catering to beginners and casual players. They are typically heavier and offer a distinct feel that many enthusiasts appreciate. In contrast, balls represent an emerging segment, gaining traction as players seek specialized options for indoor and outdoor play. The differentiation in balls based on construction materials and performance specifications aligns with the evolving preferences of more experienced players. This ongoing shift highlights the increasing importance of quality equipment tailored to specific play conditions, promising growth in the accessories associated with both paddles and balls.</p>

    By Sales Channel: Online Retail (Largest) vs. Independent Sports Outlets (Fastest-Growing)

    <p>In the Pickleball Equipment Market, the distribution of sales channels highlights a significant preference for online retail, which captures the largest share of the market. This trend is attributed to the growing consumer tendency toward convenience and the increasing variety of products available online. Independent sports outlets, while smaller in market share, are experiencing rapid growth as enthusiasts seek personalized shopping experiences and expert advice, enhancing customer engagement.</p>

    <p>Sales Channels: Online Retail (Dominant) vs. Independent Sports Outlets (Emerging)</p>

    <p>Online retail stands as the dominant sales channel in the Pickleball Equipment Market, providing consumers with the ease of access and a broad selection of products. Retailers utilize advanced e-commerce platforms to cater to the growing trend of online shopping, offering competitive prices, detailed customer reviews, and home delivery services. On the other hand, independent sports outlets have emerged as significant players in the market. Their ability to create tailored shopping experiences, foster community engagement, and provide specialized knowledge positions them as an essential growth segment. Fans of the sport value the hands-on approach and personalized service, driving traffic and sales in these outlets.</p>

    By Buyer: Individual (Largest) vs. Institutional (Fastest-Growing)

    <p>In the Pickleball Equipment Market, the buyer segment is primarily divided into three categories: Individual, Institutional, and Promotional buyers. Among these, the Individual segment holds the largest market share, driven by the growing popularity of pickleball as a recreational sport. More individuals are investing in personal equipment, leading to a significant demand for paddles, balls, and related accessories. In contrast, the Institutional segment is witnessing rapid growth, as schools, community centers, and sports facilities increasingly adopt pickleball programs to engage participants of all ages. This shift indicates a robust trend towards institutional investments in pickleball infrastructure. The growth of the Individual segment is fueled by trends like increased health consciousness, leisure activities, and community engagement. Furthermore, the rising popularity of pickleball as a sport encourages individuals to purchase personalized equipment. On the other hand, the Institutional segment is expanding due to greater investments in public recreational spaces and targeted sports programs. These institutions seek to attract more users by offering a wider variety of sports, including pickleball, reflecting changing demographic trends and interests.</p>

    <p>Individual (Dominant) vs. Institutional (Emerging)</p>

    <p>The Individual segment of the Pickleball Equipment Market is characterized by consumers purchasing equipment for personal use, driven by the sport's rising popularity among individuals of all ages. This segment dominates the market as more players take to the courts, seeking quality paddles, balls, and gear that suit their playing style. Personalization trends, including custom paddles, are increasingly prominent. In contrast, the Institutional segment is emerging as a significant force in the market. Institutions such as schools, community centers, and fitness clubs are recognizing the benefits of pickleball – a sport that promotes fitness and social interaction. They are investing in high-quality equipment and developing programs to attract participants, advancing the sport's reach and fostering a culture of inclusion.</p>

    Get more detailed insights about Pickleball Equipment Market Research Report – Forecast till 2035

    Regional Insights

    North America : Leading Market for Pickleball

    North America is the largest market for pickleball equipment, accounting for approximately 60% of the global market share. The growth is driven by increasing participation rates, community initiatives, and the establishment of pickleball clubs. Regulatory support from local governments promoting sports and recreational activities further fuels demand. The region's strong infrastructure and access to quality equipment also contribute to its market leadership. The United States is the primary player in this market, with significant contributions from Canada. Key players such as Selkirk Sport, Paddletek, and ONIX Pickleball dominate the landscape, offering a variety of products that cater to both amateur and professional players. The competitive environment is characterized by innovation and a focus on enhancing player experience, ensuring a robust market presence for these brands.

    Europe : Emerging Market for Growth

    Europe is witnessing a rapid increase in pickleball participation, holding about 25% of the global market share. The growth is attributed to rising health consciousness, community sports initiatives, and the establishment of national federations promoting the sport. Countries like the UK and Germany are leading this trend, supported by favorable regulations that encourage sports participation and infrastructure development. The competitive landscape in Europe is evolving, with key players like Head and Babolat making significant inroads. The presence of local brands and increasing investment in marketing and sponsorships are enhancing the visibility of pickleball. As more facilities are developed, the market is expected to grow, attracting both recreational and competitive players, thereby solidifying its position in the global market.

    Asia-Pacific : Emerging Powerhouse in Sports

    Asia-Pacific is emerging as a significant player in the pickleball equipment market, currently holding around 10% of the global share. The region's growth is driven by increasing urbanization, rising disposable incomes, and a growing interest in recreational sports. Countries like Australia and New Zealand are leading the charge, with local governments promoting sports as part of public health initiatives, which is expected to further boost demand for pickleball equipment. The competitive landscape is still developing, with a mix of local and international brands entering the market. Companies are focusing on product innovation and affordability to attract a broader audience. As awareness of pickleball grows, the region is likely to see an influx of players and investments, paving the way for a more robust market presence in the coming years.

    Middle East and Africa : Untapped Market Opportunities

    The Middle East and Africa region is currently the smallest market for pickleball equipment, holding about 5% of the global share. However, there is significant potential for growth driven by increasing interest in sports and recreational activities. Governments are beginning to recognize the importance of sports in community development, leading to initiatives that promote various sports, including pickleball. This regulatory support is crucial for market expansion. Countries like South Africa and the UAE are showing early signs of interest in pickleball, with local clubs and organizations forming to promote the sport. The competitive landscape is still nascent, with few established brands, but the entry of international players could catalyze growth. As awareness and infrastructure improve, the region is poised for a gradual increase in market share.

    Key Players and Competitive Insights

    The Pickleball Equipment Market is currently characterized by a dynamic competitive landscape, driven by increasing participation rates and a growing consumer base. Major players such as Selkirk Sport (US), Paddletek (US), and ONIX Pickleball (US) are strategically positioning themselves through innovation and regional expansion. Selkirk Sport (US) has focused on enhancing product quality and performance, while Paddletek (US) emphasizes technological advancements in paddle design. ONIX Pickleball (US) appears to be leveraging partnerships with local clubs to increase brand visibility and consumer engagement. Collectively, these strategies contribute to a moderately fragmented market, where competition is intensifying as companies seek to differentiate themselves through unique offerings and customer experiences.

    In terms of business tactics, companies are increasingly localizing manufacturing to reduce lead times and optimize supply chains. This approach not only enhances responsiveness to market demands but also aligns with sustainability goals by minimizing transportation emissions. The competitive structure of the market remains moderately fragmented, with several key players exerting influence over pricing and product innovation. The collective actions of these companies indicate a shift towards more collaborative approaches, as they recognize the importance of partnerships in navigating the complexities of the market.

    In August 2025, Selkirk Sport (US) announced a partnership with a leading sports technology firm to develop smart paddles that integrate performance analytics. This strategic move is likely to enhance the user experience by providing players with data-driven insights, thereby positioning Selkirk as a leader in innovation within the market. Such advancements may attract tech-savvy consumers and elevate brand loyalty.

    In September 2025, Paddletek (US) launched a new line of eco-friendly paddles made from sustainable materials. This initiative not only addresses the growing consumer demand for environmentally responsible products but also aligns with broader industry trends towards sustainability. By prioritizing eco-friendly practices, Paddletek may strengthen its market position and appeal to a conscientious consumer base.

    In October 2025, ONIX Pickleball (US) expanded its distribution network by partnering with major sporting goods retailers across North America. This strategic action is expected to enhance product accessibility and visibility, potentially driving sales growth. By increasing its presence in retail environments, ONIX may capitalize on the rising popularity of pickleball and attract new customers who prefer in-store shopping experiences.

    As of October 2025, the competitive trends in the Pickleball Equipment Market are increasingly defined by digitalization, sustainability, and the integration of advanced technologies. Strategic alliances are becoming more prevalent, as companies recognize the value of collaboration in enhancing product offerings and market reach. Looking ahead, competitive differentiation is likely to evolve from traditional price-based competition to a focus on innovation, technological advancements, and supply chain reliability. This shift underscores the importance of adaptability and forward-thinking strategies in maintaining a competitive edge in the rapidly growing pickleball landscape.

    Key Companies in the Pickleball Equipment Market market include

    Industry Developments

    • Q2 2024: Selkirk Sport Launches Vanguard Power Air Paddle, Redefining Pickleball Paddle Technology Selkirk Sport, a leading pickleball equipment manufacturer, announced the launch of its new Vanguard Power Air paddle, featuring advanced aerodynamic design and proprietary materials aimed at enhancing player performance.
    • Q2 2024: Franklin Sports Expands Pickleball Manufacturing Facility in Massachusetts Franklin Sports announced the expansion of its pickleball paddle manufacturing facility in Stoughton, Massachusetts, to meet growing demand for its equipment in North America.
    • Q3 2024: JOOLA Announces Partnership with USA Pickleball as Official Paddle Sponsor JOOLA, a global sports equipment brand, entered into a multi-year partnership with USA Pickleball to become the official paddle sponsor for national tournaments and events.
    • Q3 2024: Paddletek Appoints New CEO to Drive Global Expansion Paddletek, a major pickleball paddle manufacturer, appointed industry veteran Lisa Chen as CEO to lead the company’s international growth strategy.
    • Q4 2024: Onix Pickleball Unveils New Graphite Z5 Paddle for Competitive Players Onix Pickleball launched its latest Graphite Z5 paddle, designed for advanced players seeking improved control and power, expanding its premium product lineup.
    • Q4 2024: Pickleball Central Acquires Pickleball Galaxy to Expand E-Commerce Reach Pickleball Central, a leading online retailer, acquired Pickleball Galaxy, strengthening its position in the e-commerce market for pickleball equipment.
    • Q1 2025: Vulcan Sporting Goods Co. Announces New Eco-Friendly Paddle Line Vulcan Sporting Goods Co. introduced a new line of eco-friendly pickleball paddles made from recycled materials, targeting environmentally conscious consumers.
    • Q1 2025: Gamma Sports Opens New Research and Development Center for Pickleball Equipment Gamma Sports opened a dedicated R&D center in Pittsburgh, Pennsylvania, focused on developing innovative pickleball paddles and balls.
    • Q2 2025: Selkirk Sport Secures $20 Million Series B Funding to Accelerate Product Innovation Selkirk Sport raised $20 million in Series B funding to invest in advanced manufacturing technologies and expand its product portfolio.
    • Q2 2025: Franklin Sports Partners with Major League Pickleball as Official Equipment Provider Franklin Sports signed a multi-year agreement to become the official equipment provider for Major League Pickleball, supplying paddles, balls, and accessories for all league events.
    • Q3 2025: JOOLA Opens European Distribution Center to Meet Growing Demand JOOLA opened a new distribution center in Germany to support its expanding pickleball equipment business across Europe.
    • Q3 2025: Paddletek Launches Limited Edition Signature Paddle Series Paddletek introduced a limited edition signature paddle series in collaboration with top professional pickleball athletes, featuring custom designs and advanced materials.

    .webp

    Future Outlook

    Pickleball Equipment Market Future Outlook

    <p>The Pickleball Equipment Market is projected to grow at a 9.8% CAGR from 2024 to 2035, driven by increasing participation rates, product innovation, and enhanced distribution channels.</p>

    New opportunities lie in:

    • <p>Development of smart pickleball paddles with integrated performance tracking technology.</p>
    • <p>Expansion of e-commerce platforms for direct-to-consumer sales.</p>
    • <p>Creation of customized pickleball equipment tailored for different skill levels.</p>

    <p>By 2035, the market is expected to be robust, reflecting substantial growth and diversification.</p>

    Market Segmentation

    Pickleball Equipment Market Buyer Outlook

    • Individual
    • Institutional
    • Promotional

    Pickleball Equipment Market Product Outlook

    • Paddles
    • Wood
    • Graphite & Composite
    • Balls
    • Indoor Play
    • Outdoor Play
    • Accessories

    Pickleball Equipment Market Sales Channel Outlook

    • Independent Sports Outlets
    • Franchised Sports Outlets
    • Modern Retail
    • Online Retail

    Report Scope

    MARKET SIZE 202471.47(USD Billion)
    MARKET SIZE 202578.48(USD Billion)
    MARKET SIZE 2035199.91(USD Billion)
    COMPOUND ANNUAL GROWTH RATE (CAGR)9.8% (2024 - 2035)
    REPORT COVERAGERevenue Forecast, Competitive Landscape, Growth Factors, and Trends
    BASE YEAR2024
    Market Forecast Period2025 - 2035
    Historical Data2019 - 2024
    Market Forecast UnitsUSD Billion
    Key Companies ProfiledMarket analysis in progress
    Segments CoveredMarket segmentation analysis in progress
    Key Market OpportunitiesGrowing consumer interest in health and fitness drives demand for innovative Pickleball Equipment.
    Key Market DynamicsRising consumer interest in recreational sports drives innovation and competition in the Pickleball Equipment Market.
    Countries CoveredNorth America, Europe, APAC, South America, MEA

    FAQs

    What is the current valuation of the Pickleball Equipment Market?

    The Pickleball Equipment Market was valued at 71.47 USD Billion in 2024.

    What is the projected market valuation for the Pickleball Equipment Market in 2035?

    The market is projected to reach 199.91 USD Billion by 2035.

    What is the expected CAGR for the Pickleball Equipment Market from 2025 to 2035?

    The expected CAGR for the market during the forecast period 2025 - 2035 is 9.8%.

    Which product segment is anticipated to have the highest growth in the Pickleball Equipment Market?

    The Graphite & Composite paddles segment is expected to grow from 20.0 to 55.0 USD Billion.

    How do online retail sales compare to other sales channels in the Pickleball Equipment Market?

    Online retail sales are projected to increase from 28.47 to 81.91 USD Billion, leading all sales channels.

    What are the expected sales figures for indoor play equipment in the Pickleball Equipment Market?

    Indoor play equipment sales are anticipated to grow from 7.0 to 20.0 USD Billion.

    1. SECTION I: EXECUTIVE SUMMARY AND KEY HIGHLIGHTS
      1. | 1.1 EXECUTIVE SUMMARY
      2. | | 1.1.1 Market Overview
      3. | | 1.1.2 Key Findings
      4. | | 1.1.3 Market Segmentation
      5. | | 1.1.4 Competitive Landscape
      6. | | 1.1.5 Challenges and Opportunities
      7. | | 1.1.6 Future Outlook
    2. SECTION II: SCOPING, METHODOLOGY AND MARKET STRUCTURE
      1. | 2.1 MARKET INTRODUCTION
      2. | | 2.1.1 Definition
      3. | | 2.1.2 Scope of the study
      4. | | | 2.1.2.1 Research Objective
      5. | | | 2.1.2.2 Assumption
      6. | | | 2.1.2.3 Limitations
      7. | 2.2 RESEARCH METHODOLOGY
      8. | | 2.2.1 Overview
      9. | | 2.2.2 Data Mining
      10. | | 2.2.3 Secondary Research
      11. | | 2.2.4 Primary Research
      12. | | | 2.2.4.1 Primary Interviews and Information Gathering Process
      13. | | | 2.2.4.2 Breakdown of Primary Respondents
      14. | | 2.2.5 Forecasting Model
      15. | | 2.2.6 Market Size Estimation
      16. | | | 2.2.6.1 Bottom-Up Approach
      17. | | | 2.2.6.2 Top-Down Approach
      18. | | 2.2.7 Data Triangulation
      19. | | 2.2.8 Validation
    3. SECTION III: QUALITATIVE ANALYSIS
      1. | 3.1 MARKET DYNAMICS
      2. | | 3.1.1 Overview
      3. | | 3.1.2 Drivers
      4. | | 3.1.3 Restraints
      5. | | 3.1.4 Opportunities
      6. | 3.2 MARKET FACTOR ANALYSIS
      7. | | 3.2.1 Value chain Analysis
      8. | | 3.2.2 Porter's Five Forces Analysis
      9. | | | 3.2.2.1 Bargaining Power of Suppliers
      10. | | | 3.2.2.2 Bargaining Power of Buyers
      11. | | | 3.2.2.3 Threat of New Entrants
      12. | | | 3.2.2.4 Threat of Substitutes
      13. | | | 3.2.2.5 Intensity of Rivalry
      14. | | 3.2.3 COVID-19 Impact Analysis
      15. | | | 3.2.3.1 Market Impact Analysis
      16. | | | 3.2.3.2 Regional Impact
      17. | | | 3.2.3.3 Opportunity and Threat Analysis
    4. SECTION IV: QUANTITATIVE ANALYSIS
      1. | 4.1 Consumer and Retail, BY Product (USD Billion)
      2. | | 4.1.1 Paddles
      3. | | 4.1.2 Wood
      4. | | 4.1.3 Graphite & Composite
      5. | | 4.1.4 Balls
      6. | | 4.1.5 Indoor Play
      7. | | 4.1.6 Outdoor Play
      8. | | 4.1.7 Accessories
      9. | 4.2 Consumer and Retail, BY Sales Channel (USD Billion)
      10. | | 4.2.1 Independent Sports Outlets
      11. | | 4.2.2 Franchised Sports Outlets
      12. | | 4.2.3 Modern Retail
      13. | | 4.2.4 Online Retail
      14. | 4.3 Consumer and Retail, BY Buyer (USD Billion)
      15. | | 4.3.1 Individual
      16. | | 4.3.2 Institutional
      17. | | 4.3.3 Promotional
      18. | 4.4 Consumer and Retail, BY Region (USD Billion)
      19. | | 4.4.1 North America
      20. | | | 4.4.1.1 US
      21. | | | 4.4.1.2 Canada
      22. | | 4.4.2 Europe
      23. | | | 4.4.2.1 Germany
      24. | | | 4.4.2.2 UK
      25. | | | 4.4.2.3 France
      26. | | | 4.4.2.4 Russia
      27. | | | 4.4.2.5 Italy
      28. | | | 4.4.2.6 Spain
      29. | | | 4.4.2.7 Rest of Europe
      30. | | 4.4.3 APAC
      31. | | | 4.4.3.1 China
      32. | | | 4.4.3.2 India
      33. | | | 4.4.3.3 Japan
      34. | | | 4.4.3.4 South Korea
      35. | | | 4.4.3.5 Malaysia
      36. | | | 4.4.3.6 Thailand
      37. | | | 4.4.3.7 Indonesia
      38. | | | 4.4.3.8 Rest of APAC
      39. | | 4.4.4 South America
      40. | | | 4.4.4.1 Brazil
      41. | | | 4.4.4.2 Mexico
      42. | | | 4.4.4.3 Argentina
      43. | | | 4.4.4.4 Rest of South America
      44. | | 4.4.5 MEA
      45. | | | 4.4.5.1 GCC Countries
      46. | | | 4.4.5.2 South Africa
      47. | | | 4.4.5.3 Rest of MEA
    5. SECTION V: COMPETITIVE ANALYSIS
      1. | 5.1 Competitive Landscape
      2. | | 5.1.1 Overview
      3. | | 5.1.2 Competitive Analysis
      4. | | 5.1.3 Market share Analysis
      5. | | 5.1.4 Major Growth Strategy in the Consumer and Retail
      6. | | 5.1.5 Competitive Benchmarking
      7. | | 5.1.6 Leading Players in Terms of Number of Developments in the Consumer and Retail
      8. | | 5.1.7 Key developments and growth strategies
      9. | | | 5.1.7.1 New Product Launch/Service Deployment
      10. | | | 5.1.7.2 Merger & Acquisitions
      11. | | | 5.1.7.3 Joint Ventures
      12. | | 5.1.8 Major Players Financial Matrix
      13. | | | 5.1.8.1 Sales and Operating Income
      14. | | | 5.1.8.2 Major Players R&D Expenditure. 2023
      15. | 5.2 Company Profiles
      16. | | 5.2.1 Selkirk Sport (US)
      17. | | | 5.2.1.1 Financial Overview
      18. | | | 5.2.1.2 Products Offered
      19. | | | 5.2.1.3 Key Developments
      20. | | | 5.2.1.4 SWOT Analysis
      21. | | | 5.2.1.5 Key Strategies
      22. | | 5.2.2 Paddletek (US)
      23. | | | 5.2.2.1 Financial Overview
      24. | | | 5.2.2.2 Products Offered
      25. | | | 5.2.2.3 Key Developments
      26. | | | 5.2.2.4 SWOT Analysis
      27. | | | 5.2.2.5 Key Strategies
      28. | | 5.2.3 ONIX Pickleball (US)
      29. | | | 5.2.3.1 Financial Overview
      30. | | | 5.2.3.2 Products Offered
      31. | | | 5.2.3.3 Key Developments
      32. | | | 5.2.3.4 SWOT Analysis
      33. | | | 5.2.3.5 Key Strategies
      34. | | 5.2.4 Head (AT)
      35. | | | 5.2.4.1 Financial Overview
      36. | | | 5.2.4.2 Products Offered
      37. | | | 5.2.4.3 Key Developments
      38. | | | 5.2.4.4 SWOT Analysis
      39. | | | 5.2.4.5 Key Strategies
      40. | | 5.2.5 Gamma Sports (US)
      41. | | | 5.2.5.1 Financial Overview
      42. | | | 5.2.5.2 Products Offered
      43. | | | 5.2.5.3 Key Developments
      44. | | | 5.2.5.4 SWOT Analysis
      45. | | | 5.2.5.5 Key Strategies
      46. | | 5.2.6 Prince (US)
      47. | | | 5.2.6.1 Financial Overview
      48. | | | 5.2.6.2 Products Offered
      49. | | | 5.2.6.3 Key Developments
      50. | | | 5.2.6.4 SWOT Analysis
      51. | | | 5.2.6.5 Key Strategies
      52. | | 5.2.7 Wilson Sporting Goods (US)
      53. | | | 5.2.7.1 Financial Overview
      54. | | | 5.2.7.2 Products Offered
      55. | | | 5.2.7.3 Key Developments
      56. | | | 5.2.7.4 SWOT Analysis
      57. | | | 5.2.7.5 Key Strategies
      58. | | 5.2.8 Babolat (FR)
      59. | | | 5.2.8.1 Financial Overview
      60. | | | 5.2.8.2 Products Offered
      61. | | | 5.2.8.3 Key Developments
      62. | | | 5.2.8.4 SWOT Analysis
      63. | | | 5.2.8.5 Key Strategies
      64. | 5.3 Appendix
      65. | | 5.3.1 References
      66. | | 5.3.2 Related Reports
    6. LIST OF FIGURES
      1. | 6.1 MARKET SYNOPSIS
      2. | 6.2 NORTH AMERICA MARKET ANALYSIS
      3. | 6.3 US MARKET ANALYSIS BY PRODUCT
      4. | 6.4 US MARKET ANALYSIS BY SALES CHANNEL
      5. | 6.5 US MARKET ANALYSIS BY BUYER
      6. | 6.6 CANADA MARKET ANALYSIS BY PRODUCT
      7. | 6.7 CANADA MARKET ANALYSIS BY SALES CHANNEL
      8. | 6.8 CANADA MARKET ANALYSIS BY BUYER
      9. | 6.9 EUROPE MARKET ANALYSIS
      10. | 6.10 GERMANY MARKET ANALYSIS BY PRODUCT
      11. | 6.11 GERMANY MARKET ANALYSIS BY SALES CHANNEL
      12. | 6.12 GERMANY MARKET ANALYSIS BY BUYER
      13. | 6.13 UK MARKET ANALYSIS BY PRODUCT
      14. | 6.14 UK MARKET ANALYSIS BY SALES CHANNEL
      15. | 6.15 UK MARKET ANALYSIS BY BUYER
      16. | 6.16 FRANCE MARKET ANALYSIS BY PRODUCT
      17. | 6.17 FRANCE MARKET ANALYSIS BY SALES CHANNEL
      18. | 6.18 FRANCE MARKET ANALYSIS BY BUYER
      19. | 6.19 RUSSIA MARKET ANALYSIS BY PRODUCT
      20. | 6.20 RUSSIA MARKET ANALYSIS BY SALES CHANNEL
      21. | 6.21 RUSSIA MARKET ANALYSIS BY BUYER
      22. | 6.22 ITALY MARKET ANALYSIS BY PRODUCT
      23. | 6.23 ITALY MARKET ANALYSIS BY SALES CHANNEL
      24. | 6.24 ITALY MARKET ANALYSIS BY BUYER
      25. | 6.25 SPAIN MARKET ANALYSIS BY PRODUCT
      26. | 6.26 SPAIN MARKET ANALYSIS BY SALES CHANNEL
      27. | 6.27 SPAIN MARKET ANALYSIS BY BUYER
      28. | 6.28 REST OF EUROPE MARKET ANALYSIS BY PRODUCT
      29. | 6.29 REST OF EUROPE MARKET ANALYSIS BY SALES CHANNEL
      30. | 6.30 REST OF EUROPE MARKET ANALYSIS BY BUYER
      31. | 6.31 APAC MARKET ANALYSIS
      32. | 6.32 CHINA MARKET ANALYSIS BY PRODUCT
      33. | 6.33 CHINA MARKET ANALYSIS BY SALES CHANNEL
      34. | 6.34 CHINA MARKET ANALYSIS BY BUYER
      35. | 6.35 INDIA MARKET ANALYSIS BY PRODUCT
      36. | 6.36 INDIA MARKET ANALYSIS BY SALES CHANNEL
      37. | 6.37 INDIA MARKET ANALYSIS BY BUYER
      38. | 6.38 JAPAN MARKET ANALYSIS BY PRODUCT
      39. | 6.39 JAPAN MARKET ANALYSIS BY SALES CHANNEL
      40. | 6.40 JAPAN MARKET ANALYSIS BY BUYER
      41. | 6.41 SOUTH KOREA MARKET ANALYSIS BY PRODUCT
      42. | 6.42 SOUTH KOREA MARKET ANALYSIS BY SALES CHANNEL
      43. | 6.43 SOUTH KOREA MARKET ANALYSIS BY BUYER
      44. | 6.44 MALAYSIA MARKET ANALYSIS BY PRODUCT
      45. | 6.45 MALAYSIA MARKET ANALYSIS BY SALES CHANNEL
      46. | 6.46 MALAYSIA MARKET ANALYSIS BY BUYER
      47. | 6.47 THAILAND MARKET ANALYSIS BY PRODUCT
      48. | 6.48 THAILAND MARKET ANALYSIS BY SALES CHANNEL
      49. | 6.49 THAILAND MARKET ANALYSIS BY BUYER
      50. | 6.50 INDONESIA MARKET ANALYSIS BY PRODUCT
      51. | 6.51 INDONESIA MARKET ANALYSIS BY SALES CHANNEL
      52. | 6.52 INDONESIA MARKET ANALYSIS BY BUYER
      53. | 6.53 REST OF APAC MARKET ANALYSIS BY PRODUCT
      54. | 6.54 REST OF APAC MARKET ANALYSIS BY SALES CHANNEL
      55. | 6.55 REST OF APAC MARKET ANALYSIS BY BUYER
      56. | 6.56 SOUTH AMERICA MARKET ANALYSIS
      57. | 6.57 BRAZIL MARKET ANALYSIS BY PRODUCT
      58. | 6.58 BRAZIL MARKET ANALYSIS BY SALES CHANNEL
      59. | 6.59 BRAZIL MARKET ANALYSIS BY BUYER
      60. | 6.60 MEXICO MARKET ANALYSIS BY PRODUCT
      61. | 6.61 MEXICO MARKET ANALYSIS BY SALES CHANNEL
      62. | 6.62 MEXICO MARKET ANALYSIS BY BUYER
      63. | 6.63 ARGENTINA MARKET ANALYSIS BY PRODUCT
      64. | 6.64 ARGENTINA MARKET ANALYSIS BY SALES CHANNEL
      65. | 6.65 ARGENTINA MARKET ANALYSIS BY BUYER
      66. | 6.66 REST OF SOUTH AMERICA MARKET ANALYSIS BY PRODUCT
      67. | 6.67 REST OF SOUTH AMERICA MARKET ANALYSIS BY SALES CHANNEL
      68. | 6.68 REST OF SOUTH AMERICA MARKET ANALYSIS BY BUYER
      69. | 6.69 MEA MARKET ANALYSIS
      70. | 6.70 GCC COUNTRIES MARKET ANALYSIS BY PRODUCT
      71. | 6.71 GCC COUNTRIES MARKET ANALYSIS BY SALES CHANNEL
      72. | 6.72 GCC COUNTRIES MARKET ANALYSIS BY BUYER
      73. | 6.73 SOUTH AFRICA MARKET ANALYSIS BY PRODUCT
      74. | 6.74 SOUTH AFRICA MARKET ANALYSIS BY SALES CHANNEL
      75. | 6.75 SOUTH AFRICA MARKET ANALYSIS BY BUYER
      76. | 6.76 REST OF MEA MARKET ANALYSIS BY PRODUCT
      77. | 6.77 REST OF MEA MARKET ANALYSIS BY SALES CHANNEL
      78. | 6.78 REST OF MEA MARKET ANALYSIS BY BUYER
      79. | 6.79 KEY BUYING CRITERIA OF CONSUMER AND RETAIL
      80. | 6.80 RESEARCH PROCESS OF MRFR
      81. | 6.81 DRO ANALYSIS OF CONSUMER AND RETAIL
      82. | 6.82 DRIVERS IMPACT ANALYSIS: CONSUMER AND RETAIL
      83. | 6.83 RESTRAINTS IMPACT ANALYSIS: CONSUMER AND RETAIL
      84. | 6.84 SUPPLY / VALUE CHAIN: CONSUMER AND RETAIL
      85. | 6.85 CONSUMER AND RETAIL, BY PRODUCT, 2024 (% SHARE)
      86. | 6.86 CONSUMER AND RETAIL, BY PRODUCT, 2024 TO 2035 (USD Billion)
      87. | 6.87 CONSUMER AND RETAIL, BY SALES CHANNEL, 2024 (% SHARE)
      88. | 6.88 CONSUMER AND RETAIL, BY SALES CHANNEL, 2024 TO 2035 (USD Billion)
      89. | 6.89 CONSUMER AND RETAIL, BY BUYER, 2024 (% SHARE)
      90. | 6.90 CONSUMER AND RETAIL, BY BUYER, 2024 TO 2035 (USD Billion)
      91. | 6.91 BENCHMARKING OF MAJOR COMPETITORS
    7. LIST OF TABLES
      1. | 7.1 LIST OF ASSUMPTIONS
      2. | | 7.1.1
      3. | 7.2 North America MARKET SIZE ESTIMATES; FORECAST
      4. | | 7.2.1 BY PRODUCT, 2025-2035 (USD Billion)
      5. | | 7.2.2 BY SALES CHANNEL, 2025-2035 (USD Billion)
      6. | | 7.2.3 BY BUYER, 2025-2035 (USD Billion)
      7. | 7.3 US MARKET SIZE ESTIMATES; FORECAST
      8. | | 7.3.1 BY PRODUCT, 2025-2035 (USD Billion)
      9. | | 7.3.2 BY SALES CHANNEL, 2025-2035 (USD Billion)
      10. | | 7.3.3 BY BUYER, 2025-2035 (USD Billion)
      11. | 7.4 Canada MARKET SIZE ESTIMATES; FORECAST
      12. | | 7.4.1 BY PRODUCT, 2025-2035 (USD Billion)
      13. | | 7.4.2 BY SALES CHANNEL, 2025-2035 (USD Billion)
      14. | | 7.4.3 BY BUYER, 2025-2035 (USD Billion)
      15. | 7.5 Europe MARKET SIZE ESTIMATES; FORECAST
      16. | | 7.5.1 BY PRODUCT, 2025-2035 (USD Billion)
      17. | | 7.5.2 BY SALES CHANNEL, 2025-2035 (USD Billion)
      18. | | 7.5.3 BY BUYER, 2025-2035 (USD Billion)
      19. | 7.6 Germany MARKET SIZE ESTIMATES; FORECAST
      20. | | 7.6.1 BY PRODUCT, 2025-2035 (USD Billion)
      21. | | 7.6.2 BY SALES CHANNEL, 2025-2035 (USD Billion)
      22. | | 7.6.3 BY BUYER, 2025-2035 (USD Billion)
      23. | 7.7 UK MARKET SIZE ESTIMATES; FORECAST
      24. | | 7.7.1 BY PRODUCT, 2025-2035 (USD Billion)
      25. | | 7.7.2 BY SALES CHANNEL, 2025-2035 (USD Billion)
      26. | | 7.7.3 BY BUYER, 2025-2035 (USD Billion)
      27. | 7.8 France MARKET SIZE ESTIMATES; FORECAST
      28. | | 7.8.1 BY PRODUCT, 2025-2035 (USD Billion)
      29. | | 7.8.2 BY SALES CHANNEL, 2025-2035 (USD Billion)
      30. | | 7.8.3 BY BUYER, 2025-2035 (USD Billion)
      31. | 7.9 Russia MARKET SIZE ESTIMATES; FORECAST
      32. | | 7.9.1 BY PRODUCT, 2025-2035 (USD Billion)
      33. | | 7.9.2 BY SALES CHANNEL, 2025-2035 (USD Billion)
      34. | | 7.9.3 BY BUYER, 2025-2035 (USD Billion)
      35. | 7.10 Italy MARKET SIZE ESTIMATES; FORECAST
      36. | | 7.10.1 BY PRODUCT, 2025-2035 (USD Billion)
      37. | | 7.10.2 BY SALES CHANNEL, 2025-2035 (USD Billion)
      38. | | 7.10.3 BY BUYER, 2025-2035 (USD Billion)
      39. | 7.11 Spain MARKET SIZE ESTIMATES; FORECAST
      40. | | 7.11.1 BY PRODUCT, 2025-2035 (USD Billion)
      41. | | 7.11.2 BY SALES CHANNEL, 2025-2035 (USD Billion)
      42. | | 7.11.3 BY BUYER, 2025-2035 (USD Billion)
      43. | 7.12 Rest of Europe MARKET SIZE ESTIMATES; FORECAST
      44. | | 7.12.1 BY PRODUCT, 2025-2035 (USD Billion)
      45. | | 7.12.2 BY SALES CHANNEL, 2025-2035 (USD Billion)
      46. | | 7.12.3 BY BUYER, 2025-2035 (USD Billion)
      47. | 7.13 APAC MARKET SIZE ESTIMATES; FORECAST
      48. | | 7.13.1 BY PRODUCT, 2025-2035 (USD Billion)
      49. | | 7.13.2 BY SALES CHANNEL, 2025-2035 (USD Billion)
      50. | | 7.13.3 BY BUYER, 2025-2035 (USD Billion)
      51. | 7.14 China MARKET SIZE ESTIMATES; FORECAST
      52. | | 7.14.1 BY PRODUCT, 2025-2035 (USD Billion)
      53. | | 7.14.2 BY SALES CHANNEL, 2025-2035 (USD Billion)
      54. | | 7.14.3 BY BUYER, 2025-2035 (USD Billion)
      55. | 7.15 India MARKET SIZE ESTIMATES; FORECAST
      56. | | 7.15.1 BY PRODUCT, 2025-2035 (USD Billion)
      57. | | 7.15.2 BY SALES CHANNEL, 2025-2035 (USD Billion)
      58. | | 7.15.3 BY BUYER, 2025-2035 (USD Billion)
      59. | 7.16 Japan MARKET SIZE ESTIMATES; FORECAST
      60. | | 7.16.1 BY PRODUCT, 2025-2035 (USD Billion)
      61. | | 7.16.2 BY SALES CHANNEL, 2025-2035 (USD Billion)
      62. | | 7.16.3 BY BUYER, 2025-2035 (USD Billion)
      63. | 7.17 South Korea MARKET SIZE ESTIMATES; FORECAST
      64. | | 7.17.1 BY PRODUCT, 2025-2035 (USD Billion)
      65. | | 7.17.2 BY SALES CHANNEL, 2025-2035 (USD Billion)
      66. | | 7.17.3 BY BUYER, 2025-2035 (USD Billion)
      67. | 7.18 Malaysia MARKET SIZE ESTIMATES; FORECAST
      68. | | 7.18.1 BY PRODUCT, 2025-2035 (USD Billion)
      69. | | 7.18.2 BY SALES CHANNEL, 2025-2035 (USD Billion)
      70. | | 7.18.3 BY BUYER, 2025-2035 (USD Billion)
      71. | 7.19 Thailand MARKET SIZE ESTIMATES; FORECAST
      72. | | 7.19.1 BY PRODUCT, 2025-2035 (USD Billion)
      73. | | 7.19.2 BY SALES CHANNEL, 2025-2035 (USD Billion)
      74. | | 7.19.3 BY BUYER, 2025-2035 (USD Billion)
      75. | 7.20 Indonesia MARKET SIZE ESTIMATES; FORECAST
      76. | | 7.20.1 BY PRODUCT, 2025-2035 (USD Billion)
      77. | | 7.20.2 BY SALES CHANNEL, 2025-2035 (USD Billion)
      78. | | 7.20.3 BY BUYER, 2025-2035 (USD Billion)
      79. | 7.21 Rest of APAC MARKET SIZE ESTIMATES; FORECAST
      80. | | 7.21.1 BY PRODUCT, 2025-2035 (USD Billion)
      81. | | 7.21.2 BY SALES CHANNEL, 2025-2035 (USD Billion)
      82. | | 7.21.3 BY BUYER, 2025-2035 (USD Billion)
      83. | 7.22 South America MARKET SIZE ESTIMATES; FORECAST
      84. | | 7.22.1 BY PRODUCT, 2025-2035 (USD Billion)
      85. | | 7.22.2 BY SALES CHANNEL, 2025-2035 (USD Billion)
      86. | | 7.22.3 BY BUYER, 2025-2035 (USD Billion)
      87. | 7.23 Brazil MARKET SIZE ESTIMATES; FORECAST
      88. | | 7.23.1 BY PRODUCT, 2025-2035 (USD Billion)
      89. | | 7.23.2 BY SALES CHANNEL, 2025-2035 (USD Billion)
      90. | | 7.23.3 BY BUYER, 2025-2035 (USD Billion)
      91. | 7.24 Mexico MARKET SIZE ESTIMATES; FORECAST
      92. | | 7.24.1 BY PRODUCT, 2025-2035 (USD Billion)
      93. | | 7.24.2 BY SALES CHANNEL, 2025-2035 (USD Billion)
      94. | | 7.24.3 BY BUYER, 2025-2035 (USD Billion)
      95. | 7.25 Argentina MARKET SIZE ESTIMATES; FORECAST
      96. | | 7.25.1 BY PRODUCT, 2025-2035 (USD Billion)
      97. | | 7.25.2 BY SALES CHANNEL, 2025-2035 (USD Billion)
      98. | | 7.25.3 BY BUYER, 2025-2035 (USD Billion)
      99. | 7.26 Rest of South America MARKET SIZE ESTIMATES; FORECAST
      100. | | 7.26.1 BY PRODUCT, 2025-2035 (USD Billion)
      101. | | 7.26.2 BY SALES CHANNEL, 2025-2035 (USD Billion)
      102. | | 7.26.3 BY BUYER, 2025-2035 (USD Billion)
      103. | 7.27 MEA MARKET SIZE ESTIMATES; FORECAST
      104. | | 7.27.1 BY PRODUCT, 2025-2035 (USD Billion)
      105. | | 7.27.2 BY SALES CHANNEL, 2025-2035 (USD Billion)
      106. | | 7.27.3 BY BUYER, 2025-2035 (USD Billion)
      107. | 7.28 GCC Countries MARKET SIZE ESTIMATES; FORECAST
      108. | | 7.28.1 BY PRODUCT, 2025-2035 (USD Billion)
      109. | | 7.28.2 BY SALES CHANNEL, 2025-2035 (USD Billion)
      110. | | 7.28.3 BY BUYER, 2025-2035 (USD Billion)
      111. | 7.29 South Africa MARKET SIZE ESTIMATES; FORECAST
      112. | | 7.29.1 BY PRODUCT, 2025-2035 (USD Billion)
      113. | | 7.29.2 BY SALES CHANNEL, 2025-2035 (USD Billion)
      114. | | 7.29.3 BY BUYER, 2025-2035 (USD Billion)
      115. | 7.30 Rest of MEA MARKET SIZE ESTIMATES; FORECAST
      116. | | 7.30.1 BY PRODUCT, 2025-2035 (USD Billion)
      117. | | 7.30.2 BY SALES CHANNEL, 2025-2035 (USD Billion)
      118. | | 7.30.3 BY BUYER, 2025-2035 (USD Billion)
      119. | 7.31 PRODUCT LAUNCH/PRODUCT DEVELOPMENT/APPROVAL
      120. | | 7.31.1
      121. | 7.32 ACQUISITION/PARTNERSHIP
      122. | | 7.32.1

    Pickleball Equipment Market Segmentation

    Market Segmentation Overview

    • Detailed segmentation data will be available in the full report
    • Comprehensive analysis by multiple parameters
    • Regional and country-level breakdowns
    • Market size forecasts by segment
    Infographic

    Free Sample Request

    Kindly complete the form below to receive a free sample of this Report

    Get Free Sample

    Customer Strories

    “I am very pleased with how market segments have been defined in a relevant way for my purposes (such as "Portable Freezers & refrigerators" and "last-mile"). In general the report is well structured. Thanks very much for your efforts.”

    Victoria Milne

    Founder
    Case Study
    Chemicals and Materials

    Compare Licence

    ×
    Features License Type
    Single User Multiuser License Enterprise User
    Price $4,950 $5,950 $7,250
    Maximum User Access Limit 1 User Upto 10 Users Unrestricted Access Throughout the Organization
    Free Customization
    Direct Access to Analyst
    Deliverable Format
    Platform Access
    Discount on Next Purchase 10% 15% 15%
    Printable Versions