• Cat-intel
  • MedIntelliX
  • Resources
  • About Us
  • Request Free Sample ×

    Kindly complete the form below to receive a free sample of this Report

    Leading companies partner with us for data-driven Insights

    clients tt-cursor

    OTT Market

    ID: MRFR/ICT/10003-HCR
    128 Pages
    Ankit Gupta
    September 2025

    OTT Market Research Report Information By Type (Game Streaming, Audio Streaming, Video Streaming, and Communication), By Streaming Devices (Smartphones and Tablets, Desktops and Laptops, and IPTV and Consoles), By Monetization Model (Subscription-Based, Advertising-based, and Transaction-Based), by Service verticals (Media and Entertainment, Education and Learning, Gaming, and Service Utilities) And By Region (North America, Europe, Asia-Pacific, And Rest Of The World) –Market Forecast Till 2034

    Share:
    Download PDF ×

    We do not share your information with anyone. However, we may send you emails based on your report interest from time to time. You may contact us at any time to opt-out.

    OTT Market Research Report - Global Forecast till 2034 Infographic
    Purchase Options
    $ 4,950.0
    $ 5,950.0
    $ 7,250.0
    Table of Contents

    OTT Market Summary

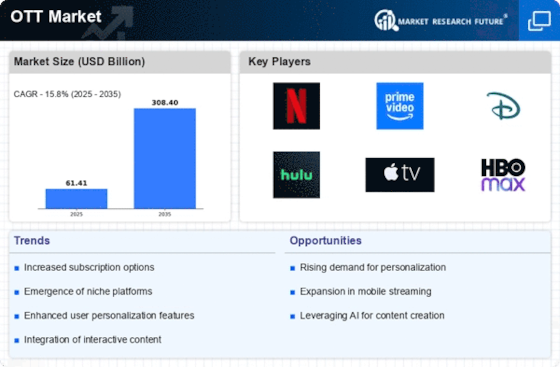
    As per Market Research Future Analysis, the OTT Market is projected to grow from USD 71.11 billion in 2025 to USD 266.31 billion by 2034, with a CAGR of 15.80% during the forecast period. The market was valued at USD 61.40 billion in 2024. Key drivers include increasing consumer numbers, limited genre options, internet penetration, device availability, and cost reductions. The market is characterized by a shift from traditional TV to on-demand services, with game streaming leading revenue at 40%-45%. The North American region dominated in 2022, driven by significant investments in content creation.

    Key Market Trends & Highlights

    The OTT market is experiencing transformative growth driven by technological advancements and changing consumer preferences.

    • OTT Market is expected to reach USD 266.31 billion by 2034.
    • Game streaming segment accounted for 40%-45% of market revenue.
    • North America held the largest market share in 2022.
    • Asia-Pacific is projected to grow at the fastest CAGR from 2023 to 2032.

    Market Size & Forecast

    2024 Market Size USD 61.40 Billion
    2025 Market Size USD 71.11 Billion
    2034 Market Size USD 266.31 Billion

    Major Players

    Key players include Netflix, Amazon.com (Prime Video), The Walt Disney Company (Hulu), Tencent Holdings, Roku, Google (YouTube), DAZN Group, NBC Universal (Hayu), and PCCW Media Group (Viu).

    OTT Market Trends

    Growing obese population is driving the market growth

    This content is transmitted directly over the Internet to connected devices such as PCs, tablets, smartphones, and game consoles. Over-the-top services are in their infancy and are widely recognized as a trending technology around the globe. The over-the-top market is anticipated to undergo innovative and sophisticated transformations, allowing buyers to access everything they require in a single location, thus boosting the market CAGR.

    Demand for applications such as Google Hangouts, FaceTime by Apple, WhatsApp, and other social media platforms that provide user-friendly interfaces and innovative and appealing voice & video messaging services to viewers has increased over the past few years. These products have firmly established their market presence with their high-quality offerings and pervasive consumer acceptance. The inability to provide high-speed Internet is one of the factors inhibiting the market's growth in terms of sales value. To view content on OTT platforms, high-speed Internet is required.

    Due to the low penetration of the Internet in developing economies such as Africa and the Middle East, this is frequently impossible in outlying regions of developing nations. 

    In addition, the rising demand for smart televisions is anticipated to present enormous opportunities for the market's development in terms of revenue. The increasing internet penetration, smart TV, smartphone, 5G infrastructure, original media content, and other factors are anticipated to provide lucrative growth opportunities for the market in the coming years. In addition, the increasing adoption of web-based applications will likely drive market expansion. In addition, rising demand for online streaming content, such as live news, movies, sports, and others, is anticipated to drive market expansion during the forecast period. Thus, such factors are driving the OTT market revenue.

    The rapid evolution of digital technology continues to reshape the landscape of media consumption, with over-the-top (OTT) services emerging as a dominant force in delivering content directly to consumers, thereby transforming traditional broadcasting paradigms.

    Federal Communications Commission (FCC)

    OTT Market Drivers

    Diverse Revenue Models

    The Global OTT Market Industry benefits from diverse revenue models that cater to varying consumer preferences. Subscription-based models, ad-supported content, and transactional video-on-demand services provide flexibility for users. This variety allows platforms to attract a wider audience, accommodating those who prefer free content alongside those willing to pay for premium experiences. As the market evolves, these models are likely to adapt, potentially leading to innovative hybrid approaches. The ability to monetize content through multiple channels suggests a robust framework for growth, contributing to the anticipated market size of 308.4 USD Billion by 2035.

    Market Growth Projections

    Rapid Technological Advancements

    The Global OTT Market Industry is experiencing rapid technological advancements that enhance user experience and content delivery. Innovations in streaming technology, such as adaptive bitrate streaming and improved compression algorithms, allow for higher quality video at lower bandwidths. This is particularly relevant as the industry anticipates a market size of 12.1 USD Billion in 2024. As technology continues to evolve, it is likely that more users will adopt OTT services, driving growth and increasing competition among providers. The integration of artificial intelligence for personalized content recommendations further enriches user engagement, suggesting that technological progress is a key driver in the Global OTT Market.

    Expansion of Internet Infrastructure

    The expansion of internet infrastructure plays a crucial role in the Global OTT Market Industry. Improved broadband access and the rollout of 5G technology are enabling faster and more reliable streaming experiences. As internet penetration increases globally, particularly in developing regions, more consumers gain access to OTT services. This trend is likely to contribute to the anticipated compound annual growth rate of 34.21% from 2025 to 2035. Enhanced connectivity not only facilitates the consumption of high-definition content but also encourages the development of localized OTT platforms, which can cater to specific regional preferences, thereby expanding the market further.

    Increased Investment in Original Content

    Increased investment in original content is a significant driver of the Global OTT Market Industry. Major platforms are allocating substantial budgets to produce exclusive shows and films, which attract subscribers and retain existing users. This trend is evident as companies strive to differentiate themselves in a crowded market. The focus on original programming not only enhances brand loyalty but also contributes to the overall growth of the market, which is projected to reach 12.1 USD Billion in 2024. By offering unique content that cannot be found elsewhere, OTT providers are likely to enhance their competitive edge, thereby driving further expansion in the Global OTT Market.

    Growing Consumer Demand for On-Demand Content

    Consumer demand for on-demand content is a pivotal driver in the Global OTT Market Industry. As lifestyles become increasingly busy, viewers prefer the flexibility of watching content at their convenience. This shift is reflected in the projected growth of the market, which is expected to reach 308.4 USD Billion by 2035. The rise of binge-watching culture, fueled by platforms offering entire seasons of shows, indicates a significant change in viewing habits. Furthermore, the availability of diverse content, including international films and niche genres, caters to a broader audience, suggesting that consumer preferences are shaping the landscape of the Global OTT Market.

    Market Segment Insights

    OTT Type Insights

    Based on type, the OTT Market segmentation includes game streaming, audio streaming, video streaming, and communication. The game streaming segment dominated the market, accounting for 40%-45% of market revenue. Companies involved in online gaming must reach out to many global customers while avoiding the prevalence of restrictions throughout the gaming experience. These businesses strive to provide a fast and secure online gaming experience, a rich media experience, and user tracking for various gaming applications.

    Figure 2: OTT Market by Type, 2022 & 2032 (USD billion)

    Source: Secondary Research, Primary Research, Market Research Future Database and Analyst Review

    OTT Streaming Devices Insights

    Based on streaming devices, the OTT Market segmentation includes smartphones and tablets, desktops and laptops, and IPTV and Consoles. The segment of smartphones and tablets is anticipated to dominate the market due to the expansion of 5G capabilities and the introduction of new smartphones. Similarly, the increasing use of smartphones and tablets to access online content is expected to contribute to the expansion of this segment.

    OTT Monetization Model Insights

    Based on monetization model, the OTT Market segmentation includes subscription-based, advertising-based, and transaction-Based. The subscription-based segment dominated the market in 2022. Innovative pricing, aggregation, and the accessibility of original premium content to users in the country have boosted the adoption of subscription services provided by OTT platforms.

    OTT Service Verticals Insights

    Based on service verticals, the OTT Market segmentation includes media and entertainment, education and learning, gaming, and service utilities. The media and entertainment category generated the most income. A growing number of consumers are carrying digital televisions in their pockets, creating an exciting opportunity for media buyers seeking to capitalize on shifting consumer trends.

    Get more detailed insights about OTT Market Research Report - Global Forecast till 2034

    Regional Insights

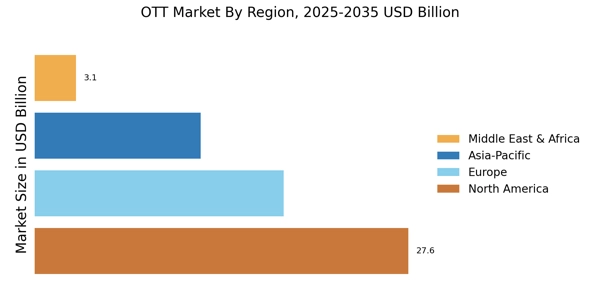
    By region, the study provides market insights into North America, Europe, Asia-Pacific, and the Rest of the World. The North American OTT market area will dominate this market in 2022. The ever-increasing substantial funds and investments in the content creation sector are continuously driving market expansion.

    Further, the major countries studied in the market report are The US, Canada, German, France, the UK, Italy, Spain, China, Japan, India, Australia, South Korea, and Brazil.

    Figure 3: OTT MARKET SHARE BY REGION 2022 (%)

    OTT MARKET SHARE BY REGION

    Source: Secondary Research, Primary Research, Market Research Future Database, and Analyst Review

    Europe OTT market accounted for the second-largest market share in 2022. Over-the-top (OTT) sports content is becoming increasingly attractive. Numerous companies are entering the OTT market, as evidenced by rising investments in content acquisition across this domain. Further, the German OTT market held the largest market share, and the UK OTT market was the fastest-growing market in the European region

    The Asia-Pacific OTT Market is expected to grow at the fastest CAGR from 2023 to 2032. The mature utility and broadcaster industries will most likely drive market development. Due to the accelerated cannibalization of the pay-TV market, China will likely dominate the region. Asian nations such as India are prepared to witness the meteoric rise of platforms, which is anticipated to provide tremendous market expansion potential for the region. Moreover, China’s OTT market held the largest market share, and the Indian OTT market was the fastest-growing market in the Asia-Pacific region.

    Key Players and Competitive Insights

    Leading market players are joining the streaming TV bandwagon, and the market is becoming more competitive, thereby increasing the competition for high-quality content that maintains viewers engaged. Market participants also undertake various strategic activities to expand their global footprint with important market developments. The OTT industry must offer cost-effective services to expand and survive in a more competitive and rising market.

    Major players in the OTT market, including Netflix, Inc., Amazon.com Inc. (Prime Video), The Walt Disney Company (Hulu), Tencent Holdings Ltd, Roku Inc., Google LLC (YouTube), DAZN Group Limited, NBC Universal (Hayu), and PCCW Media Group (Viu).

    Netflix Inc provides leisure services. The company provides original series, documentaries, and feature-length films through an internet subscription on TV, computer, and mobile devices. In addition, it offers a variety of recreational activities, video games, and other forms of entertainment. Netflix maintains a separate library of films that can be streamed instantly on subscribers' televisions, mobile devices, and computers. It acquires, produces, and licenses content, including original programming. The company markets and promotes its service through various marketing partners, including distributors of multichannel video programming, streaming entertainment providers, mobile operators, consumer electronics manufacturers, and internet service providers.

    It has a presence in EMEA, the Americas, and Asia-Pacific. Netflix's headquarters are located in Los Gatos, California.

    The Walt Disney Company is a media and entertainment company. It produces and acquires television programs as well as live-action and animated films. The company owns and operates theme parks, resorts, and television networks and channels; develops and publishes books, comics, and magazines; distributes Disney-themed products; and provides an English language curriculum for Chinese children. Disney operates cable networks under the ABC brand and cable channels under the FX, Freeform, Disney, ESPN, and National Geographic brands. It owns and operates retail locations throughout North America, Europe, and Asia. Disney's headquarters are located in Burbank, California.

    Key Companies in the OTT Market market include

    Industry Developments

    • Q1 2024: Streamticker: The Biggest Streaming Mergers and Acquisitions of 2024 In March 2024, Swedish OTT solutions provider Accedo acquired Easel TV, a U.K.-based rival, to bring both companies’ SaaS platforms under one roof. The Easel TV brand will be phased out as part of the integration.
    • Q2 2024: OTT Market to grow by USD 934.9 Billion from 2025-2029, driven by growing preference for cloud streaming services: Report on how AI is powering market evolution - Technavio In June 2024, Amazon Prime Video expanded its Channels vertical in India by partnering with 12 additional OTT players, including Lionsgate Play, Eros Now, MUBI, hoichoi, manoramaMAX, DocuBay, ShortsTV, discovery+, SonyLIV, ZEE5, and Aha, allowing subscribers to access these platforms' content within the Prime Video app.
    • Q1 2024: Streamticker: The Biggest Streaming Mergers and Acquisitions of 2024 Outbrain agreed to acquire Teads, an omnichannel video platform, from Altice in a $1 billion deal, giving Outbrain access to TV and video publishers and expanding its reach into the connected TV (CTV) market.

    Future Outlook

    OTT Market Future Outlook

    The Global OTT Market is projected to grow at a 34.21% CAGR from 2024 to 2035, driven by technological advancements, increased internet penetration, and evolving consumer preferences.

    New opportunities lie in:

    • Develop personalized content algorithms to enhance user engagement and retention.
    • Expand into emerging markets with localized content offerings and pricing strategies.
    • Leverage partnerships with telecom providers to bundle OTT services and increase subscriber base.

    By 2035, the OTT Market is expected to be a dominant force in global entertainment, reshaping consumption patterns.

    Market Segmentation

    OTT Type Outlook (USD Billion, 2018-2032)

    • Game Streaming
    • Audio Streaming
    • Video Streaming
    • Communication

    OTT Regional Outlook (USD Billion, 2018-2032)

    • US
    • Canada

    OTT Service Verticals Outlook (USD Billion, 2018-2032)

    • Media and Entertainment
    • Education and Learning
    • Gaming
    • Service Utilities

    OTT Streaming Devices Outlook (USD Billion, 2018-2032)

    • Smartphones and Tablets
    • Desktops and Laptops
    • IPTV and Consoles

    OTT Monetization Model Outlook (USD Billion, 2018-2032)

    • Subscription-Based
    • Advertising-based
    • Transaction-Based

    Report Scope

    Report Attribute/Metric Details
    Market Size 2024 61.40 (USD Billion)
    Market Size 2025 71.11 (USD Billion)
    Market Size 2034 266.31 (USD Billion)
    Compound Annual Growth Rate (CAGR) 15.80% (2025 - 2034)
    Report Coverage Revenue Forecast, Competitive Landscape, Growth Factors, and Trends
    Base Year 2024
    Market Forecast Period 2025 - 2034
    Historical Data 2019 - 2023
    Market Forecast Units USD Billion
    Segments Covered Type, Streaming Devices, Monetization Model, Service Verticals, and Region
    Geographies Covered North America, Europe, Asia Pacific, and the Rest of the World
    Countries Covered The US, Canada, German, France, UK, Italy, Spain, China, Japan, India, Australia, South Korea, and Brazil
    Key Companies Profiled Netflix, Inc., Amazon.com Inc. (Prime Video), The Walt Disney Company (Hulu), Tencent Holdings Ltd, Roku Inc., Google LLC (YouTube), DAZN Group Limited, NBC Universal (Hayu), and PCCW Media Group (Viu)
    Key Market Opportunities · Growing companies
    Key Market Dynamics · Increase consumers using OTT platforms ·  Rising number of gamers

    Market Highlights

    Author
    Ankit Gupta
    Senior Research Analyst

    Ankit Gupta is an analyst in market research industry in ICT and SEMI industry. With post-graduation in "Telecom and Marketing Management" and graduation in "Electronics and Telecommunication" vertical he is well versed with recent development in ICT industry as a whole. Having worked on more than 150+ reports including consultation for fortune 500 companies such as Microsoft and Rio Tinto in identifying solutions with respect to business problems his opinions are inclined towards mixture of technical and managerial aspects.

    Leave a Comment

    FAQs

    How much is the OTT market?

    The OTT Market size was valued at USD 61.40 billion in 2024.

    What is the growth rate of the OTT market?

    The global market is projected to grow at a CAGR of 15.80% during 2025-2034.

    Which region held the largest market share in the OTT market?

    North America had the largest share in the global market

    Who are the key players in the OTT market?

    The key players in the market are Netflix, Inc., Amazon.com Inc. (Prime Video), The Walt Disney Company (Hulu), Tencent Holdings Ltd, Roku Inc., Google LLC (YouTube), DAZN Group Limited, NBC Universal (Hayu), and PCCW Media Group (Viu).

    Which type led the OTT market?

    The game streaming category dominated the market in 2022.

    Which streaming devices had the largest market share in the OTT market?

    Smartphones and tablets had the largest share in the global market.

    1. 'TABLE OF CONTENTS
    2. EXECUTIVE SUMMARY
    3. MARKET INTRODUCTION
      1. Definition
      2. Scope of the Study
        1. Research Objective
        2. Assumptions
        3. Limitations
    4. RESEARCH METHODOLOGY
      1. Overview
      2. Data Mining
      3. Secondary Research
      4. Primary Research
        1. Primary Interviews
    5. and Information Gathering Process
      1. Breakdown of Primary Respondents
      2. Forecasting Modality
      3. Market Size Estimation
        1. Bottom-Up Approach
        2. Top-Down Approach
      4. Data Triangulation
      5. Validation
    6. MARKET DYNAMICS
      1. Overview
      2. Drivers
      3. Restraints
      4. Opportunities
    7. MARKET FACTOR ANALYSIS
      1. Value Chain Analysis
      2. Porter’s Five Forces Analysis
        1. Bargaining Power
    8. of Suppliers
    9. Bargaining Power of Buyers
      1. Threat of New Entrants
        1. Threat of Substitutes
        2. Intensity of Rivalry
      2. COVID-19 Impact Analysis
        1. Market Impact Analysis
        2. Regional Impact
        3. Opportunity and
    10. Threat Analysis
    11. GLOBAL OTT MARKET, BY TYPE
      1. Overview
      2. Game Streaming
      3. Audio Streaming
      4. Video Streaming
      5. Communication
    12. GLOBAL OTT MARKET, BY STREAMING DEVICES
      1. Overview
      2. Smartphones and Tablets
      3. Desktops and Laptops
      4. IPTV and Consoles
    13. GLOBAL OTT MARKET, BY MONETIZATION MODEL
      1. Overview
      2. Subscritption-Based
      3. Advertising-based
      4. Transaction-Based
    14. GLOBAL OTT MARKET,
    15. BY SERVICE VERTICALS
    16. Overview
    17. Media and Entertainment
      1. Education and Learning
      2. Gaming
      3. Service Utilities
    18. GLOBAL OTT MARKET, BY REGION
      1. Overview
      2. North America
        1. US
        2. Canada
      3. Europe
        1. Germany
        2. France
        3. UK
        4. Italy
        5. Spain
        6. Rest of Europe
      4. Asia-Pacific
        1. China
        2. India
        3. Japan
        4. South Korea
        5. Australia
        6. Rest of Asia-Pacific
      5. Rest of the World
        1. Middle East
        2. Africa
        3. Latin America
    19. COMPETITIVE LANDSCAPE
      1. Overview
      2. Competitive Analysis
      3. Market Share Analysis
      4. Major Growth Strategy
    20. in the Global OTT Market,
      1. Competitive Benchmarking
      2. Leading Players in Terms of Number of Developments
    21. in the Global OTT Market,
      1. Key developments and Growth Strategies
        1. New Product Launch/Service Deployment
        2. Merger &
    22. Acquisitions
    23. Joint Ventures
    24. Major Players Financial Matrix
      1. Sales & Operating Income, 2022
        1. Major Players R&D Expenditure. 2022
    25. COMPANY PROFILES
      1. Netflix, Inc.
        1. Company Overview
        2. Financial Overview
        3. Products Offered
        4. Key Developments
        5. SWOT Analysis
        6. Key Strategies
      2. Amazon.com Inc.
    26. (Prime Video)
    27. Company Overview
    28. Financial Overview
    29. Products Offered
    30. Key Developments
    31. SWOT Analysis
    32. Key Strategies
    33. The Walt Disney Company (Hulu)
      1. Company Overview
        1. Financial Overview
        2. Products Offered
        3. Key Developments
        4. SWOT Analysis
        5. Key Strategies
      2. Tencent Holdings Ltd
        1. Company Overview
        2. Financial Overview
        3. Products Offered
        4. Key Developments
        5. SWOT Analysis
        6. Key Strategies
      3. Roku Inc.
        1. Company Overview
        2. Financial Overview
        3. Products Offered
        4. Key Developments
        5. SWOT Analysis
        6. Key Strategies
      4. Google LLC (YouTube)
        1. Company Overview
        2. Financial Overview
        3. Products Offered
        4. Key Developments
        5. SWOT Analysis
        6. Key Strategies
      5. DAZN Group Limited
        1. Company Overview
        2. Financial Overview
        3. Products Offered
        4. Key Developments
        5. SWOT Analysis
        6. Key Strategies
      6. NBC UNIVERSAL (HAYU)
        1. Company Overview
        2. Financial Overview
        3. Products Offered
        4. Key Developments
        5. SWOT Analysis
        6. Key Strategies
      7. PCCW Media Group (Viu)
        1. Company Overview
        2. Financial Overview
        3. Products Offered
        4. Key Developments
        5. SWOT Analysis
        6. Key Strategies
    34. APPENDIX
      1. References
      2. Related Reports
    35. ESTIMATES & FORECAST, 2018–2032 (USD BILLION)
    36. (USD BILLION)
    37. GLOBAL OTT MARKET, BY STREAMING DEVICES, 2018–2032 (USD BILLION)
    38. BY MONETIZATION MODEL, 2018–2032 (USD BILLION)
    39. –2032 (USD BILLION)
    40. AMERICA: OTT MARKET, BY STREAMING DEVICES, 2018–2032 (USD BILLION)
    41. OTT MARKET, BY MONETIZATION MODEL, 2018–2032 (USD BILLION)
    42. BY SERVICE VERTICALS, 2018–2032 (USD BILLION)
    43. (USD BILLION)
    44. US: OTT MARKET, BY STREAMING DEVICES, 2018–2032 (USD BILLION)
    45. BY MONETIZATION MODEL, 2018–2032 (USD BILLION)
    46. (USD BILLION)
    47. CANADA: OTT MARKET, BY TYPE, 2018–2032 (USD BILLION)
    48. BY STREAMING DEVICES, 2018–2032 (USD BILLION)
    49. –2032 (USD BILLION)
    50. (USD BILLION)
    51. EUROPE: OTT MARKET, BY TYPE, 2018–2032 (USD BILLION)
    52. –2032 (USD BILLION)
    53. (USD BILLION)
    54. EUROPE: OTT MARKET, BY SERVICE VERTICALS, 2018–2032 (USD BILLION)
    55. MARKET, BY TYPE, 2018–2032 (USD BILLION)
    56. –2032 (USD BILLION)
    57. (USD BILLION)
    58. GERMANY: OTT MARKET, BY SERVICE VERTICALS, 2018–2032 (USD BILLION)
    59. BY TYPE, 2018–2032 (USD BILLION)
    60. (USD BILLION)
    61. FRANCE: OTT MARKET, BY MONETIZATION MODEL, 2018–2032 (USD BILLION)
    62. MARKET, BY SERVICE VERTICALS, 2018–2032 (USD BILLION)
    63. (USD BILLION)
    64. ITALY: OTT MARKET, BY STREAMING DEVICES, 2018–2032 (USD BILLION)
    65. BY MONETIZATION MODEL, 2018–2032 (USD BILLION)
    66. –2032 (USD BILLION)
    67. BY STREAMING DEVICES, 2018–2032 (USD BILLION)
    68. –2032 (USD BILLION)
    69. BILLION)
    70. UK: OTT MARKET, BY TYPE, 2018–2032 (USD BILLION)
    71. (USD BILLION)
    72. UK: OTT MARKET, BY MONETIZATION MODEL, 2018–2032 (USD BILLION)
    73. BY SERVICE VERTICALS, 2018–2032 (USD BILLION)
    74. (USD BILLION)
    75. REST OF EUROPE: OTT MARKET, BY STREAMING DEVICES, 2018–2032 (USD BILLION)
    76. OTT MARKET, BY MONETIZATION MODEL, 2018–2032 (USD BILLION)
    77. MARKET, BY SERVICE VERTICALS, 2018–2032 (USD BILLION)
    78. (USD BILLION)
    79. ASIA-PACIFIC: OTT MARKET, BY STREAMING DEVICES, 2018–2032 (USD BILLION)
    80. OTT MARKET, BY MONETIZATION MODEL, 2018–2032 (USD BILLION)
    81. BY SERVICE VERTICALS, 2018–2032 (USD BILLION)
    82. (USD BILLION)
    83. JAPAN: OTT MARKET, BY STREAMING DEVICES, 2018–2032 (USD BILLION)
    84. BY MONETIZATION MODEL, 2018–2032 (USD BILLION)
    85. –2032 (USD BILLION)
    86. BY STREAMING DEVICES, 2018–2032 (USD BILLION)
    87. –2032 (USD BILLION)
    88. BILLION)
    89. INDIA: OTT MARKET, BY TYPE, 2018–2032 (USD BILLION)
    90. STREAMING DEVICES, 2018–2032 (USD BILLION)
    91. –2032 (USD BILLION)
    92. BILLION)
    93. AUSTRALIA: OTT MARKET, BY TYPE, 2018–2032 (USD BILLION)
    94. BY STREAMING DEVICES, 2018–2032 (USD BILLION)
    95. –2032 (USD BILLION)
    96. (USD BILLION)
    97. SOUTH KOREA: OTT MARKET, BY TYPE, 2018–2032 (USD BILLION)
    98. BY STREAMING DEVICES, 2018–2032 (USD BILLION)
    99. MODEL, 2018–2032 (USD BILLION)
    100. –2032 (USD BILLION)
    101. (USD BILLION)
    102. REST OF ASIA-PACIFIC: OTT MARKET, BY STREAMING DEVICES, 2018–2032 (USD
    103. BILLION)
    104. REST OF ASIA-PACIFIC: OTT MARKET, BY MONETIZATION MODEL, 2018–2032 (USD
    105. BILLION)
    106. REST OF ASIA-PACIFIC: OTT MARKET, BY SERVICE VERTICALS, 2018–2032 (USD
    107. BILLION)
    108. REST OF THE WORLD: OTT MARKET, BY TYPE, 2018–2032 (USD BILLION)
    109. WORLD: OTT MARKET, BY STREAMING DEVICES, 2018–2032 (USD BILLION)
    110. WORLD: OTT MARKET, BY MONETIZATION MODEL, 2018–2032 (USD BILLION)
    111. WORLD: OTT MARKET, BY SERVICE VERTICALS, 2018–2032 (USD BILLION)
    112. OTT MARKET, BY TYPE, 2018–2032 (USD BILLION)
    113. –2032 (USD BILLION)
    114. (USD BILLION)
    115. MIDDLE EAST: OTT MARKET, BY SERVICE VERTICALS, 2018–2032 (USD BILLION)
    116. MARKET, BY TYPE, 2018–2032 (USD BILLION)
    117. –2032 (USD BILLION)
    118. (USD BILLION)
    119. AFRICA: OTT MARKET, BY SERVICE VERTICALS, 2018–2032 (USD BILLION)
    120. OTT MARKET, BY TYPE, 2018–2032 (USD BILLION)
    121. DEVICES, 2018–2032 (USD BILLION)
    122. –2032 (USD BILLION)
    123. (USD BILLION)
    124. LIST
    125. OF FIGURES
    126. RESEARCH PROCESS
    127. MARKET STRUCTURE FOR THE GLOBAL OTT MARKET
    128. SHARE (%), BY TYPE, 2022
    129. SHARE (%), BY MONETIZATION MODEL, 2022
    130. GLOBAL OTT MARKET, SHARE (%), BY REGION, 2022
    131. REGION, 2022
    132. EUROPE: OTT MARKET, SHARE (%), BY REGION, 2022
    133. REGION, 2022
    134. REST OF THE WORLD: OTT MARKET, SHARE (%), BY REGION, 2022
    135. COMPANY SHARE ANALYSIS, 2022 (%)
    136. ANALYSIS
    137. AMAZON.COM INC. (PRIME VIDEO): FINANCIAL OVERVIEW SNAPSHOT
    138. VIDEO): SWOT ANALYSIS
    139. THE WALT DISNEY COMPANY (HULU): FINANCIAL OVERVIEW SNAPSHOT
    140. (HULU): SWOT ANALYSIS
    141. TENCENT HOLDINGS LTD: FINANCIAL OVERVIEW SNAPSHOT
    142. FINANCIAL OVERVIEW SNAPSHOT
    143. SNAPSHOT
    144. GOOGLE LLC (YOUTUBE): SWOT ANALYSIS
    145. DAZN GROUP LIMITED: SWOT ANALYSIS
    146. (HAYU): SWOT ANALYSIS
    147. PCCW MEDIA GROUP (VIU): FINANCIAL OVERVIEW SNAPSHOT

    OTT Market Segmentation

    OTT Type Outlook (USD Billion, 2018-2032)

    • Game Streaming
    • Audio Streaming
    • Video Streaming
    • Communication

    OTT Streaming Devices Outlook (USD Billion, 2018-2032)

    • Smartphones and Tablets
    • Desktops and Laptops
    • IPTV and Consoles

    OTT Monetization Model Outlook (USD Billion, 2018-2032)

    • Subscription-Based
    • Advertising-based
    • Transaction-Based

    OTT Service Verticals Outlook (USD Billion, 2018-2032)

    • Media and Entertainment
    • Education and Learning
    • Gaming
    • Service Utilities

    OTT Regional Outlook (USD Billion, 2018-2032)

    • North America Outlook (USD Billion, 2018-2032)

      • North America OTT by Type
        • Game Streaming
        • Audio Streaming
        • Video Streaming
        • Communication
      • North America OTT by Streaming Devices
        • > Smartphones and Tablets
        • Desktops and Laptops
        • IPTV and Consoles
      • North America OTT by Monetization Model

        • Subscription-Based
        • Advertising-based
        • Transaction-Based
      • North America OTT by Service Verticals

        • Media and Entertainment
        • Education and Learning
        • Gaming
        • Service Utilities
      • US Outlook (USD Billion, 2018-2032)

      • US OTT by Type
        • Game Streaming
        • Audio Streaming
        • Video Streaming
        • Communication
      • US OTT by Streaming Devices
        • Smartphones and Tablets
        • Desktops and Laptops
        • IPTV and Consoles
      • US OTT by Monetization Model

        • Subscription-Based
        • Advertising-based
        • Transaction-Based
      • US OTT by Service verticals

        • Media and Entertainment
        • Education and Learning
        • Gaming
        • Service Utilities
      • CANADA Outlook (USD Billion, 2018-2032)

      • CANADA OTT by Type
        • Game Streaming
        • Audio Streaming
        • Video Streaming
        • Communication
      • CANADA OTT by Streaming Devices
        • Smartphones and Tablets
        • Desktops and Laptops
        • IPTV and Consoles
      • CANADA OTT by Monetization Model

        • Subscription-Based
        • Advertising-based
        • Transaction-Based
      • CANADA OTT by Service verticals

        • Media and Entertainment
        • Education and Learning
        • Gaming
        • Service Utilities
    • Europe Outlook (USD Billion, 2018-2032)

      • Europe OTT by Type
        • Game Streaming
        • Audio Streaming
        • Video Streaming
        • Communication
      • Europe OTT by Streaming Devices
        • Smartphones and Tablets
        • Desktops and Laptops
        • IPTV and Consoles
      • Europe OTT by Monetization Model

        • Subscription-Based
        • Advertising-based
        • Transaction-Based
      • Europe OTT by Service verticals

        • Media and Entertainment
        • Education and Learning
        • Gaming
        • Service Utilities
      • Germany Outlook (USD Billion, 2018-2032)

      • Germany OTT by Type
        • Game Streaming
        • Audio Streaming
        • Video Streaming
        • Communication
      • Germany OTT by Streaming Devices
        • Smartphones and Tablets
        • Desktops and Laptops
        • IPTV and Consoles
      • Germany OTT by Monetization Model

        • Subscription-Based
        • Advertising-based
        • Transaction-Based
      • Germany OTT by Service verticals

        • Media and Entertainment
        • Education and Learning
        • Gaming
        • Service Utilities
      • France Outlook (USD Billion, 2018-2032)

      • France OTT by Type
        • Game Streaming
        • Audio Streaming
        • Video Streaming
        • Communication
      • France OTT by Streaming Devices
        • Smartphones and Tablets
        • Desktops and Laptops
        • IPTV and Consoles
      • France OTT by Monetization Model

        • Subscription-Based
        • Advertising-based
        • Transaction-Based
      • France OTT by Service verticals

        • Media and Entertainment
        • Education and Learning
        • Gaming
        • Service Utilities
      • UK Outlook (USD Billion, 2018-2032)

      • UK OTT by Type
        • Game Streaming
        • Audio Streaming
        • Video Streaming
        • Communication
      • UK OTT by Streaming Devices
        • Smartphones and Tablets
        • Desktops and Laptops
        • IPTV and Consoles
      • UK OTT by Monetization Model

        • Subscription-Based
        • Advertising-based
        • Transaction-Based
      • UK OTT by Service verticals

        • Media and Entertainment
        • Education and Learning
        • Gaming
        • Service Utilities
      • ITALY Outlook (USD Billion, 2018-2032)

      • ITALY OTT by Type
        • Game Streaming
        • Audio Streaming
        • Video Streaming
        • Communication
      • ITALY OTT by Streaming Devices
        • Smartphones and Tablets
        • Desktops and Laptops
        • IPTV and Consoles
      • ITALY OTT by Monetization Model

        • Subscription-Based
        • Advertising-based
        • Transaction-Based
      • ITALY OTT by Service verticals

        • Media and Entertainment
        • Education and Learning
        • Gaming
        • Service Utilities
      • SPAIN Outlook (USD Billion, 2018-2032)

      • Spain OTT by Type
        • Game Streaming
        • Audio Streaming
        • Video Streaming
        • Communication
      • Spain OTT by Streaming Devices
        • Smartphones and Tablets
        • Desktops and Laptops
        • IPTV and Consoles
      • Spain OTT by Monetization Model

        • Subscription-Based
        • Advertising-based
        • Transaction-Based
      • Spain OTT by Service verticals

        • Media and Entertainment
        • Education and Learning
        • Gaming
        • Service Utilities
      • Rest Of Europe Outlook (USD Billion, 2018-2032)

      • Rest Of Europe OTT by Type
        • Game Streaming
        • Audio Streaming
        • Video Streaming
        • Communication
      • REST OF EUROPE OTT by Streaming Devices
        • Smartphones and Tablets
        • Desktops and Laptops
        • IPTV and Consoles
      • REST OF EUROPE OTT by Monetization Model

        • Subscription-Based
        • Advertising-based
        • Transaction-Based
      • REST OF EUROPE OTT by Service verticals

        • Media and Entertainment
        • Education and Learning
        • Gaming
        • Service Utilities
    • Asia-Pacific Outlook (USD Billion, 2018-2032)

      • Asia-Pacific OTT by Type
        • Game Streaming
        • Audio Streaming
        • Video Streaming
        • Communication
      • Asia-Pacific OTT by Streaming Devices
        • Smartphones and Tablets
        • Desktops and Laptops
        • IPTV and Consoles
      • Asia-Pacific OTT by Monetization Model

        • Subscription-Based
        • Advertising-based
        • Transaction-Based
      • Asia-Pacific OTT by Service verticals

        • Media and Entertainment
        • Education and Learning
        • Gaming
        • Service Utilities
      • China Outlook (USD Billion, 2018-2032)

      • China OTT by Type
        • Game Streaming
        • Audio Streaming
        • Video Streaming
        • Communication
      • China OTT by Streaming Devices
        • Smartphones and Tablets
        • Desktops and Laptops
        • IPTV and Consoles
      • China OTT by Monetization Model

        • Subscription-Based
        • Advertising-based
        • Transaction-Based
      • China OTT by Service verticals

        • Media and Entertainment
        • Education and Learning
        • Gaming
        • Service Utilities
      • Japan Outlook (USD Billion, 2018-2032)

      • Japan OTT by Type
        • Game Streaming
        • Audio Streaming
        • Video Streaming
        • Communication
      • Japan OTT by Streaming Devices
        • Smartphones and Tablets
        • Desktops and Laptops
        • IPTV and Consoles
      • Japan OTT by Monetization Model

        • Subscription-Based
        • Advertising-based
        • Transaction-Based
      • Japan OTT by Service verticals

        • Media and Entertainment
        • Education and Learning
        • Gaming
        • Service Utilities
      • India Outlook (USD Billion, 2018-2032)

      • India OTT by Type
        • Game Streaming
        • Audio Streaming
        • Video Streaming
        • Communication
      • India OTT by Streaming Devices
        • Smartphones and Tablets
        • Desktops and Laptops
        • IPTV and Consoles
      • India OTT by Monetization Model

        • Subscription-Based
        • Advertising-based
        • Transaction-Based
      • India OTT by Service verticals

        • Based on Service verticals:
        • Media and Entertainment
        • Education and Learning
        • Gaming
        • Service Utilities
      • Australia Outlook (USD Billion, 2018-2032)

      • Australia OTT by Type
        • Game Streaming
        • Audio Streaming
        • Video Streaming
        • Communication
      • Australia OTT by Streaming Devices
        • Smartphones and Tablets
        • Desktops and Laptops
        • IPTV and Consoles
      • Australia OTT by Monetization Model

        • Subscription-Based
        • Advertising-based
        • Transaction-Based
      • Australia OTT by Service verticals

        • Media and Entertainment
        • Education and Learning
        • Gaming
        • Service Utilities
      • Rest of Asia-Pacific Outlook (USD Billion, 2018-2032)

      • Rest of Asia-Pacific OTT by Type
        • Game Streaming
        • Audio Streaming
        • Video Streaming
        • Communication
      • Rest of Asia-Pacific OTT by Streaming Devices
        • Smartphones and Tablets
        • Desktops and Laptops
        • IPTV and Consoles
      • Rest of Asia-Pacific OTT by Monetization Model

        • Subscription-Based
        • Advertising-based
        • Transaction-Based
      • Rest of Asia-Pacific OTT by Service verticals

        • Media and Entertainment
        • Education and Learning
        • Gaming
        • Service Utilities
    • Rest of the World Outlook (USD Billion, 2018-2032)

      • Rest of the World OTT by Type
        • Game Streaming
        • Audio Streaming
        • Video Streaming
        • Communication
      • Rest of the World OTT by Streaming Devices
        • Smartphones and Tablets
        • Desktops and Laptops
        • IPTV and Consoles
      • Rest of the World OTT by Monetization Model

        • Subscription-Based
        • Advertising-based
        • Transaction-Based
      • Rest of the World OTT by Service verticals

        • Media and Entertainment
        • Education and Learning
        • Gaming
        • Service Utilities
      • Middle East Outlook (USD Billion, 2018-2032)

      • Middle East OTT by Type
        • Game Streaming
        • Audio Streaming
        • Video Streaming
        • Communication
      • Middle East OTT by Streaming Devices
        • Smartphones and Tablets
        • Desktops and Laptops
        • IPTV and Consoles
      • Middle East OTT by Monetization Model

        • Subscription-Based
        • Advertising-based
        • Transaction-Based
      • Middle East OTT by Service verticals

        • Media and Entertainment
        • Education and Learning
        • Gaming
        • Service Utilities
      • Billion, 2018-2032)

      • Africa OTT by Type
        • Game Streaming
        • Audio Streaming
        • Video Streaming
        • Communication
      • Africa OTT by Streaming Devices
        • Smartphones and Tablets
        • Desktops and Laptops
        • IPTV and Consoles
      • Africa OTT by Monetization Model

        • Subscription-Based
        • Advertising-based
        • Transaction-Based
      • Africa OTT by Service verticals

        • Media and Entertainment
        • Education and Learning
        • Gaming
        • Service Utilities
      • Latin America Outlook (USD Billion, 2018-2032)

      • Latin America OTT by Type
        • Game Streaming
        • Audio Streaming
        • Video Streaming
        • Communication
      • Latin America OTT by Streaming Devices
        • Smartphones and Tablets
        • Desktops and Laptops
        • IPTV and Consoles
      • Latin America OTT by Monetization Model

        • Subscription-Based
        • Advertising-based
        • Transaction-Based
      • Latin America OTT by Service verticals

        • Media and Entertainment
        • Education and Learning
        • Gaming
        • Service Utilities
    OTT Market Research Report - Global Forecast till 2034 Infographic
    Free Sample Request

    Kindly complete the form below to receive a free sample of this Report

    Customer Strories

    “I am very pleased with how market segments have been defined in a relevant way for my purposes (such as "Portable Freezers & refrigerators" and "last-mile"). In general the report is well structured. Thanks very much for your efforts.”

    Victoria Milne Founder
    Case Study

    Chemicals and Materials