• Cat-intel
  • MedIntelliX
  • Resources
  • About Us
  • Request Free Sample ×

    Kindly complete the form below to receive a free sample of this Report

    Leading companies partner with us for data-driven Insights

    clients tt-cursor

    Nutritional Bar Market

    ID: MRFR/F-B & N/3439-HCR
    110 Pages
    Varsha More
    September 2025

    Nutritional Bar Market Research Report Information By Type (Protein Bars, Snack Bars, Whole Foods Car, Meal Replacement Card, and Others), By Flavours (Chocolate, Peanut Butter, Fruits, Spices, and Others), By Distribution Channel (Store-Based, and Non-Store-Based), And By Region (North America, Europe, Asia-Pacific, And Rest Of The World) – Market Forecast Till 2030

    Share:
    Download PDF ×

    We do not share your information with anyone. However, we may send you emails based on your report interest from time to time. You may contact us at any time to opt-out.

    Nutritional Bar Market Research Report - Forecast till 2030 Infographic
    Purchase Options
    $ 4,950.0
    $ 5,950.0
    $ 7,250.0
    Table of Contents

    Nutritional Bar Market Summary

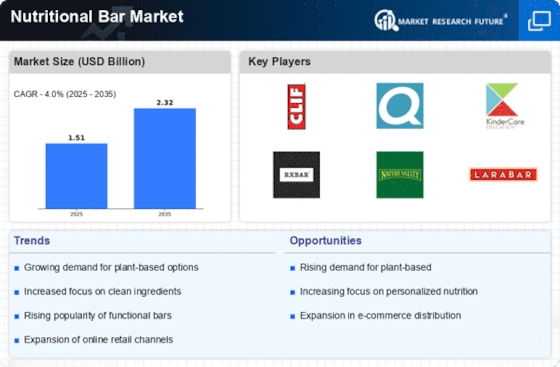
    As per Market Research Future Analysis, the Global Nutritional Bar Market was valued at USD 1.4 billion in 2022 and is projected to grow from USD 1.45 billion in 2023 to USD 1.84 billion by 2030, with a CAGR of 4.00% during the forecast period. Key drivers include the rising demand for convenient and healthy snacks, increased health consciousness, and the popularity of plant-based diets. The market is segmented into protein bars, snack bars, meal replacement bars, and others, with protein bars holding the majority share. The Asia-Pacific region is expected to exhibit significant growth, driven by urbanization and health awareness.

    Key Market Trends & Highlights

    The Nutritional Bar market is witnessing several key trends that are shaping its growth trajectory.

    • Growing demand for convenient and healthy snacks is boosting market growth.
    • The protein bars segment held the majority share in 2022, driven by high protein demand.
    • The Asia-Pacific market accounted for USD 0.6412 billion in 2022 and is expected to grow at the fastest CAGR.
    • Peanut butter flavor dominated the market in 2022 and is projected to be the fastest-growing segment.

    Market Size & Forecast

    2022 Market Size USD 1.4 Billion
    2023 Market Size USD 1.45 Billion
    2030 Market Size USD 1.84 Billion
    CAGR 4.00%

    Major Players

    Key players include Atkins Nutritionals Inc., Clif Bar & Company, General Mills Inc., Kellogg Co., Kashi Company, Quaker Oats Company, and Mars Incorporated.

    Nutritional Bar Market Trends

      • Growing demand for convenient and healthy snacks to boost market growth

    With busy lifestyles and on-the-go eating habits, consumers are increasingly turning to convenient snacks that are also healthy. It provides a convenient and portable option that can be easily incorporated into a busy lifestyle. Nutrition bars can provide a range of health benefits, such as protein, fiber, vitamins, and minerals, making them an attractive option for health-conscious consumers. Manufacturers are introducing new and innovative flavors and formats of Nutritional Bar to cater to different tastes and preferences.

    Moreover, there has been a surge in demand for plant-based products due to concerns around animal welfare and environmental sustainability. Many nutrition bars are made with plant-based ingredients, making them a popular option for consumers looking for vegan or vegetarian snacks.

    The growing consumer inclination towards health and wellness is reshaping the nutritional bar market, as individuals increasingly seek convenient and nutritious options to complement their active lifestyles.

    U.S. Department of Agriculture

    Nutritional Bar Market Drivers

    E-commerce Growth

    The rise of e-commerce platforms is transforming the Global Nutritional Bar Market Industry by providing consumers with greater access to a variety of products. Online shopping offers convenience and the ability to compare different brands and nutritional profiles easily. This trend is expected to facilitate market expansion, as consumers increasingly turn to online retailers for their nutritional needs. The accessibility of nutritional bars through e-commerce channels may contribute to the overall market growth, allowing brands to reach a wider audience and cater to the evolving shopping preferences of consumers.

    Market Growth Chart

    Health Consciousness

    The increasing global awareness of health and wellness is a primary driver of the Global Nutritional Bar Market Industry. Consumers are increasingly seeking convenient, nutritious options that align with their dietary preferences. This trend is evident as the market is projected to reach 1.49 USD Billion in 2024, reflecting a growing demand for products that offer functional benefits such as protein enrichment and low sugar content. As more individuals prioritize their health, nutritional bars are becoming a staple for on-the-go nutrition, appealing to various demographics including athletes and busy professionals.

    Diverse Flavor Profiles

    The expansion of flavor options within the Global Nutritional Bar Market Industry serves as a compelling driver for consumer interest. Manufacturers are innovating to create a wide array of flavors that cater to diverse palates, from sweet to savory. This variety not only enhances consumer satisfaction but also encourages trial and repeat purchases. As the market evolves, the introduction of unique flavors may attract new customers, thereby contributing to the anticipated CAGR of 3.76% from 2025 to 2035. This trend indicates a shift towards personalization in nutrition, allowing consumers to enjoy healthy snacks without compromising on taste.

    Rise of Plant-Based Ingredients

    The growing preference for plant-based diets is reshaping the Global Nutritional Bar Market Industry. As consumers become more environmentally conscious and health-focused, there is a notable shift towards bars that incorporate plant-based proteins and ingredients. This trend is likely to drive innovation in product formulations, leading to the development of bars that are not only nutritious but also sustainable. The increasing demand for plant-based options aligns with the overall market growth, as consumers seek alternatives that reflect their values and dietary choices, potentially enhancing market penetration.

    Convenience and On-the-Go Consumption

    The fast-paced lifestyle of modern consumers significantly influences the Global Nutritional Bar Market Industry. As individuals seek quick and easy meal solutions, nutritional bars provide a convenient option that fits seamlessly into busy schedules. This trend is likely to contribute to the market's growth, with projections indicating an increase to 2.24 USD Billion by 2035. The portability and ease of consumption make these bars an attractive choice for consumers looking for healthy snacks that can be consumed anywhere, whether at work, during travel, or while exercising.

    Market Segment Insights

    Nutritional Bar Type Insights

    The Nutritional Bar market segmentation, based on Type, includes protein bars, snack bars, meal replacement cards, Whole Foods car, and others. The protein bars segment held the majority share in 2022 contribution to the Nutritional Bar market revenue. This is because they are typically high in protein and low in carbohydrates, making them a popular option for athletes, fitness enthusiasts, and those looking to build muscle. The market for protein bars is expected to continue growing due to increasing demand for protein-rich snacks and the popularity of high-protein diets.

    March 2019: Mars Inc. announced the acquisition of a majority stake in a sports nutrition company named Foodspring. Foodspring offers a range of Protein Bars and snacks aimed at athletes and fitness enthusiasts.

    Nutritional Bar Flavours Insights

    The Nutritional Bar market segmentation, based on flavours, includes chocolate, peanut butter, fruits, spices, and others. The peanut butter segment dominated the market in 2022 and is projected to be the faster-growing segment during the forecast period, 2022-2030. These are made with natural ingredients such as dried fruits, nuts, and seeds. These bars are often marketed as a healthy and natural snack option, and are popular among consumers who are looking for a whole food-based snack option.

    January 2020: RxBar launched their "RX Nut Butter" line, featuring single-serve pouches of almond and peanut butter with added protein.

    Nutritional Bar Distribution Channel Insights

    The Nutritional Bar market data has been bifurcated by distribution channel into store-based, and non-store-based. The store-based distribution channel segment dominated the market in 2022. This is because nutritional bar can be purchased from a variety of retail channels, including supermarkets, convenience stores, and health food stores. However, the non-store-based segment is expected to grow at a faster rate. This growth is being driven by the increasing popularity of e-commerce and the convenience it provides to consumers.

    The distribution channel can impact the price and availability of nutritional bar, with online retailers often offering a wider selection of brands and flavors at a lower price point. 

    Figure 1: Nutritional Bar Market, by Distribution Channel, 2022 & 2030 (USD Billion)

    Source: Secondary Research, Primary Research, Market Research Future Database and Analyst Review

    Get more detailed insights about Nutritional Bar Market Research Report - Forecast till 2030

    Regional Insights

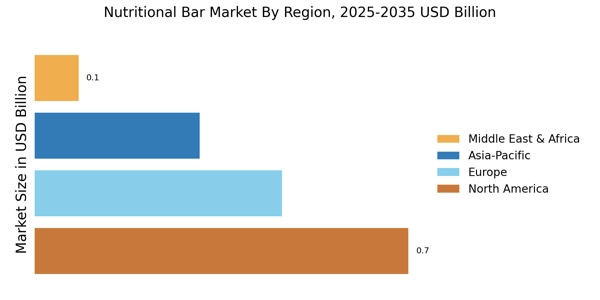
    By Region, the study provides the market insights into North America, Europe, Asia-Pacific and Rest of the World. Asia Pacific nutritional bar market accounted for USD 0.6412 billion in 2022 and is expected to exhibit a significant CAGR growth during the study period. The region is driven by the growing demand for healthy and convenient snacks, as well as the rise in health consciousness and fitness trends. The United States is the largest market in the region, followed by Canada and Mexico.

    Further, the major countries studied in the market report are: The U.S, Canada, Germany, France, UK, Italy, Spain, China, Japan, India, Australia, South Korea, and Brazil.

    Figure 2: NUTRITIONAL BAR MARKET SHARE BY REGION 2022 (%)NUTRITIONAL BAR MARKET SHARE BY REGION 2022

    Source: Secondary Research, Primary Research, Market Research Future Database and Analyst Review

    Europe Nutritional Bar market accounts for the second-largest market share. The market is driven by the increasing demand for Nutritional Bar among health-conscious consumers and the growing popularity of vegan and plant-based diets. The market is also driven by the high disposable income of consumers in the region. Further, the Germany Nutritional Bar market held the largest market share, and the UK Nutritional Bar market was the fastest growing market in the European region due to the high demand for Nutritional Bar and the presence of several major manufacturers in the country.

    The Asia-Pacific Nutritional Bar market is expected to grow at the fastest CAGR from 2022 to 2030. The market is driven by rising disposable incomes, urbanization, and increasing health awareness among consumers. The market is dominated by countries such as China, India, and Japan. The region is also witnessing a rise in demand for plant-based and vegan Nutritional Bar. Moreover, China Nutritional Bar market held the largest market share, and the India Nutritional Bar market was the fastest growing market in the Asia-Pacific region.

    Key Players and Competitive Insights

    Major market players are spending a lot of money on R&D to increase their product lines, which will help the Nutritional Bar market grow even more. Market participants are also taking a range of strategic initiatives to grow their worldwide footprint, with key market developments such as new product launches, contractual agreements, mergers and acquisitions, increased investments, and collaboration with other organizations. Competitors in the Nutritional Bar industry must offer cost-effective items to expand and survive in an increasingly competitive and rising market environment.

    One of the primary business strategies adopted by manufacturers in the Nutritional Bar industry to benefit clients and expand the market sector is to manufacture locally to reduce operating costs. In recent years, Nutritional Bar industry has provided innovative products with some of the most significant benefits. The Nutritional Bar market major player such as Atkins Nutritionals Inc. (U.S.), Clif Bar & Company. (U.S.), General Mills Inc. (U.S.), Kellogg Co. (U.S.), Kashi Company (U.S.), Quaker Oats Company (U.S.), Mars Incorporated (U.S.), GoMacroand others are working to expand the market demand by investing in research and development activities.

    General Mills Inc. is a multinational food company that manufactures and markets a wide range of consumer food products. The company was founded in 1866 and is headquartered in Minnesota, USA. General Mills has a diverse portfolio of brands, including Cheerios, Betty Crocker, Yoplait, Pillsbury, and Nature Valley, among others. One of General Mills popular product lines is Nature Valley Nutritional Bar. These bars are made with natural ingredients such as whole grain oats, nuts, and seeds and provide a convenient and nutritious snack option for consumers.

    In February 2021, General Mills announced the acquisition of a nutrition bar company named One Brands. One Brands offers a range of Nutritional Bar made with whey and milk protein.

    Clif Bar & Company is a privately held American company that produces and sells organic foods and drinks, with a focus on sports nutrition products such as energy bars, protein bars, and gels. The company was founded in 1992 and is based in Emeryville, California. In  March 2019,  Clif Bar & Company launched their "CLIF Whey Protein Bar" line, which features bars made with non-GMO whey protein from grass-fed cows.

    Key Companies in the Nutritional Bar Market market include

    Industry Developments

    January 2019: KIND Snacks announced a partnership with Mars, Inc. to expand their product offerings and reach.

    May 2019: Simply Good Foods acquired Quest Nutrition, a leading provider of protein bars, for $1 billion.

    February 2020: Nestle announced a partnership with Terracycle to launch a program allowing consumers to recycle packaging for their YES! snack bars.

    September 2020: KIND Snacks launched their "KIND Energy" line, featuring bars made with caffeine from coffee and whole grains.

    January 2021: The Hershey Company acquired ONE Brands, a leading provider of protein bars, for $397 million.

    March 2021: Nature's Path Foods announced a partnership with CLIF Bar & Company to launch a line of "CLIF Organic Trail Mix Bars" made with organic ingredients.

    October 2021: Simply Good Foods announced the acquisition of Quest Nutrition's ready-to-drink shakes business for $206 million.

    Future Outlook

    Nutritional Bar Market Future Outlook

    The Global Nutritional Bar Market is projected to grow at a 3.76% CAGR from 2024 to 2035, driven by increasing health consciousness, demand for convenient nutrition, and innovation in product formulations.

    New opportunities lie in:

    • Develop plant-based nutritional bars targeting vegan consumers.
    • Leverage e-commerce platforms for direct-to-consumer sales strategies.
    • Invest in personalized nutrition solutions through data-driven consumer insights.

    By 2035, the market is expected to exhibit robust growth, reflecting evolving consumer preferences and innovative product offerings.

    Market Segmentation

    Nutritional Bar Type Outlook

    • Protein Bars
    • Snack Bars
    • Whole Foods Car
    • Meal Replacement Card
    • Others

    Nutritional Bar Flavours Outlook

    • Chocolate
    • Peanut Butter
    • Fruits
    • Spices
    • Others

    Nutritional Bar Regional Outlook

    North America
    • US
    • Canada

    Nutritional Bar Distribution Channel Outlook

    • Store-Based
    • Non-Store-Based

    Report Scope

    Attribute/Metric Details
    Market Size 2022 USD 1.4 billion
    Market Size 2023 USD 1.45 billion
    Market Size 2030 USD 1.84 billion
    Compound Annual Growth Rate (CAGR) 4.00% (2023-2030)
    Base Year 2022
    Market Forecast Period 2023-2030
    Historical Data 2019 - 2021
    Market Forecast Units Value (USD Billion)
    Report Coverage Revenue Forecast, Market Competitive Landscape, Growth Factors, and Trends
    Segments Covered Type, Flavours, Distribution Channel and Region
    Geographies Covered North America, Europe, Asia Pacific, and Rest of the World
    Countries Covered The U.S, Canada, Germany, France, UK, Italy, Spain, China, Japan, India, Australia, South Korea, and Brazil
    Key Companies Profiled Atkins Nutritionals Inc. (U.S.), Clif Bar & Company. (U.S.), General Mills Inc. (U.S.), Kellogg Co. (U.S.), Kashi Company (U.S.), Quaker Oats Company (U.S.), Mars Incorporated (U.S.), and GoMacro
    Key Market Opportunities Rise in health consciousness and fitness trends
    Key Market Dynamics Growing demand for convenient and healthy snacks

    Market Highlights

    Author
    Varsha More
    Research Analyst

    Experienced business professional with a demonstrated history of working in the CFnB industry. Skilled in market research, and market estimation. Strong professional with a Masters focused in marketing management.

    Leave a Comment

    FAQs

    How much is the Nutritional Bar market?

    The Nutritional Bar market size was valued at USD 1.45 Billion in 2023.

    What is the growth rate of the Nutritional Bar market?

    The market is projected to grow at a CAGR of 4.00% during the forecast period, 2023-2030.

    Which region held the largest market share in the Nutritional Bar market?

    Asia-Pacific had the largest share in the market

    Who are the key players in the Nutritional Bar market?

    The key players in the market are Atkins Nutritionals Inc. (U.S.), Clif Bar & Company. (U.S.), General Mills Inc. (U.S.), Kellogg Co. (U.S.), Kashi Company (U.S.), Quaker Oats Company (U.S.), Mars Incorporated (U.S.), and GoMacro.

    Which flavours led the Nutritional Bar market?

    The Peanut Butter Nutritional Bar Flavours dominated the market in 2023.

    Which distribution channel had the largest market share in the Nutritional Bar market?

    The store-based had the largest share in the market.

    1. 'Table of Content
    2. Chapter 1. Methodology
    3. and Scope
    4. Research Methodology
    5. Initial Data Exploration
      1. Statistical Modelling and Forecast
        1. Industry Insights and Validation
      2. Data Sources
    6. Chapter 2.
    7. Executive Summary
    8. Nutritional bars Industry Market Synopsis, 2023–2030
      1. Business Trends
        1. Product Type Trends
        2. Product Flavor Trends
        3. Product Distribution channel Trends
    9. Chapter 3
    10. Nutritional bars market Industry Insights
      1. Industry Segmentation
      2. Industry Size and Forecast
      3. Industry Ecosystem Analysis
      4. Industry Impact forces
        1. Growth Drivers
    11. of portable convenience nutritional
      1. Increasing health conscious population
        1. Industry Pitfalls
    12. & Challenges
    13. Large number of product substitutes available
      1. High sugar content in the product
      2. Growth Potential
    14. Analysis
    15. Company Market Share Analysis, 2022
      1. Porter’s analysis
      2. PESTEL analysis
    16. Chapter 4 Nutritional bars market
    17. by Type Insights
    18. Global Nutritional bars Market Volume Share by Type, 2023–2030
      1. Protein bars
        1. Market Estimates
    19. & Forecast, 2023–2030
      1. Meal-replacement bars
        1. Market Estimates & Forecast, 2023–2030
        2. Snacks bars
    20. & Forecast, 2023–2030
      1. Whole food bars
        1. Market Estimates & Forecast, 2023–2030
        2. Others
    21. & Forecast, 2023–2030
    22. Chapter 5 Nutritional bars market by Flavor Insights
      1. Global Nutritional
    23. bars Market Volume Share by Flavor, 2023–2030
      1. Chocolate
        1. Market Estimates & Forecast, 2023–2030
        2. Fruits
    24. & Forecast, 2023–2030
      1. Peanut butter
        1. Market Estimates & Forecast, 2023–2030
        2. Savoury
    25. & Forecast, 2023–2030
      1. Spices
        1. Market Estimates & Forecast, 2023–2030
        2. Others
    26. & Forecast, 2023–2030
    27. Chapter 6 Nutritional bars market by Distribution
    28. channel Insights
    29. Global Nutritional bars Market Volume Share by Distribution channel, 2023–2030
      1. Store-Based
        1. Market Estimates
    30. & Forecast, 2023–2030
      1. Market Estimates & Forecast by Region, 2023–2030
        1. Non-Store Based
    31. & Forecast, 2023–2030
      1. Market Estimates & Forecast by Region, 2023–2030
    32. Chapter 7
    33. Nutritional bars market Regional Insights
      1. Nutritional bars Market Volume Share by Region,
    34. North America
    35. A Market Estimates & Forecast, 2023–2030
      1. B Market Estimates & Forecast, by Type,
    36. C Market Estimates & Forecast, by Flavor, 2023–2030
      1. D Market Estimates &
    37. Forecast, by Distribution channel, 2023–2030
      1. U.S.
        1. Market Estimates & Forecast, 2023–2030
    38. & Forecast, by Type, 2023–2030
      1. Market Estimates & Forecast, by Flavor, 2023–2030
        1. Market Estimates
    39. & Forecast, by Distribution channel, 2023–2030
      1. Canada
        1. Market Estimates &
    40. Forecast, 2023–2030
      1. Market Estimates & Forecast, by Type, 2023–2030
        1. Market Estimates
    41. & Forecast, by Flavor, 2023–2030
      1. Market Estimates & Forecast, by Distribution
    42. channel, 2023–2030
      1. Mexico
        1. Market Estimates & Forecast, 2023–2030
    43. & Forecast, by Type, 2023–2030
      1. Market Estimates & Forecast, by Flavor, 2023–2030
        1. Market Estimates
    44. & Forecast, by Distribution channel, 2023–2030
      1. Europe
      2. A Market Estimates &
    45. Forecast, 2023–2030
      1. B Market Estimates & Forecast, by Type, 2023–2030
      2. C Market Estimates
    46. & Forecast, by Flavor, 2023–2030
      1. D Market Estimates & Forecast, by Distribution
    47. channel, 2023–2030
      1. Germany
        1. Market Estimates & Forecast, 2023–2030
    48. & Forecast, by Type, 2023–2030
      1. Market Estimates & Forecast, by Flavor, 2023–2030
        1. Market Estimates
    49. & Forecast, by Distribution channel, 2023–2030
      1. U.K
        1. Market Estimates & Forecast, 2023–2030
    50. & Forecast, by Type, 2023–2030
      1. Market Estimates & Forecast, by Flavor, 2023–2030
        1. Market Estimates
    51. & Forecast, by Distribution channel, 2023–2030
      1. France
        1. Market Estimates &
    52. Forecast, 2023–2030
      1. Market Estimates & Forecast, by Type, 2023–2030
        1. Market Estimates
    53. & Forecast, by Flavor, 2023–2030
      1. Market Estimates & Forecast, by Distribution
    54. channel, 2023–2030
      1. Italy
        1. Market Estimates & Forecast, 2023–2030
    55. & Forecast, by Type, 2023–2030
      1. Market Estimates & Forecast, by Flavor, 2023–2030
        1. Market Estimates
    56. & Forecast, by Distribution channel, 2023–2030
      1. Asia Pacific
      2. A Market Estimates &
    57. Forecast, 2023–2030
      1. B Market Estimates & Forecast, by Type, 2023–2030
      2. C Market Estimates
    58. & Forecast, by Flavor, 2023–2030
      1. D Market Estimates & Forecast, by Distribution
    59. channel, 2023–2030
      1. China
        1. Market Estimates & Forecast, 2023–2030
    60. & Forecast, by Type, 2023–2030
      1. Market Estimates & Forecast, by Flavor, 2023–2030
        1. Market Estimates
    61. & Forecast, by Distribution channel, 2023–2030
      1. India
        1. Market Estimates &
    62. Forecast, 2023–2030
      1. Market Estimates & Forecast, by Type, 2023–2030
        1. Market Estimates
    63. & Forecast, by Flavor, 2023–2030
      1. Market Estimates & Forecast, by Distribution
    64. channel, 2023–2030
      1. Japan
        1. Market Estimates & Forecast, 2023–2030
    65. & Forecast, by Type, 2023–2030
      1. Market Estimates & Forecast, by Flavor, 2023–2030
        1. Market Estimates
    66. & Forecast, by Distribution channel, 2023–2030
      1. RoW
      2. A Market Estimates & Forecast, 2023–2030
      3. B Market Estimates
    67. & Forecast, by Type, 2023–2030
      1. C Market Estimates & Forecast, by Flavor, 2023–2030
      2. D Market Estimates
    68. & Forecast, by Distribution channel, 2023–2030
    69. Chapter 8 Competitor Profile
      1. Atkins Nutritionals,
    70. Inc. (U.S.)
    71. Business Overview
    72. Financial Data
    73. Product Landscape
    74. Key Developments
    75. Business Strategy
    76. SWOT Analysis
    77. Clif Bar & Company. (U.S.)
      1. Business Overview
        1. Financial Data
        2. Product Landscape
        3. Key Developments
        4. Business Strategy
        5. SWOT Analysis
      2. General Mills Inc. (U.S.)
        1. Business Overview
        2. Financial Data
        3. Product Landscape
        4. Key Developments
        5. Business Strategy
        6. SWOT Analysis
      3. Kellogg Co. (U.S.)
        1. Business Overview
        2. Financial Data
        3. Product Landscape
        4. Key Developments
        5. Business Strategy
        6. SWOT Analysis
      4. Kashi Company (U.S.)
        1. Business Overview
        2. Financial Data
        3. Product Landscape
        4. Key Developments
        5. Business Strategy
        6. SWOT Analysis
      5. Quaker Oats Company (U.S.)
        1. Business Overview
        2. Financial Data
        3. Product Landscape
        4. Key Developments
        5. Business Strategy
        6. SWOT Analysis
      6. Mars Incorporated
    78. (U.S.)
    79. Business Overview
    80. Financial Data
    81. Product Landscape
    82. Key Developments
    83. Business Strategy
    84. SWOT Analysis
    85. Data
    86. PESTLE ANALYSIS – U.S.
    87. GERMANY
    88. KEY SUPPLIERS OF NUTRITIONAL BARS MARKET
    89. BY TYPE, (2023–2030), USD MILLION
    90. (2023–2030), USD MILLION
    91. CHANNEL, (2023–2030), USD MILLION
    92. RATE (2023–2030) USD MILLION
    93. COUNTRIES
    94. GLOBAL MARKET FOR NUTRITIONAL BARS MARKET TOP COMPANIES-USD MILLION
    95. GLOBAL MARKET FOR NUTRITIONAL BARS MARKET, BY TYPE, (2023–2030) USD MILLION
    96. MARKET FOR NUTRITIONAL BARS MARKET, BY FLAVOR, (2023–2030), USD MILLION
    97. MARKET FOR NUTRITIONAL BARS MARKET, BY DISTRIBUTION CHANNEL, (2023–2030),
    98. USD MILLION
    99. EUROPEAN GLOBAL MARKET FOR NUTRITIONAL BARS MARKET, BY TYPE, (2023–2030)
    100. USD MILLION
    101. EUROPEAN MARKET FOR NUTRITIONAL BARS MARKET, BY FLAVOR, (2023–2030), USD
    102. MILLION
    103. EUROPEAN MARKET FOR NUTRITIONAL BARS MARKET, BY DISTRIBUTION CHANNEL, (2023–2030),
    104. USD MILLION
    105. APAC GLOBAL MARKET FOR NUTRITIONAL BARS MARKET, BY TYPE, (2023–2030) USD
    106. MILLION
    107. APAC MARKET FOR NUTRITIONAL BARS MARKET, BY FLAVOR, (2023–2030), USD MILLION
    108. FOR NUTRITIONAL BARS MARKET, BY DISTRIBUTION CHANNEL, (2023–2030), USD MILLION
    109. WORLD MARKET FOR NUTRITIONAL BARS MARKET, BY TYPE, (2023–2030) USD MILLION
    110. WORLD MARKET FOR NUTRITIONAL BARS MARKET, BY FLAVOR, (2023–2030), USD MILLION
    111. WORLD MARKET FOR NUTRITIONAL BARS MARKET, BY DISTRIBUTION CHANNEL, (2023–2030),
    112. USD MILLION
    113. COMPETITIVE LANDSCAPING BASED ON FINACIALS DURING THE YEAR 2022 
    114. Charts & Figures
    115. ANALYSIS APPROACH
    116. SECONDARY DATA ANALYSIS APPROACH
    117. IN NUTRITIONAL BARS MARKET IMPORTS 2022
    118. TOP 5 IMPORTERS (2022)
    119. TRENDS IN NUTRITIONAL BARS MARKET EXPORTS 2022
    120. NUTRITIONAL BARS MARKET EXPORTS MARKET SHARE BY TOP 5 EXPORTERS (2022)
    121. ANALYSIS
    122. COST ANALYSIS: NUTRITIONAL BARS MARKET
    123. FOR NUTRITIONAL BARS MARKET TRENDS BY TYPE
    124. TRENDS BY FLAVOR
    125. GLOBAL MARKET FOR NUTRITIONAL BARS MARKET TRENDS BY DISTRIBUTION CHANNEL

    Nutritional Bar Market Segmentation

    Nutritional Bar Type Outlook (USD Billion, 2019-2030)

    • Protein Bars
    • Snack Bars
    • Whole Foods Car
    • Meal Replacement Card
    • Others

    Nutritional Bar Flavours Outlook (USD Billion, 2019-2030)

    • Chocolate
    • Peanut Butter
    • Fruits
    • Spices
    • Others

    Nutritional Bar Distribution Channel Outlook (USD Billion, 2019-2030)

    • Store-Based
    • Non-Store-Based

    Nutritional Bar Regional Outlook (USD Billion, 2019-2030)

    • North America Outlook (USD Billion, 2019-2030)

      • North America Nutritional Bar by Type
        • Protein Bars
        • Snack Bars
        • Whole Foods Car
        • Meal Replacement Card
        • Others
      • North America Nutritional Bar by Flavours
        • Chocolate
        • Peanut Butter
        • Fruits
        • Spices
        • Others
      • North America Nutritional Bar by Distribution Channel
        • Store-Based
        • Non-Store-Based
      • US Outlook (USD Billion, 2019-2030)

      • US Nutritional Bar by Type
        • Protein Bars
        • Snack Bars
        • Whole Foods Car
        • Meal Replacement Card
        • Others
      • US Nutritional Bar by Flavours
        • Chocolate
        • Peanut Butter
        • Fruits
        • Spices
        • Others
      • US Nutritional Bar by Distribution Channel
        • Store-Based
        • Non-Store-Based
      • CANADA Outlook (USD Billion, 2019-2030)

      • Canada Nutritional Bar by Type
        • Protein Bars
        • Snack Bars
        • Whole Foods Car
        • Meal Replacement Card
        • Others
      • Canada Nutritional Bar by Flavours
        • Chocolate
        • Peanut Butter
        • Fruits
        • Spices
        • Others
      • Canada Nutritional Bar by Distribution Channel
        • Store-Based
        • Non-Store-Based
    • Europe Outlook (USD Billion, 2019-2030)

      • Europe Nutritional Bar by Type
        • Protein Bars
        • Snack Bars
        • Whole Foods Car
        • Meal Replacement Card
        • Others
      • Europe Nutritional Bar by Flavours
        • Chocolate
        • Peanut Butter
        • Fruits
        • Spices
        • Others
      • Europe Nutritional Bar by Distribution Channel
        • Store-Based
        • Non-Store-Based
      • Germany Outlook (USD Billion, 2019-2030)

      • Germany Nutritional Bar by Type
        • Protein Bars
        • Snack Bars
        • Whole Foods Car
        • Meal Replacement Card
        • Others
      • Germany Nutritional Bar by Flavours
        • Chocolate
        • Peanut Butter
        • Fruits
        • Spices
        • Others
      • Germany Nutritional Bar by Distribution Channel
        • Store-Based
        • Non-Store-Based
      • France Outlook (USD Billion, 2019-2030)

      • France Nutritional Bar by Type
        • Protein Bars
        • Snack Bars
        • Whole Foods Car
        • Meal Replacement Card
        • Others
      • France Nutritional Bar by Flavours
        • Chocolate
        • Peanut Butter
        • Fruits
        • Spices
        • Others
      • France Nutritional Bar by Distribution Channel
        • Store-Based
        • Non-Store-Based
      • UK Outlook (USD Billion, 2019-2030)

      • UK Nutritional Bar by Type
        • Protein Bars
        • Snack Bars
        • Whole Foods Car
        • Meal Replacement Card
        • Others
      • UK Nutritional Bar by Flavours
        • Chocolate
        • Peanut Butter
        • Fruits
        • Spices
        • Others
      • UK Nutritional Bar by Distribution Channel
        • Store-Based
        • Non-Store-Based
      • ITALY Outlook (USD Billion, 2019-2030)

      • Italy Nutritional Bar by Type
        • Protein Bars
        • Snack Bars
        • Whole Foods Car
        • Meal Replacement Card
        • Others
      • Italy Nutritional Bar by Flavours
        • Chocolate
        • Peanut Butter
        • Fruits
        • Spices
        • Others
      • Italy Nutritional Bar by Distribution Channel
        • Store-Based
        • Non-Store-Based
      • SPAIN Outlook (USD Billion, 2019-2030)

      • Spain Nutritional Bar by Type
        • Protein Bars
        • Snack Bars
        • Whole Foods Car
        • Meal Replacement Card
        • Others
      • Spain Nutritional Bar by Flavours
        • Chocolate
        • Peanut Butter
        • Fruits
        • Spices
        • Others
      • Spain Nutritional Bar by Distribution Channel
        • Store-Based
        • Non-Store-Based
      • Rest Of Europe Outlook (USD Billion, 2019-2030)

      • Rest of Europe Nutritional Bar by Type
        • Protein Bars
        • Snack Bars
        • Whole Foods Car
        • Meal Replacement Card
        • Others
      • Rest of Europe Nutritional Bar by Flavours
        • Chocolate
        • Peanut Butter
        • Fruits
        • Spices
        • Others
      • Rest of Europe Nutritional Bar by Distribution Channel
        • Store-Based
        • Non-Store-Based
    • Asia-Pacific Outlook (USD Billion, 2019-2030)

      • Asia-Pacific Nutritional Bar by Type
        • Protein Bars
        • Snack Bars
        • Whole Foods Car
        • Meal Replacement Card
        • Others
      • Asia-Pacific Nutritional Bar by Flavours
        • Chocolate
        • Peanut Butter
        • Fruits
        • Spices
        • Others
      • Asia-Pacific Nutritional Bar by Distribution Channel
        • Store-Based
        • Non-Store-Based
      • China Outlook (USD Billion, 2019-2030)

      • China Nutritional Bar by Type
        • Protein Bars
        • Snack Bars
        • Whole Foods Car
        • Meal Replacement Card
        • Others
      • China Nutritional Bar by Flavours
        • Chocolate
        • Peanut Butter
        • Fruits
        • Spices
        • Others
      • China Nutritional Bar by Distribution Channel
        • Store-Based
        • Non-Store-Based
      • Japan Outlook (USD Billion, 2019-2030)

      • Japan Nutritional Bar by Type
        • Protein Bars
        • Snack Bars
        • Whole Foods Car
        • Meal Replacement Card
        • Others
      • Japan Nutritional Bar by Flavours
        • Chocolate
        • Peanut Butter
        • Fruits
        • Spices
        • Others
      • Japan Nutritional Bar by Distribution Channel
        • Store-Based
        • Non-Store-Based
      • India Outlook (USD Billion, 2019-2030)

      • India Nutritional Bar by Type
        • Protein Bars
        • Snack Bars
        • Whole Foods Car
        • Meal Replacement Card
        • Others
      • India Nutritional Bar by Flavours
        • Chocolate
        • Peanut Butter
        • Fruits
        • Spices
        • Others
      • India Nutritional Bar by Distribution Channel
        • Store-Based
        • Non-Store-Based
      • Australia Outlook (USD Billion, 2019-2030)

      • Australia Nutritional Bar by Type
        • Protein Bars
        • Snack Bars
        • Whole Foods Car
        • Meal Replacement Card
        • Others
      • Australia Nutritional Bar by Flavours
        • Chocolate
        • Peanut Butter
        • Fruits
        • Spices
        • Others
      • Australia Nutritional Bar by Distribution Channel
        • Store-Based
        • Non-Store-Based
      • Rest of Asia-Pacific Outlook (USD Billion, 2019-2030)

      • Rest of Asia-Pacific Nutritional Bar by Type
        • Protein Bars
        • Snack Bars
        • Whole Foods Car
        • Meal Replacement Card
        • Others
      • Rest of Asia-Pacific Nutritional Bar by Flavours
        • Chocolate
        • Peanut Butter
        • Fruits
        • Spices
        • Others
      • Rest of Asia-Pacific Nutritional Bar by Distribution Channel
        • Store-Based
        • Non-Store-Based
    • Rest of the World Outlook (USD Billion, 2019-2030)

      • Rest of the World Nutritional Bar by Type
        • Protein Bars
        • Snack Bars
        • Whole Foods Car
        • Meal Replacement Card
        • Others
      • Rest of the World Nutritional Bar by Flavours
        • Chocolate
        • Peanut Butter
        • Fruits
        • Spices
        • Others
      • Rest of the World Nutritional Bar by Distribution Channel
        • Store-Based
        • Non-Store-Based
      • Middle East Outlook (USD Billion, 2019-2030)

      • Middle East Nutritional Bar by Type
        • Protein Bars
        • Snack Bars
        • Whole Foods Car
        • Meal Replacement Card
        • Others
      • Middle East Nutritional Bar by Flavours
        • Chocolate
        • Peanut Butter
        • Fruits
        • Spices
        • Others
      • Middle East Nutritional Bar by Distribution Channel
        • Store-Based
        • Non-Store-Based
      • Africa Outlook (USD Billion, 2019-2030)

      • Africa Nutritional Bar by Type
        • Protein Bars
        • Snack Bars
        • Whole Foods Car
        • Meal Replacement Card
        • Others
      • Africa Nutritional Bar by Flavours
        • Chocolate
        • Peanut Butter
        • Fruits
        • Spices
        • Others
      • Africa Nutritional Bar by Distribution Channel
        • Store-Based
        • Non-Store-Based
      • Latin America Outlook (USD Billion, 2019-2030)

      • Latin America Nutritional Bar by Type
        • Protein Bars
        • Snack Bars
        • Whole Foods Car
        • Meal Replacement Card
        • Others
      • Latin America Nutritional Bar by Flavours
        • Chocolate
        • Peanut Butter
        • Fruits
        • Spices
        • Others
      • Latin America Nutritional Bar by Distribution Channel
        • Store-Based
        • Non-Store-Based
    Nutritional Bar Market Research Report - Forecast till 2030 Infographic
    Free Sample Request

    Kindly complete the form below to receive a free sample of this Report

    Customer Strories

    “I am very pleased with how market segments have been defined in a relevant way for my purposes (such as "Portable Freezers & refrigerators" and "last-mile"). In general the report is well structured. Thanks very much for your efforts.”

    Victoria Milne Founder
    Case Study

    Chemicals and Materials