• Cat-intel
  • MedIntelliX
  • Resources
  • About Us
  • Request Free Sample ×

    Kindly complete the form below to receive a free sample of this Report

    Leading companies partner with us for data-driven Insights

    clients tt-cursor

    Methane Market

    ID: MRFR/CnM/5904-HCR
    140 Pages
    Priya Nagrale
    September 2025

    Methane Market Research Report Information By Source (Natural and Synthetic), By Application (Fuel, Natural Gas, Liquefied Natural Gas, Liquid-Methane Rocket Fuel, and Chemical Feedstock), By End Use Industry (Automotive and Aerospace & Defense), and By Region (North America, Europe, Asia-Pacific, and Rest Of The World) – Market Forecast Till 2032

    Share:
    Download PDF ×

    We do not share your information with anyone. However, we may send you emails based on your report interest from time to time. You may contact us at any time to opt-out.

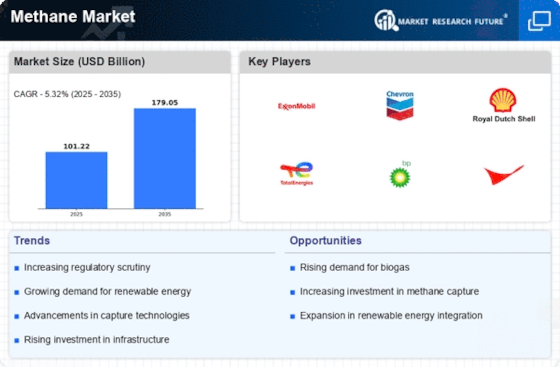
    Methane Market Research Report – Global Forecast till 2032 Infographic
    Purchase Options
    $ 4,950.0
    $ 5,950.0
    $ 7,250.0
    Table of Contents

    Methane Market Summary

    As per Market Research Future Analysis, the Global Methane Market was valued at USD 95.4 Billion in 2023 and is projected to grow to USD 153.2 Billion by 2032, with a CAGR of 5.32% from 2024 to 2032. The market is driven by the increasing demand for high purity methane in the electronics industry, particularly for graphene production used in semiconductors and electronic components. The automotive sector is also a significant contributor to market growth, alongside advancements in methane reforming technologies.

    Key Market Trends & Highlights

    The methane market is experiencing notable trends driven by technological advancements and increasing demand across various sectors.

    • Methane market size in 2023: USD 95.4 Billion.
    • Projected market size by 2032: USD 153.2 Billion.
    • CAGR from 2024 to 2032: 5.32%.
    • North America held 45.80% market share in 2022.

    Market Size & Forecast

    2023 Market Size USD 95.4 Billion
    2024 Market Size USD 101.22 Billion
    2032 Market Size USD 153.2 Billion
    CAGR (2024-2032) 5.32%

    Major Players

    Key players include Oil and Natural Gas Corporation, Royal Dutch Shell PLC, Senex Energy Limited, G3 Exploration, Black Diamond Energy Inc., Halliburton Co., IGas Energy, China National Offshore Oil Company, and BP PLC.

    Methane Market Trends

      • Increasing demand from electronics industry is driving the market growth

    Electronic parts including silicon wafers, integrated circuits (IC), semiconductors, and solar cell devices all utilize high purity gases. High purity methane gas is one of the primary raw materials used to create graphene, which has remarkable properties such as little optical absorption, high charge mobility, flexibility, high electrical conductivity, and bendability. Carbon atoms are arranged in a honeycomb arrangement to form graphene, which is one carbon atom thick. These qualities make graphene suitable for a variety of applications, including as solar cells and transistors. One of graphene's most intriguing possible applications is as a transparent conducting electrode.

    The transparent conductive electrode must have good optical transparency and electrical conductivity. Indium-tin-oxide (ITO) is often used as transparent conductive electrodes due to its great optical transparency and high conductivity.

    Additionally, the production of microchips and transistors, two components that are crucial to almost all electrical devices, uses graphene. Many companies are already working on the creation of conductive ink, a type of ink that conducts electricity and is used to print graphene circuits. Chemical vapour deposition (CVD) is the most promising technology for producing graphene for large-scale electronic device applications because to its lower cost and improved efficiency.

    The market for high purity methane gas is therefore being driven by the increasing use of graphene for semiconductors and electronic components, as well as the capacity of installed semiconductors, integrated circuits used in various electronic equipment, and the development of new technologies.

    The market for high-purity methane gas is expanding as a result of rising demand for electronic goods. Components that govern the flow of electrical currents into processing systems are known as electronic products. These devices have an electrical circuit that, while in use, has the ability to produce or emit a physical radiation field. Due to the development of new technologies, such as software, app development, robots, and artificial intelligence, consumer electronics have grown and intersected with many industries and sectors, fueling consumer electronics growth.

    The requirement for high-purity methane gas to generate materials for cells and other electrical devices has expanded as a result of the growth in demand for consumer electronics products. For instance, gfu Consumer and Home Electronics GmbH, a consumer electronics company with headquarters in Therefore, the market for high-purity methane will be driven by the rising demand for electronics goods. Thus, driving the Methane market revenue.

    In 2024 Haldor Topsoe released new technology for efficient methane reforming and hydrogen production.

    In 2023 Linde introduced advanced methane conversion solutions for improved energy efficiency and sustainability.

    The global methane market is poised for transformation as nations increasingly prioritize emissions reduction strategies, reflecting a growing recognition of methane's role in climate change mitigation.

    U.S. Environmental Protection Agency

    Methane Market Drivers

    Market Growth Projections

    The Global Methane Market Industry is poised for substantial growth, with projections indicating a market value of 101.2 USD Billion in 2024 and an anticipated increase to 179.0 USD Billion by 2035. This growth trajectory suggests a compound annual growth rate (CAGR) of 5.32% from 2025 to 2035, reflecting the increasing recognition of methane as a viable energy source. The market dynamics are influenced by various factors, including technological advancements, regulatory frameworks, and the growing demand for clean energy solutions. These projections underscore the potential for methane to play a significant role in the global energy transition.

    Growing Awareness of Climate Change

    The increasing awareness of climate change and its impacts is driving the Global Methane Market Industry towards more sustainable practices. As stakeholders, including consumers and businesses, become more informed about the environmental consequences of methane emissions, there is a growing demand for solutions that mitigate these effects. This awareness is prompting industries to invest in methane recovery and utilization technologies, aligning with global climate goals. The market is projected to experience a compound annual growth rate (CAGR) of 5.32% from 2025 to 2035, indicating a robust response to the urgent need for climate action and sustainable energy solutions.

    Government Regulations and Incentives

    Government regulations and incentives are significantly influencing the Global Methane Market Industry, as policymakers worldwide recognize the importance of reducing methane emissions. Regulatory frameworks aimed at curbing emissions from various sectors, including agriculture and waste management, are being established. These regulations often come with financial incentives for companies that invest in methane recovery technologies. As a result, the market is expected to grow, with projections indicating a rise to 179.0 USD Billion by 2035. This regulatory environment fosters innovation and encourages industries to adopt cleaner practices, thereby enhancing the overall sustainability of methane utilization.

    Expansion of Natural Gas Infrastructure

    The expansion of natural gas infrastructure is a crucial driver for the Global Methane Market Industry, as it facilitates the increased utilization of methane as a clean energy source. Investments in pipelines, storage facilities, and distribution networks are enabling the efficient transport of natural gas, which is primarily composed of methane. This infrastructure development not only supports energy security but also promotes the transition to cleaner energy sources. As the global energy landscape evolves, the demand for natural gas is expected to rise, further bolstering the methane market and contributing to its projected growth in the coming years.

    Rising Demand for Clean Energy Solutions

    The Global Methane Market Industry is experiencing a surge in demand for clean energy solutions, driven by the global shift towards sustainable practices. Methane, as a potent energy source, is being increasingly recognized for its potential to reduce greenhouse gas emissions when captured and utilized effectively. In 2024, the market is projected to reach 101.2 USD Billion, reflecting the growing investments in technologies that harness methane from sources such as landfills and agricultural waste. Governments worldwide are implementing policies to promote methane recovery, further propelling market growth as industries seek to align with environmental regulations and consumer preferences for cleaner energy.

    Technological Advancements in Methane Capture

    Technological advancements play a pivotal role in the Global Methane Market Industry, enhancing the efficiency and effectiveness of methane capture and utilization processes. Innovations in extraction techniques, such as advanced biogas systems and improved leak detection technologies, are enabling industries to minimize methane emissions while maximizing energy recovery. These developments not only contribute to environmental sustainability but also offer economic benefits by reducing operational costs. As the market evolves, the integration of smart technologies and data analytics is likely to optimize methane management, potentially leading to a more robust market landscape as stakeholders increasingly adopt these solutions.

    Market Segment Insights

    Methane Source Insights

    The Methane market segmentation, based on source, includes natural and synthetic. In 2022, the natural category led the market, and this trend is anticipated throughout the forecast period. This is explained by methane's widespread availability in the environment.

    Methane Application Insights

    The Methane market segmentation, based on application, includes fuel, natural gas, liquefied natural gas, liquid-methane rocket fuel, and chemical feedstock. In 2022, the worldwide liquid-methane rocket fuel market was dominated by the fuel category. This can be linked to the rising demand for gasoline across many industries worldwide.

    Methane End Use Industry Insights

    The Methane market segmentation, based on End Use Industry, includes automotive and aerospace & defense. Due to the growing use of methane in the automotive industry, the automotive segment led the methane market in 2022.

    Figure 1:  Methane Market, by End Use Industry, 2023 & 2032 (USD Billion)

    Source: Secondary Research, Primary Research, Market Research Future Database and Analyst Review

    Get more detailed insights about Methane Market Research Report – Global Forecast till 2032

    Regional Insights

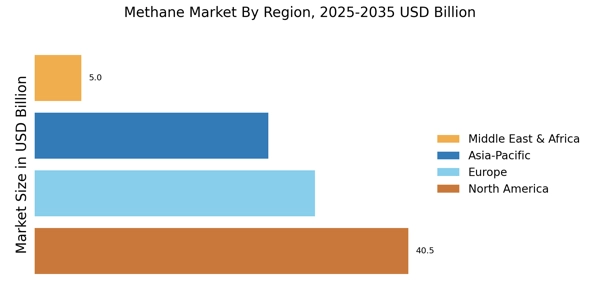
    By region, the study provides the market insights into North America, Europe, Asia-Pacific and Rest of the World. The North America Methane Market dominated this market in 2022 (45.80%). This region has grown as a result of a number of causes, including a high rate of industrialisation, rising consumer spending, the presence of major businesses, and technical breakthroughs. The market for high purity methane gas is expanding in the area as a result of rising automotive penetration, rising vehicle modernization, and attempts to encourage the use of electric vehicles.

    The growth in this region is also fueled by expanding applications in the electrical and electronics industries. Further, the U.S. Methane market held the largest market share, and the Canada Methane market was the fastest growing market in the North America region.

    Further, the major countries studied in the market report are The US, Canada, German, France, the UK, Italy, Spain, China, Japan, India, Australia, South Korea, and Brazil.

    Figure 2:  METHANE MARKET SHARE BY REGION 2023 (USD Billion)

    METHANE MARKET SHARE BY REGION 2022

    Source: Secondary Research, Primary Research, Market Research Future Database and Analyst Review

    Europe Methane market is expected to register significant growth from 2023 to 2032. The chemical sector and the thriving and expanding car industry belong to this. By using methane gas, many significant players are also manufacturing liquefied natural gas. Further, the German Methane market held the largest market share, and the U.K Methane market was the fastest growing market in the European region

    The Asia Pacific Methane market, accounted for the healthy market share in 2022. The market for methane in emerging nations is quite promising. The demand for methane, which is utilized as a chemical feedstock in businesses, has expanded as a result of urbanization and industrialisation. Methane is used as a fuel in the expanding automotive sector. Moreover, China’s Methane market held the largest market share, and the Indian Methane market was the fastest growing market in the Asia-Pacific region.

    Key Players and Competitive Insights

    Leading market players are investing heavily in research and development in order to expand their product lines, which will help the Methane market, grow even more. Market participants are also undertaking a variety of strategic activities to expand their footprint, with important market developments including new product launches, contractual agreements, mergers and acquisitions, higher investments, and collaboration with other organizations. To expand and survive in a more competitive and rising market climate, Methane industry must offer cost-effective items.

    Manufacturing locally to minimize operational costs is one of the key business tactics used by manufacturers in the Methane industry to benefit clients and increase the market sector. In recent years, the Methane industry has offered some of the most significant advantages to medicine.

    Major players in the Methane market, including Oil and Natural Gas Corporation, Royal Dutch Shell PLC, Senex Energy Limited, G3 Exploration, Black Diamond Energy Inc., Halliburton Co., IGas Energy, China National Offshore Oil Company, China National Petroleum Corporation, Metgasco Ltd., BP PLC, TLOU Energy Ltd, Dart Energy Corporation, Bow Energy, and American Gas Products, are attempting to increase market demand by investing in research and development operations.

    Engineering and industrial gas provider Linde plc (Linde). Industrial, process, and speciality gases are provided by it. producing well producing industrial gases including carbon dioxide, helium, hydrogen, electronic gases, and acetylene, the company also produces atmospheric gases like oxygen, nitrogen, and argon. Additionally, Linde provides a variety of gas production and processing services in addition to designing, engineering, and constructing machinery that produces gases for internal use. Healthcare, petroleum refining, manufacturing, food, beverage carbonation, fiber-optics, steel production, aerospace, chemicals and energy, electronics, and water treatment are just a few of the industries it supports.

    In APAC, EMEA, and the Americas, it runs cryogenic air separation plants, hydrogen plants, and carbon dioxide plants. In Guildford, Surrey, United Kingdom, Linde is headquartered.

    The industrial and healthcare industries are served by Air Liquide SA (Air Liquide), a provider of gases, technologies, and services. Along with argon and other rare gases, the company also produces gases such as oxygen, nitrogen, and hydrogen. Customers in a variety of industries, including steel, food and pharmaceuticals, chemicals, electronics, automotive, and manufacturing, are served by this company's supply of these gases. The business also creates processing facilities and associated infrastructure. Skin disinfectants, antiseptics, and medical device disinfection products are offered by Air Liquide. The business distributes its goods via local facilities, tanker trucks, and cylinders.

    It operates in the Americas, Europe, Africa, the Middle East, and Asia-Pacific. The headquarters of Air Liquide are located in Paris, Ile-de-France, France.

    Key Companies in the Methane Market market include

    Industry Developments

    December 2021: In order to research methods to reduce methane emissions in the oil, coal, and gas industries, the U.S. Department of Energy (DOE) announced a USD35 million investment in twelve projects. In an effort to reduce methane emissions in the United States, the Advanced Research Projects Agency-Energy (ARPA-E) of the DOE announced the Reducing Emissions of Methane Every Day of the Year (REMEDY) program earlier this year.

    November 2021: For its initial data submission to the UN-sponsored Oil and Gas Methane Partnership 2.0 (OGMP 2.0), Jonah Energy LLC was awarded the Gold Standard.

    Future Outlook

    Methane Market Future Outlook

    The Global Methane Market is projected to grow at a 5.32% CAGR from 2024 to 2035, driven by regulatory pressures, technological advancements, and increasing demand for cleaner energy solutions.

    New opportunities lie in:

    • Invest in methane capture technologies to enhance efficiency and reduce emissions.
    • Develop partnerships with agricultural sectors to optimize methane utilization from livestock waste.
    • Explore innovative biogas solutions for urban waste management and energy generation.

    By 2035, the Global Methane Market is expected to be robust, reflecting substantial growth and innovation.

    Market Segmentation

    Methane: Source Outlook

    • Natural
    • Synthetic

    Methane Regional Outlook

    North America
    • US
    • Canada

    Methane Application Outlook

    • Fuel
    • Natural Gas
    • Liquefied Natural Gas
    • Liquid-Methane Rocket Fuel
    • Chemical Feedstock

    Methane End Use Industry Outlook

    • Automotive
    • Aerospace & Defense

    Report Scope

    Report Attribute/Metric Details
    Market Size 2023 USD 95.4 Billion
    Market Size 2024 USD 101.22 Billion
    Market Size 2032 USD 153.2 Billion
    Compound Annual Growth Rate (CAGR) 5.32% (2024-2032)
    Base Year 2023
    Market Forecast Period 2024-2032
    Historical Data 2018- 2022
    Market Forecast Units Value (USD Billion)
    Report Coverage Revenue Forecast, Market Competitive Landscape, Growth Factors, and Trends
    Segments Covered Source, Application, End Use Industry, and Region
    Geographies Covered North America, Europe, Asia Pacific, and the Rest of the World
    Countries Covered The US, Canada, German, France, UK, Italy, Spain, China, Japan, India, Australia, South Korea, and Brazil
    Key Companies Profiled Oil and Natural Gas Corporation, Royal Dutch Shell PLC, Senex Energy Limited, G3 Exploration, Black Diamond Energy Inc., Halliburton Co., IGas Energy, China National Offshore Oil Company, China National Petroleum Corporation, Metgasco Ltd., BP PLC, TLOU Energy Ltd, Dart Energy Corporation, Bow Energy, and American Gas Products
    Key Market Opportunities Development of new technologies
    Key Market Dynamics The growing usage of graphene in electronic components and semiconductors, the increasing capacity of installed semiconductors, and integrated circuits employed in various electronic equipment

    Market Highlights

    Author
    Priya Nagrale
    Senior Research Analyst

    With an experience of over five years in market research industry (Chemicals & Materials domain), I gather and analyze market data from diverse sources to produce results, which are then presented back to a client. Also, provide recommendations based on the findings. As a Senior Research Analyst, I perform quality checks (QC) for market estimations, QC for reports, and handle queries and work extensively on client customizations. Also, handle the responsibilities of client proposals, report planning, report finalization, and execution

    Leave a Comment

    FAQs

    How much is the Methane market?

    The Methane market size was valued at USD 95.4 Billion in 2023.

    What is the growth rate of the Methane market?

    The Methane market is projected to grow at a CAGR of 5.32% during the forecast period, 2024-2032.

    Which region held the largest market share in the Methane market?

    North America had the largest share in the Methane market

    Who are the key players in the Methane market?

    The key players in the Methane market are Oil and Natural Gas Corporation, Royal Dutch Shell PLC, Senex Energy Limited, G3 Exploration, Black Diamond Energy Inc., Halliburton Co., IGas Energy, China National Offshore Oil Company, China National Petroleum Corporation, Metgasco Ltd., BP PLC, TLOU Energy Ltd, Dart Energy Corporation, Bow Energy, and American Gas Products

    Which Source led the Methane market?

    The Natural Source dominated the Methane market in 2023.

    Which Application had the largest market share in the Methane market?

    The Fuel Application had the largest share in the Methane market.

    1. 'TABLE OF CONTENTS
    2. Executive Summary
    3. Scope of the Report
    4. Market Definition
      1. Scope of the Study
      2. List of Assumptions
    5. Markets Structure
    6. Market Research Methodology
      1. Research Process
      2. Primary Research
      3. Secondary Research
      4. Market Size Estimation
      5. Forecast Model
    7. Market Landscape
      1. Supply Chain Analysis
    8. Raw Source Suppliers
      1. Manufacturers/Producers
        1. Distributors/Retailers/Wholesalers/E-Commerce
        2. Source
      2. Porter’s Five Forces Model
        1. Threat of New
    9. Entrants
      1. Threat of Rivalry
        1. Threat of Substitutes
    10. Bargaining Power of Suppliers
      1. Bargaining Power of Buyers
    11. Industry
    12. Overview of Global Methane Market
      1. Introduction
      2. Drivers
    13. Restraints
      1. Opportunities
      2. Challenges
    14. Global Methane Market,
    15. by Source
      1. Introduction
      2. Natural
        1. Market Estimates &
    16. Forecast, 2023-2032
      1. Market Estimates & Forecast, by Region, 2023-2032
      2. Synthetic
        1. Market Estimates & Forecast, 2023-2032
    17. Market Estimates & Forecast, by Region, 2023-2032
    18. Global Methane Market,
    19. by Application
      1. Introduction
      2. Fuel
        1. Market Estimates &
    20. Forecast, 2023-2032
      1. Market Estimates & Forecast, by Region, 2023-2032
      2. Natural Gas
        1. Market Estimates & Forecast, 2023-2032
    21. Market Estimates & Forecast, by Region, 2023-2032
      1. Liquified Natural
    22. Gas
      1. Market Estimates & Forecast, 2023-2032
        1. Market Estimates
    23. & Forecast, by Region, 2023-2032
      1. Chemical Feedstock
        1. Market
    24. Estimates & Forecast, 2023-2032
      1. Market Estimates & Forecast,
    25. by Region, 2023-2032
      1. Others
        1. Market Estimates & Forecast,
        2. Market Estimates & Forecast, by Region, 2023-2032
    26. Global Methane Market, by End Use Industry
      1. Introduction
      2. Aerospace
    27. & Defense
      1. Market Estimates & Forecast, 2023-2032
        1. Market
    28. Estimates & Forecast, by Region, 2023-2032
      1. Automotive
        1. Market
    29. Estimates & Forecast, 2023-2032
      1. Market Estimates & Forecast,
    30. by Region, 2023-2032
      1. Chemical
        1. Market Estimates & Forecast,
        2. Market Estimates & Forecast, by Region, 2023-2032
    31. Electrical
      1. Market Estimates & Forecast, 2023-2032
        1. Market
    32. Estimates & Forecast, by Region, 2023-2032
      1. Others
        1. Market
    33. Estimates & Forecast, 2023-2032
      1. Market Estimates & Forecast,
    34. by Region, 2023-2032
    35. Global Methane Market, by Region
      1. Introduction
      2. North America
        1. Market Estimates & Forecast, 2023-2032
    36. Market Estimates & Forecast by Source, 2023-2032
      1. Market Estimates
    37. & Forecast by Application, 2023-2032
      1. Market Estimates & Forecast
    38. by End Use Industry, 2023-2032
      1. US
        1. Market Estimates &
    39. Forecast, 2023-2032
      1. Market Estimates & Forecast by Source 2023-2032
        1. Market Estimates & Forecast by Application, 2023-2032
    40. Market Estimates & Forecast by End Use Industry, 2023-2032
      1. Canada
        1. Market Estimates & Forecast, 2023-2032
    41. & Forecast by Source, 2023-2032
      1. Market Estimates & Forecast
    42. by Application, 2023-2032
      1. Market Estimates & Forecast by End Use
    43. Industry, 2023-2032
      1. Europe
        1. Market Estimates & Forecast,
        2. Market Estimates & Forecast by Source, 2023-2032
    44. Market Estimates & Forecast by Application, 2023-2032
      1. Market Estimates
    45. & Forecast by End Use Industry, 2023-2032
      1. Germany
        1. Market
    46. Estimates & Forecast, 2023-2032
      1. Market Estimates & Forecast
    47. by Source, 2023-2032
      1. Market Estimates & Forecast by Application,
        1. Market Estimates & Forecast by End Use Industry, 2023-2032
        2. France
    48. Market Estimates & Forecast by Source, 2023-2032
      1. Market Estimates
    49. & Forecast by Application, 2023-2032
      1. Market Estimates & Forecast
    50. by End Use Industry, 2023-2032
      1. Italy
        1. Market Estimates &
    51. Forecast, 2023-2032
      1. Market Estimates & Forecast by Source, 2023-2032
        1. Market Estimates & Forecast by Application, 2023-2032
    52. Market Estimates & Forecast by End Use Industry, 2023-2032
      1. Spain
        1. Market Estimates & Forecast, 2023-2032
    53. & Forecast by Source, 2023-2032
      1. Market Estimates & Forecast
    54. by Application, 2023-2032
      1. Market Estimates & Forecast by End Use
    55. Industry, 2023-2032
      1. UK
        1. Market Estimates & Forecast,
    56. Market Estimates & Forecast by Application, 2023-2032
      1. Market Estimates
    57. & Forecast by End Use Industry, 2023-2032
      1. Russia
        1. Market
    58. Estimates & Forecast, 2023-2032
      1. Market Estimates & Forecast
    59. by Source, 2023-2032
      1. Market Estimates & Forecast by Application,
        1. Market Estimates & Forecast by End Use Industry, 2023-2032
        2. Rest of Europe
    60. Estimates & Forecast by Application, 2023-2032
      1. Market Estimates
    61. & Forecast by End Use Industry, 2023-2032
      1. Asia Pacific
        1. Market
    62. Estimates & Forecast, 2023-2032
      1. Market Estimates & Forecast by
    63. Source, 2023-2032
      1. Market Estimates & Forecast by Application, 2023-2032
        1. Market Estimates & Forecast by End Use Industry, 2023-2032
    64. China
      1. Market Estimates & Forecast, 2023-2032
        1. Market
    65. Estimates & Forecast by Source, 2023-2032
      1. Market Estimates &
    66. Forecast by Application, 2023-2032
      1. Market Estimates & Forecast
    67. by End Use Industry, 2023-2032
      1. India
        1. Market Estimates &
    68. Forecast, 2023-2032
      1. Market Estimates & Forecast by Source, 2023-2032
        1. Market Estimates & Forecast by Application, 2023-2032
    69. Market Estimates & Forecast by End Use Industry, 2023-2032
      1. Japan
        1. Market Estimates & Forecast, 2023-2032
    70. & Forecast by Source, 2023-2032
      1. Market Estimates & Forecast
    71. by Application, 2023-2032
      1. Market Estimates & Forecast by End Use
    72. Industry, 2023-2032
      1. Australia
        1. Market Estimates & Forecast,
    73. Market Estimates & Forecast by Application, 2023-2032
      1. Market Estimates
    74. & Forecast by End Use Industry, 2023-2032
      1. New Zealand
    75. Market Estimates & Forecast, 2023-2032
      1. Market Estimates & Forecast
    76. by Source, 2023-2032
      1. Market Estimates & Forecast by Application,
        1. Market Estimates & Forecast by End Use Industry, 2023-2032
        2. Rest of Asia Pacific
    77. Estimates & Forecast by Application, 2023-2032
      1. Market Estimates
    78. & Forecast by End Use Industry, 2023-2032
      1. Middle East & Africa
        1. Market Estimates & Forecast, 2023-2032
        2. Market Estimates &
    79. Forecast by Source, 2023-2032
      1. Market Estimates & Forecast by Application,
        1. Market Estimates & Forecast by End Use Industry, 2023-2032
        2. Turkey
    80. Market Estimates & Forecast by Source, 2023-2032
      1. Market Estimates
    81. & Forecast by Application, 2023-2032
      1. Market Estimates & Forecast
    82. by End Use Industry, 2023-2032
      1. Israel
        1. Market Estimates &
    83. Forecast, 2023-2032
      1. Market Estimates & Forecast by Source, 2023-2032
        1. Market Estimates & Forecast by Application, 2023-2032
    84. Market Estimates & Forecast by End Use Industry, 2023-2032
      1. North
    85. Africa
      1. Market Estimates & Forecast, 2023-2032
        1. Market
    86. Estimates & Forecast by Source, 2023-2032
      1. Market Estimates &
    87. Forecast by Application, 2023-2032
      1. Market Estimates & Forecast
    88. by End Use Industry, 2023-2032
      1. GCC
        1. Market Estimates &
    89. Forecast, 2023-2032
      1. Market Estimates & Forecast by Source, 2023-2032
        1. Market Estimates & Forecast by Application, 2023-2032
    90. Market Estimates & Forecast by End Use Industry, 2023-2032
      1. Rest of
    91. the Middle East & Africa
      1. Market Estimates & Forecast, 2023-2032
        1. Market Estimates & Forecast by Source, 2023-2032
    92. Estimates & Forecast by Application, 2023-2032
      1. Market Estimates
    93. & Forecast by End Use Industry, 2023-2032
      1. Latin America
    94. Market Estimates & Forecast, 2023-2032
      1. Market Estimates & Forecast
    95. by Source, 2023-2032
      1. Market Estimates & Forecast by Application,
        1. Market Estimates & Forecast by End Use Industry, 2023-2032
        2. Brazil
    96. Market Estimates & Forecast by Source, 2023-2032
      1. Market Estimates
    97. & Forecast by Application, 2023-2032
      1. Market Estimates & Forecast
    98. by End Use Industry, 2023-2032
      1. Argentina
        1. Market Estimates
    99. & Forecast, 2023-2032
      1. Market Estimates & Forecast by Source,
        1. Market Estimates & Forecast by Application, 2023-2032
    100. Mexico
      1. Market Estimates & Forecast, 2023-2032
        1. Market
    101. Estimates & Forecast by Source, 2023-2032
      1. Market Estimates &
    102. Forecast by Application, 2023-2032
      1. Market Estimates & Forecast
    103. by End Use Industry, 2023-2032
      1. Rest of Latin America
        1. Market
    104. Estimates & Forecast, 2023-2032
      1. Market Estimates & Forecast
    105. by Source, 2023-2032
      1. Market Estimates & Forecast by Application,
        1. Market Estimates & Forecast by End Use Industry, 2023-2032
    106. Competitive Landscape
      1. Introduction
      2. Market Strategy
      3. Key Development Analysis
    107. (Expansions/Mergers & Acquisitions/Joint
    108. Ventures/New Application Developments/Agreements/Investments)
    109. Company Profiles
      1. Oil and Natural Gas Corporation
        1. Company Overview
    110. Financial Updates
      1. Application/Business Segment Overview
    111. Key Developments
      1. SWOT Analysis
        1. Strategy
      2. Black
    112. Diamond Energy Inc.
      1. Company Overview
        1. Financial Updates
        2. Application/Business Segment Overview
        3. Key Developments
    113. SWOT Analysis
      1. Strategy
      2. G3 Exploration
        1. Company
    114. Overview
      1. Financial Updates
        1. Application/Business Segment
    115. Overview
      1. Key Developments
        1. SWOT Analysis
        2. Strategy
      2. IGas Energy
        1. Company Overview
        2. Financial Updates
        3. Application/Business Segment Overview
        4. Key Developments
    116. SWOT Analysis
      1. Strategy
      2. China National Offshore Oil Company
        1. Company Overview
        2. Financial Updates
        3. Application/Business
    117. Segment Overview
      1. Key Developments
        1. SWOT Analysis
    118. Strategy
      1. Royal Dutch Shell PLC
        1. Company Overview
    119. Financial Updates
      1. Application/Business Segment Overview
    120. Key Developments
      1. SWOT Analysis
        1. Strategy
      2. China
    121. National Petroleum Corporation
      1. Company Overview
        1. Financial
    122. Updates
      1. Application/Business Segment Overview
        1. Key Developments
        2. SWOT Analysis
        3. Strategy
      2. BP PLC
        1. Company
    123. Overview
      1. Financial Updates
        1. Application/Business Segment
    124. Overview
      1. Key Developments
        1. SWOT Analysis
        2. Strategy
      2. TLOU Energy Ltd
        1. Company Overview
        2. Financial Updates
        3. Application/Business Segment Overview
        4. Key Developments
    125. SWOT Analysis
      1. Strategy
      2. Occidental Petroleum
    126. Company Overview
      1. Financial Updates
        1. Application/Business
    127. Segment Overview
      1. Key Developments
        1. SWOT Analysis
    128. Strategy
      1. Senex Energy Limited
        1. Company Overview
    129. Financial Updates
      1. Application/Business Segment Overview
    130. Key Developments
      1. SWOT Analysis
        1. Strategy
      2. IGas
    131. Energy
      1. Company Overview
        1. Financial Updates
    132. Application/Business Segment Overview
      1. Key Developments
    133. SWOT Analysis
      1. Strategy
      2. Metgasco Ltd.
        1. Company
    134. Overview
      1. Financial Updates
        1. Application/Business Segment
    135. Overview
      1. Key Developments
        1. SWOT Analysis
        2. Strategy
      2. Bow Energy
        1. Company Overview
        2. Financial Updates
        3. Application/Business Segment Overview
        4. Key Developments
        5. SWOT Analysis
        6. Strategy
      3. Dart Energy Corporation
        1. Company Overview
        2. Financial Updates
        3. Application/Business
    136. Segment Overview
      1. Key Developments
        1. SWOT Analysis
    137. Strategy
    138. Conclusion
    139. by Region, 2023-2032
    140. Methane Market, by Country, 2023-2032
    141. Market, by Country, 2023-2032
    142. North America: Methane Source Market, by Country, 2023-2032
    143. Methane Source Market, by Country, 2023-2032
    144. Source Market, by Country, 2023-2032
    145. Source Market, by Country, 2023-2032
    146. Market, by Country, 2023-2032
    147. Asia-Pacific: Methane Application Market, by Country, 2023-2032
    148. Middle East & Africa: Methane Application Market, by Country, 2023-2032
    149. Latin America: Methane Application Market, by Country, 2023-2032
    150. Methane Source Market, by Region, 2023-2032
    151. Source Market, by Country, 2023-2032
    152. by Country, 2023-2032
    153. Market, by Region, 2023-2032
    154. America: Methane Market, by Source, 2023-2032
    155. Market, by Application, 2023-2032
    156. Grade, 2023-2032
    157. Market, by Application, 2023-2032
    158. Asia-Pacific: Methane Market, by Source, 2023-2032
    159. Methane Market, by Application, 2023-2032
    160. by Grade, 2023-2032
    161. Latin America: Methane Market, by Country, 2023-2032
    162. Methane Market, by Source, 2023-2032
    163. by Application, 2023-2032
    164. of Methane Market
    165. Share of Methane Market, by Country, 2020 (%)
    166. by Source, 2020 (%)
    167. Sub Segments of Source

    Methane Source Outlook (USD Billion, 2018-2032)

    • Natural
    • Synthetic

    Methane Application Outlook (USD Billion, 2018-2032)

    • Fuel
    • Natural Gas
    • Liquefied Natural Gas
    • Liquid-Methane Rocket Fuel
    • Chemical Feedstock

    Methane End-User Outlook (USD Billion, 2018-2032)

    • Automotive
    • Aerospace & Defense

    Methane Regional Outlook (USD Billion, 2018-2032)

    • North America Outlook (USD Billion, 2018-2032)

      • Methane by Source
        • Natural
        • Synthetic
      • Methane by Application
        • Fuel
        • Natural Gas
        • Liquefied Natural Gas
        • Liquid-Methane Rocket Fuel
        • Chemical Feedstock
      • Methane by End-User
        • Automotive
        • Aerospace & Defense
      • US Outlook (USD Billion, 2018-2032)

      • Methane by Source
        • Natural
        • Synthetic
      • Methane by Application
        • Fuel
        • Natural Gas
        • Liquefied Natural Gas
        • Liquid-Methane Rocket Fuel
        • Chemical Feedstock
      • Methane by End-User
        • Automotive
        • Aerospace & Defense
      • Canada Outlook (USD Billion, 2018-2032)

      • Methane by Source
        • Natural
        • Synthetic
      • Methane by Application
        • Fuel
        • Natural Gas
        • Liquefied Natural Gas
        • Liquid-Methane Rocket Fuel
        • Chemical Feedstock
      • Methane by End-User
        • Automotive
        • Aerospace & Defense
    • Europe Outlook (USD Billion, 2018-2032)

      • Methane by Source
        • Natural
        • Synthetic
      • Methane by Application
        • Fuel
        • Natural Gas
        • Liquefied Natural Gas
        • Liquid-Methane Rocket Fuel
        • Chemical Feedstock
      • Methane by End-User
        • Automotive
        • Aerospace & Defense
      • Germany Outlook (USD Billion, 2018-2032)

      • Methane by Source
        • Natural
        • Synthetic
      • Methane by Application
        • Fuel
        • Natural Gas
        • Liquefied Natural Gas
        • Liquid-Methane Rocket Fuel
        • Chemical Feedstock
      • Methane by End-User
        • Automotive
        • Aerospace & Defense
      • France Outlook (USD Billion, 2018-2032)

      • Methane by Source
        • Natural
        • Synthetic
      • Methane by Application
        • Fuel
        • Natural Gas
        • Liquefied Natural Gas
        • Liquid-Methane Rocket Fuel
        • Chemical Feedstock
      • Methane by End-User
        • Automotive
        • Aerospace & Defense
      • UK Outlook (USD Billion, 2018-2032)

      • Methane by Source
        • Natural
        • Synthetic
      • Methane by Application
        • Fuel
        • Natural Gas
        • Liquefied Natural Gas
        • Liquid-Methane Rocket Fuel
        • Chemical Feedstock
      • Methane by End-User
        • Automotive
        • Aerospace & Defense
      • Italy Outlook (USD Billion, 2018-2032)

      • Methane by Source
        • Natural
        • Synthetic
      • Methane by Application
        • Fuel
        • Natural Gas
        • Liquefied Natural Gas
        • Liquid-Methane Rocket Fuel
        • Chemical Feedstock
      • Methane by End-User
        • Automotive
        • Aerospace & Defense
      • Spain Outlook (USD Billion, 2018-2032)

      • Methane by Source
        • Natural
        • Synthetic
      • Methane by Application
        • Fuel
        • Natural Gas
        • Liquefied Natural Gas
        • Liquid-Methane Rocket Fuel
        • Chemical Feedstock
      • Methane by End-User
        • Automotive
        • Aerospace & Defense
      • Rest Of Europe Outlook (USD Billion, 2018-2032)

      • Methane by Source
        • Natural
        • Synthetic
      • Methane by Application
        • Fuel
        • Natural Gas
        • Liquefied Natural Gas
        • Liquid-Methane Rocket Fuel
        • Chemical Feedstock
      • Methane by End-User
        • Automotive
        • Aerospace & Defense
    • Asia-Pacific Outlook (USD Billion, 2018-2032)

      • Methane by Source
        • Natural
        • Synthetic
      • Methane by Application
        • Fuel
        • Natural Gas
        • Liquefied Natural Gas
        • Liquid-Methane Rocket Fuel
        • Chemical Feedstock
      • Methane by End-User
        • Automotive
        • Aerospace & Defense
      • China Outlook (USD Billion, 2018-2032)

      • Methane by Source
        • Natural
        • Synthetic
      • Methane by Application
        • Fuel
        • Natural Gas
        • Liquefied Natural Gas
        • Liquid-Methane Rocket Fuel
        • Chemical Feedstock
      • Methane by End-User
        • Automotive
        • Aerospace & Defense
      • Japan Outlook (USD Billion, 2018-2032)

      • Methane by Source
        • Natural
        • Synthetic
      • Methane by Application
        • Fuel
        • Natural Gas
        • Liquefied Natural Gas
        • Liquid-Methane Rocket Fuel
        • Chemical Feedstock
      • Methane by End-User
        • Automotive
        • Aerospace & Defense
      • India Outlook (USD Billion, 2018-2032)

      • Methane by Source
        • Natural
        • Synthetic
      • Methane by Application
        • Fuel
        • Natural Gas
        • Liquefied Natural Gas
        • Liquid-Methane Rocket Fuel
        • Chemical Feedstock
      • Methane by End-User
        • Automotive
        • Aerospace & Defense
      • Australia Outlook (USD Billion, 2018-2032)

      • Methane by Source
        • Natural
        • Synthetic
      • Methane by Application
        • Fuel
        • Natural Gas
        • Liquefied Natural Gas
        • Liquid-Methane Rocket Fuel
        • Chemical Feedstock
      • Methane by End-User
        • Automotive
        • Aerospace & Defense
      • Rest of Asia-Pacific Outlook (USD Billion, 2018-2032)

      • Methane by Source
        • Natural
        • Synthetic
      • Methane by Application
        • Fuel
        • Natural Gas
        • Liquefied Natural Gas
        • Liquid-Methane Rocket Fuel
        • Chemical Feedstock
      • Methane by End-User
        • Automotive
        • Aerospace & Defense
    • Rest of the World Outlook (USD Billion, 2018-2032)

      • Methane by Source
        • Natural
        • Synthetic
      • Methane by Application
        • Fuel
        • Natural Gas
        • Liquefied Natural Gas
        • Liquid-Methane Rocket Fuel
        • Chemical Feedstock
      • Methane by End-User
        • Automotive
        • Aerospace & Defense
      • Middle East Outlook (USD Billion, 2018-2032)

      • Methane by Source
        • Natural
        • Synthetic
      • Methane by Application
        • Fuel
        • Natural Gas
        • Liquefied Natural Gas
        • Liquid-Methane Rocket Fuel
        • Chemical Feedstock
      • Methane by End-User
        • Automotive
        • Aerospace & Defense
      • Africa Outlook (USD Billion, 2018-2032)

      • Methane by Source
        • Natural
        • Synthetic
      • Methane by Application
        • Fuel
        • Natural Gas
        • Liquefied Natural Gas
        • Liquid-Methane Rocket Fuel
        • Chemical Feedstock
      • Methane by End-User
        • Automotive
        • Aerospace & Defense
      • Latin America Outlook (USD Billion, 2018-2032)

      • Methane by Source
        • Natural
        • Synthetic
      • Methane by Application
        • Fuel
        • Natural Gas
        • Liquefied Natural Gas
        • Liquid-Methane Rocket Fuel
        • Chemical Feedstock
      • Methane by End-User
        • Automotive
        • Aerospace & Defense
    Methane Market Research Report – Global Forecast till 2032 Infographic
    Free Sample Request

    Kindly complete the form below to receive a free sample of this Report

    Customer Strories

    “I am very pleased with how market segments have been defined in a relevant way for my purposes (such as "Portable Freezers & refrigerators" and "last-mile"). In general the report is well structured. Thanks very much for your efforts.”

    Victoria Milne Founder
    Case Study

    Chemicals and Materials