• Cat-intel
  • MedIntelliX
  • Resources
  • About Us
  • Hero Background
    English
    Chinese
    French
    Japanese
    Korean
    German
    Spanish

    Methane Market Share

    ID: MRFR/CnM/5904-HCR
    140 Pages
    Priya Nagrale
    October 2025

    Methane Market Research Report Information By Source (Natural and Synthetic), By Application (Fuel, Natural Gas, Liquefied Natural Gas, Liquid-Methane Rocket Fuel, and Chemical Feedstock), By End Use Industry (Automotive and Aerospace & Defense), and By Region (North America, Europe, Asia-Pacific, and Rest Of The World) – Market Forecast Till 2035

    Share:
    Download PDF ×

    We do not share your information with anyone. However, we may send you emails based on your report interest from time to time. You may contact us at any time to opt-out.

    Methane Market Infographic
    $ 4,950.0
    $ 5,950.0
    $ 7,250.0

    Market Share

    Methane Market Share Analysis

    In the rapidly evolving Methane Market, companies implement a variety of market share positioning strategies to establish a strong presence and gain a competitive edge. One fundamental strategy involves differentiation, where companies focus on producing high-quality methane with unique features, such as purity levels, extraction methods, or applications in industries like energy production, petrochemicals, and transportation. By investing in research and development, companies can create innovative methane solutions that cater to the diverse needs of customers, setting themselves apart from competitors and securing a significant market share. Differentiation not only attracts customers seeking specific qualities in methane but also enhances the overall perceived value of the gas in the market.

    Cost leadership is another pivotal strategy employed by companies in the Methane Market. This approach revolves around becoming a low-cost producer through optimized extraction processes, efficient distribution networks, and strategic partnerships. Emphasizing cost efficiency enables companies to offer competitive pricing for their methane, making them attractive to cost-conscious customers and gaining a larger market share. Successful execution of this strategy demands continuous improvement, innovative production methods, and a keen focus on operational excellence to maintain profitability while providing cost-competitive products.

    Strategic alliances and partnerships play a crucial role in shaping the market share positioning of companies in the Methane Market. Collaborating with key stakeholders such as natural gas producers, energy companies, or technology providers allows firms to access essential resources, cutting-edge technologies, and distribution channels. Through strategic partnerships, companies can expand their market reach, leverage shared expertise, and create synergies that enhance their overall competitive position. This collaborative approach fosters innovation, accelerates market penetration, and contributes to a more robust market presence.

    Geographical expansion is a strategic imperative for companies aiming to increase their market share in the Methane Market. Identifying and entering new markets or expanding existing operations globally allows companies to tap into regions with growing demand for natural gas and methane. Adapting products to suit the unique requirements of different markets is crucial for success in geographical expansion. This strategy enables companies to diversify their customer base, reduce dependency on specific regions, and strengthen their market share on a global scale.

    Furthermore, a customer-centric approach is indispensable for gaining and maintaining market share in the Methane Market. Understanding customer preferences, providing efficient supply chains, and offering excellent customer service contribute to building strong relationships. Companies that prioritize customer satisfaction often benefit from increased loyalty, positive word-of-mouth marketing, and repeat business, ultimately solidifying their market share. As industries increasingly prioritize cleaner energy sources, aligning methane products with customer expectations becomes crucial for sustained success in the Methane Market.

    Methane gas is extensively utilized in the manufacturing and processing of fuel and generating electricity. The demand for electricity supply has increased double folds in both urban as well as rural areas. This is driving the Global Methane Market. The rise in demand for various transportation facilities and their use as a raw material in the chemical industry is also pushing its market growth.

    Market Summary

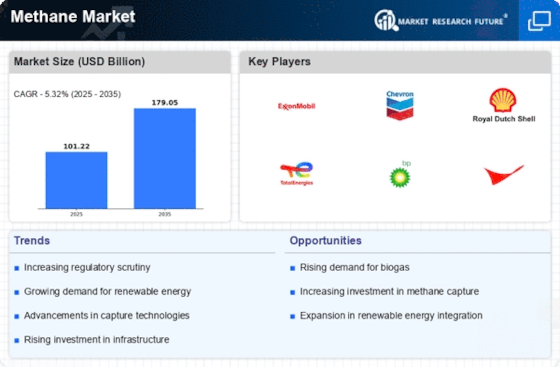
    As per Market Research Future Analysis, the Global Methane Market was valued at USD 101.22 Billion in 2024 and is projected to grow to USD 179.05 Billion by 2035, with a CAGR of 5.32% from 2025 to 2035. The market is driven by the increasing demand for high purity methane in the electronics industry, particularly for graphene production used in semiconductors and electronic components. The automotive sector is also a significant contributor to market growth, alongside advancements in methane reforming technologies.

    Key Market Trends & Highlights

    The methane market is experiencing notable trends driven by technological advancements and increasing demand across various sectors.

    • Methane Market Size in 2024: USD 101.22 Billion.
    • Projected Market Size by 2035: USD 179.05 Billion.
    • CAGR from 2025 to 2035: 5.32%.
    • North America held 45.80% market share in 2022.

    Market Size & Forecast

    2024 Market Size USD 101.22 Billion
    2035 Market Size USD 179.05 Billion
    CAGR (2024-2035) 5.32%
    Largest Regional Market Share in 2022 North America.

    Major Players

    Key players include Oil and Natural Gas Corporation, Royal Dutch Shell PLC, Senex Energy Limited, G3 Exploration, Black Diamond Energy Inc., Halliburton Co., IGas Energy, China National Offshore Oil Company, and BP PLC.

    Market Trends

    Increasing demand from electronics industry is driving the market growth

    Electronic parts including silicon wafers, integrated circuits (IC), semiconductors, and solar cell devices all utilize high purity gases. High purity methane gas is one of the primary raw materials used to create graphene, which has remarkable properties such as little optical absorption, high charge mobility, flexibility, high electrical conductivity, and bendability. Carbon atoms are arranged in a honeycomb arrangement to form graphene, which is one carbon atom thick. These qualities make graphene suitable for a variety of applications, including as solar cells and transistors. One of graphene's most intriguing possible applications is as a transparent conducting electrode.

    The transparent conductive electrode must have good optical transparency and electrical conductivity. Indium-tin-oxide (ITO) is often used as transparent conductive electrodes due to its great optical transparency and high conductivity.

    Additionally, the production of microchips and transistors, two components that are crucial to almost all electrical devices, uses graphene. Many companies are already working on the creation of conductive ink, a type of ink that conducts electricity and is used to print graphene circuits. Chemical vapour deposition (CVD) is the most promising technology for producing graphene for large-scale electronic device applications because to its lower cost and improved efficiency.

    The market for high purity methane gas is therefore being driven by the increasing use of graphene for semiconductors and electronic components, as well as the capacity of installed semiconductors, integrated circuits used in various electronic equipment, and the development of new technologies.

    The market for high-purity methane gas is expanding as a result of rising demand for electronic goods. Components that govern the flow of electrical currents into processing systems are known as electronic products. These devices have an electrical circuit that, while in use, has the ability to produce or emit a physical radiation field. Due to the development of new technologies, such as software, app development, robots, and artificial intelligence, consumer electronics have grown and intersected with many industries and sectors, fueling consumer electronics growth.

    The requirement for high-purity methane gas to generate materials for cells and other electrical devices has expanded as a result of the growth in demand for consumer electronics products. For instance, gfu Consumer and Home Electronics GmbH, a consumer electronics company with headquarters in Therefore, the market for high-purity methane will be driven by the rising demand for electronics goods. Thus, driving the Methane market revenue.

    In 2024 Haldor Topsoe released new technology for efficient methane reforming and hydrogen production.

    In 2023 Linde introduced advanced methane conversion solutions for improved energy efficiency and sustainability.

    The global methane market is poised for transformation as nations increasingly prioritize emissions reduction strategies, reflecting a growing recognition of methane's role in climate change mitigation.

    U.S. Environmental Protection Agency

    Methane Market Market Drivers

    Market Growth Projections

    The Global Methane Market Industry is poised for substantial growth, with projections indicating a market value of 101.2 USD Billion in 2024 and an anticipated increase to 179.0 USD Billion by 2035. This growth trajectory suggests a compound annual growth rate (CAGR) of 5.32% from 2025 to 2035, reflecting the increasing recognition of methane as a viable energy source. The market dynamics are influenced by various factors, including technological advancements, regulatory frameworks, and the growing demand for clean energy solutions. These projections underscore the potential for methane to play a significant role in the global energy transition.

    Growing Awareness of Climate Change

    The increasing awareness of climate change and its impacts is driving the Global Methane Market Industry towards more sustainable practices. As stakeholders, including consumers and businesses, become more informed about the environmental consequences of methane emissions, there is a growing demand for solutions that mitigate these effects. This awareness is prompting industries to invest in methane recovery and utilization technologies, aligning with global climate goals. The market is projected to experience a compound annual growth rate (CAGR) of 5.32% from 2025 to 2035, indicating a robust response to the urgent need for climate action and sustainable energy solutions.

    Government Regulations and Incentives

    Government regulations and incentives are significantly influencing the Global Methane Market Industry, as policymakers worldwide recognize the importance of reducing methane emissions. Regulatory frameworks aimed at curbing emissions from various sectors, including agriculture and waste management, are being established. These regulations often come with financial incentives for companies that invest in methane recovery technologies. As a result, the market is expected to grow, with projections indicating a rise to 179.0 USD Billion by 2035. This regulatory environment fosters innovation and encourages industries to adopt cleaner practices, thereby enhancing the overall sustainability of methane utilization.

    Expansion of Natural Gas Infrastructure

    The expansion of natural gas infrastructure is a crucial driver for the Global Methane Market Industry, as it facilitates the increased utilization of methane as a clean energy source. Investments in pipelines, storage facilities, and distribution networks are enabling the efficient transport of natural gas, which is primarily composed of methane. This infrastructure development not only supports energy security but also promotes the transition to cleaner energy sources. As the global energy landscape evolves, the demand for natural gas is expected to rise, further bolstering the methane market and contributing to its projected growth in the coming years.

    Rising Demand for Clean Energy Solutions

    The Global Methane Market Industry is experiencing a surge in demand for clean energy solutions, driven by the global shift towards sustainable practices. Methane, as a potent energy source, is being increasingly recognized for its potential to reduce greenhouse gas emissions when captured and utilized effectively. In 2024, the market is projected to reach 101.2 USD Billion, reflecting the growing investments in technologies that harness methane from sources such as landfills and agricultural waste. Governments worldwide are implementing policies to promote methane recovery, further propelling market growth as industries seek to align with environmental regulations and consumer preferences for cleaner energy.

    Technological Advancements in Methane Capture

    Technological advancements play a pivotal role in the Global Methane Market Industry, enhancing the efficiency and effectiveness of methane capture and utilization processes. Innovations in extraction techniques, such as advanced biogas systems and improved leak detection technologies, are enabling industries to minimize methane emissions while maximizing energy recovery. These developments not only contribute to environmental sustainability but also offer economic benefits by reducing operational costs. As the market evolves, the integration of smart technologies and data analytics is likely to optimize methane management, potentially leading to a more robust market landscape as stakeholders increasingly adopt these solutions.

    Market Segment Insights

    Methane Source Insights

    The Methane market segmentation, based on source, includes natural and synthetic. In 2022, the natural category led the market, and this trend is anticipated throughout the forecast period. This is explained by methane's widespread availability in the environment.

    Methane Application Insights

    The Methane market segmentation, based on application, includes fuel, natural gas, liquefied natural gas, liquid-methane rocket fuel, and chemical feedstock. In 2022, the worldwide liquid-methane rocket fuel market was dominated by the fuel category. This can be linked to the rising demand for gasoline across many industries worldwide.

    Methane End Use Industry Insights

    The Methane market segmentation, based on End Use Industry, includes automotive and aerospace & defense. Due to the growing use of methane in the automotive industry, the automotive segment led the methane market in 2022.

    Figure 1:  Methane Market, by End Use Industry, 2023 & 2032 (USD Billion)

    Source: Secondary Research, Primary Research, Market Research Future Database and Analyst Review

    Get more detailed insights about Methane Market Research Report – Global Forecast till 2032

    Regional Insights

    By region, the study provides the market insights into North America, Europe, Asia-Pacific and Rest of the World. The North America Methane Market dominated this market in 2022 (45.80%). This region has grown as a result of a number of causes, including a high rate of industrialisation, rising consumer spending, the presence of major businesses, and technical breakthroughs. The market for high purity methane gas is expanding in the area as a result of rising automotive penetration, rising vehicle modernization, and attempts to encourage the use of electric vehicles.

    The growth in this region is also fueled by expanding applications in the electrical and electronics industries. Further, the U.S. Methane market held the largest market share, and the Canada Methane market was the fastest growing market in the North America region.

    Further, the major countries studied in the market report are The US, Canada, German, France, the UK, Italy, Spain, China, Japan, India, Australia, South Korea, and Brazil.

    Figure 2:  METHANE MARKET SHARE BY REGION 2023 (USD Billion)

    METHANE MARKET SHARE BY REGION 2022

    Source: Secondary Research, Primary Research, Market Research Future Database and Analyst Review

    Europe Methane market is expected to register significant growth from 2023 to 2032. The chemical sector and the thriving and expanding car industry belong to this. By using methane gas, many significant players are also manufacturing liquefied natural gas. Further, the German Methane market held the largest market share, and the U.K Methane market was the fastest growing market in the European region

    The Asia Pacific Methane market, accounted for the healthy market share in 2022. The market for methane in emerging nations is quite promising. The demand for methane, which is utilized as a chemical feedstock in businesses, has expanded as a result of urbanization and industrialisation. Methane is used as a fuel in the expanding automotive sector. Moreover, China’s Methane market held the largest market share, and the Indian Methane market was the fastest growing market in the Asia-Pacific region.

    Key Players and Competitive Insights

    Leading market players are investing heavily in research and development in order to expand their product lines, which will help the Methane market, grow even more. Market participants are also undertaking a variety of strategic activities to expand their footprint, with important market developments including new product launches, contractual agreements, mergers and acquisitions, higher investments, and collaboration with other organizations. To expand and survive in a more competitive and rising market climate, Methane industry must offer cost-effective items.

    Manufacturing locally to minimize operational costs is one of the key business tactics used by manufacturers in the Methane industry to benefit clients and increase the market sector. In recent years, the Methane industry has offered some of the most significant advantages to medicine.

    Major players in the Methane market, including Oil and Natural Gas Corporation, Royal Dutch Shell PLC, Senex Energy Limited, G3 Exploration, Black Diamond Energy Inc., Halliburton Co., IGas Energy, China National Offshore Oil Company, China National Petroleum Corporation, Metgasco Ltd., BP PLC, TLOU Energy Ltd, Dart Energy Corporation, Bow Energy, and American Gas Products, are attempting to increase market demand by investing in research and development operations.

    Engineering and industrial gas provider Linde plc (Linde). Industrial, process, and speciality gases are provided by it. producing well producing industrial gases including carbon dioxide, helium, hydrogen, electronic gases, and acetylene, the company also produces atmospheric gases like oxygen, nitrogen, and argon. Additionally, Linde provides a variety of gas production and processing services in addition to designing, engineering, and constructing machinery that produces gases for internal use. Healthcare, petroleum refining, manufacturing, food, beverage carbonation, fiber-optics, steel production, aerospace, chemicals and energy, electronics, and water treatment are just a few of the industries it supports.

    In APAC, EMEA, and the Americas, it runs cryogenic air separation plants, hydrogen plants, and carbon dioxide plants. In Guildford, Surrey, United Kingdom, Linde is headquartered.

    The industrial and healthcare industries are served by Air Liquide SA (Air Liquide), a provider of gases, technologies, and services. Along with argon and other rare gases, the company also produces gases such as oxygen, nitrogen, and hydrogen. Customers in a variety of industries, including steel, food and pharmaceuticals, chemicals, electronics, automotive, and manufacturing, are served by this company's supply of these gases. The business also creates processing facilities and associated infrastructure. Skin disinfectants, antiseptics, and medical device disinfection products are offered by Air Liquide. The business distributes its goods via local facilities, tanker trucks, and cylinders.

    It operates in the Americas, Europe, Africa, the Middle East, and Asia-Pacific. The headquarters of Air Liquide are located in Paris, Ile-de-France, France.

    Key Companies in the Methane Market market include

    Industry Developments

    December 2021: In order to research methods to reduce methane emissions in the oil, coal, and gas industries, the U.S. Department of Energy (DOE) announced a USD35 million investment in twelve projects. In an effort to reduce methane emissions in the United States, the Advanced Research Projects Agency-Energy (ARPA-E) of the DOE announced the Reducing Emissions of Methane Every Day of the Year (REMEDY) program earlier this year.

    November 2021: For its initial data submission to the UN-sponsored Oil and Gas Methane Partnership 2.0 (OGMP 2.0), Jonah Energy LLC was awarded the Gold Standard.

    Future Outlook

    Methane Market Future Outlook

    The Global Methane Market is projected to grow at a 5.32% CAGR from 2025 to 2035, driven by regulatory pressures, technological advancements, and increasing demand for cleaner energy solutions.

    New opportunities lie in:

    • Invest in methane capture technologies to enhance efficiency and reduce emissions.
    • Develop partnerships with agricultural sectors to optimize methane utilization from livestock waste.
    • Explore innovative biogas solutions for urban waste management and energy generation.

    By 2035, the Global Methane Market is expected to be robust, reflecting substantial growth and innovation.

    Market Segmentation

    Methane: Source Outlook

    • Natural
    • Synthetic

    Methane Regional Outlook

    North America
    • US
    • Canada

    Methane Application Outlook

    • Fuel
    • Natural Gas
    • Liquefied Natural Gas
    • Liquid-Methane Rocket Fuel
    • Chemical Feedstock

    Methane End Use Industry Outlook

    • Automotive
    • Aerospace & Defense

    Report Scope

    Report Attribute/Metric Details
    Market Size 2024 USD 101.22 Billion
    Market Size 2035 179.05 (Value (USD Billion))
    Compound Annual Growth Rate (CAGR) 5.32% (2025 - 2035)
    Base Year 2024
    Market Forecast Period 2025 - 2035
    Historical Data 2018- 2022
    Market Forecast Units Value (USD Billion)
    Report Coverage Revenue Forecast, Market Competitive Landscape, Growth Factors, and Trends
    Segments Covered Source, Application, End Use Industry, and Region
    Geographies Covered North America, Europe, Asia Pacific, and the Rest of the World
    Countries Covered The US, Canada, German, France, UK, Italy, Spain, China, Japan, India, Australia, South Korea, and Brazil
    Key Companies Profiled Oil and Natural Gas Corporation, Royal Dutch Shell PLC, Senex Energy Limited, G3 Exploration, Black Diamond Energy Inc., Halliburton Co., IGas Energy, China National Offshore Oil Company, China National Petroleum Corporation, Metgasco Ltd., BP PLC, TLOU Energy Ltd, Dart Energy Corporation, Bow Energy, and American Gas Products
    Key Market Opportunities Development of new technologies
    Key Market Dynamics The growing usage of graphene in electronic components and semiconductors, the increasing capacity of installed semiconductors, and integrated circuits employed in various electronic equipment
    Market Size 2025 106.61 (Value (USD Billion))

    Market Highlights

    Author

    Priya Nagrale
    Senior Research Analyst

    She holds an experience of about 6+ years in market research and business consulting, working under the spectrum of information communication technology, telecommunications and semiconductor domains. aarti conceptualizes and implements a scalable business strategy and provides strategic leadership to the clients. her expertise lies in market estimation, competitive intelligence, pipeline analysis, customer assessment, etc.

    Leave a Comment

    Latest Comments

    John Doe
    john@example.com

    This is a great article! Really helped me understand the topic better.

    Posted on July 23, 2025, 10:15 AM
    Jane Smith
    jane@domain.com

    Thanks for sharing this. I’ve bookmarked it for later reference.

    Posted on July 22, 2025, 7:45 PM

    FAQs

    How much is the Methane market?

    Methane Market crossed a valuation of USD 101.22 Billion in 2024

    What is the growth rate of the Methane market?

    Methane Market is expected to grow with a CAGR of 5.32% in the period 2025-2035

    Which region held the largest market share in the Methane market?

    North America had the largest share in the Methane market

    Who are the key players in the Methane market?

    The key players in the Methane market are Oil and Natural Gas Corporation, Royal Dutch Shell PLC, Senex Energy Limited, G3 Exploration, Black Diamond Energy Inc., Halliburton Co., IGas Energy, China National Offshore Oil Company, China National Petroleum Corporation, Metgasco Ltd., BP PLC, TLOU Energy Ltd, Dart Energy Corporation, Bow Energy, and American Gas Products

    Which Source led the Methane market?

    Methane Market was valued at USD 101.22 Billion in 2024

    Which Application had the largest market share in the Methane market?

    The Fuel Application had the largest share in the Methanemarket.

    1. . Global Methane Market, by Source
      1. Introduction
      2. Natural
      3. Market Estimates & Forecast, 2023-2032
      4. Market Estimates & Forecast, by Region, 2023-2032
      5. Synthetic
      6. Market Estimates & Forecast, 2023-2032
      7. Market Estimates & Forecast, by Region, 2023-2032
    2. Introduction
    3. Natural
    4. Market Estimates & Forecast, 2023-2032
    5. Market Estimates & Forecast, by Region, 2023-2032
    6. Synthetic
    7. Market Estimates & Forecast, 2023-2032
    8. Market Estimates & Forecast, by Region, 2023-2032
    9. . Global Methane Market, by Application
      1. Introduction
      2. Fuel
      3. Market Estimates & Forecast, 2023-2032
      4. Market Estimates & Forecast, by Region, 2023-2032
      5. Natural Gas
      6. Market Estimates & Forecast, 2023-2032
      7. Market Estimates & Forecast, by Region, 2023-2032
      8. Liquified Natural Gas
      9. Market Estimates & Forecast, 2023-2032
      10. Market Estimates & Forecast, by Region, 2023-2032
      11. Chemical Feedstock
      12. Market Estimates & Forecast, 2023-2032
      13. Market Estimates & Forecast, by Region, 2023-2032
      14. Others
      15. Market Estimates & Forecast, 2023-2032
      16. Market Estimates & Forecast, by Region, 2023-2032
    10. Introduction
    11. Fuel
    12. Market Estimates & Forecast, 2023-2032
    13. Market Estimates & Forecast, by Region, 2023-2032
    14. Natural Gas
    15. Market Estimates & Forecast, 2023-2032
    16. Market Estimates & Forecast, by Region, 2023-2032
    17. Liquified Natural Gas
    18. Market Estimates & Forecast, 2023-2032
    19. Market Estimates & Forecast, by Region, 2023-2032
    20. Chemical Feedstock
    21. Market Estimates & Forecast, 2023-2032
    22. Market Estimates & Forecast, by Region, 2023-2032
    23. Others
    24. Market Estimates & Forecast, 2023-2032
    25. Market Estimates & Forecast, by Region, 2023-2032
    26. . Global Methane Market, by End Use Industry
      1. Introduction
      2. Aerospace & Defense
      3. Market Estimates & Forecast, 2023-2032
      4. Market Estimates & Forecast, by Region, 2023-2032
      5. Automotive
      6. Market Estimates & Forecast, 2023-2032
      7. Market Estimates & Forecast, by Region, 2023-2032
      8. Chemical
      9. Market Estimates & Forecast, 2023-2032
      10. Market Estimates & Forecast, by Region, 2023-2032
      11. Electrical
      12. Market Estimates & Forecast, 2023-2032
      13. Market Estimates & Forecast, by Region, 2023-2032
      14. Others
      15. Market Estimates & Forecast, 2023-2032
      16. Market Estimates & Forecast, by Region, 2023-2032
    27. Introduction
    28. Aerospace & Defense
    29. Market Estimates & Forecast, 2023-2032
    30. Market Estimates & Forecast, by Region, 2023-2032
    31. Automotive
    32. Market Estimates & Forecast, 2023-2032
    33. Market Estimates & Forecast, by Region, 2023-2032
    34. Chemical
    35. Market Estimates & Forecast, 2023-2032
    36. Market Estimates & Forecast, by Region, 2023-2032
    37. Electrical
    38. Market Estimates & Forecast, 2023-2032
    39. Market Estimates & Forecast, by Region, 2023-2032
    40. Others
    41. Market Estimates & Forecast, 2023-2032
    42. Market Estimates & Forecast, by Region, 2023-2032
    43. . Global Methane Market, by Region
      1. Introduction
      2. North America
      3. Market Estimates & Forecast, 2023-2032
      4. Market Estimates & Forecast by Source, 2023-2032
      5. Market Estimates & Forecast by Application, 2023-2032
      6. Market Estimates & Forecast by End Use Industry, 2023-2032
      7. US
      8. Market Estimates & Forecast, 2023-2032
      9. Market Estimates & Forecast by Source 2023-2032
      10. Market Estimates & Forecast by Application, 2023-2032
      11. Market Estimates & Forecast by End Use Industry, 2023-2032
      12. Canada
      13. Market Estimates & Forecast, 2023-2032
      14. Market Estimates & Forecast by Source, 2023-2032
      15. Market Estimates & Forecast by Application, 2023-2032
      16. Market Estimates & Forecast by End Use Industry, 2023-2032
      17. Europe
      18. Market Estimates & Forecast, 2023-2032
      19. Market Estimates & Forecast by Source, 2023-2032
      20. Market Estimates & Forecast by Application, 2023-2032
      21. Market Estimates & Forecast by End Use Industry, 2023-2032
      22. Germany
      23. Market Estimates & Forecast, 2023-2032
      24. Market Estimates & Forecast by Source, 2023-2032
      25. Market Estimates & Forecast by Application, 2023-2032
      26. Market Estimates & Forecast by End Use Industry, 2023-2032
      27. France
      28. Market Estimates & Forecast, 2023-2032
      29. Market Estimates & Forecast by Source, 2023-2032
      30. Market Estimates & Forecast by Application, 2023-2032
      31. Market Estimates & Forecast by End Use Industry, 2023-2032
      32. Italy
      33. Market Estimates & Forecast, 2023-2032
      34. Market Estimates & Forecast by Source, 2023-2032
      35. Market Estimates & Forecast by Application, 2023-2032
      36. Market Estimates & Forecast by End Use Industry, 2023-2032
      37. Spain
      38. Market Estimates & Forecast, 2023-2032
      39. Market Estimates & Forecast by Source, 2023-2032
      40. Market Estimates & Forecast by Application, 2023-2032
      41. Market Estimates & Forecast by End Use Industry, 2023-2032
      42. UK
      43. Market Estimates & Forecast, 2023-2032
      44. Market Estimates & Forecast by Source, 2023-2032
      45. Market Estimates & Forecast by Application, 2023-2032
      46. Market Estimates & Forecast by End Use Industry, 2023-2032
      47. Russia
      48. Market Estimates & Forecast, 2023-2032
      49. Market Estimates & Forecast by Source, 2023-2032
      50. Market Estimates & Forecast by Application, 2023-2032
      51. Market Estimates & Forecast by End Use Industry, 2023-2032
      52. Rest of Europe
      53. Market Estimates & Forecast, 2023-2032
      54. Market Estimates & Forecast by Source, 2023-2032
      55. Market Estimates & Forecast by Application, 2023-2032
      56. Market Estimates & Forecast by End Use Industry, 2023-2032
      57. Asia Pacific
      58. Market Estimates & Forecast, 2023-2032
      59. Market Estimates & Forecast by Source, 2023-2032
      60. Market Estimates & Forecast by Application, 2023-2032
      61. Market Estimates & Forecast by End Use Industry, 2023-2032
      62. China
      63. Market Estimates & Forecast, 2023-2032
      64. Market Estimates & Forecast by Source, 2023-2032
      65. Market Estimates & Forecast by Application, 2023-2032
      66. Market Estimates & Forecast by End Use Industry, 2023-2032
      67. India
      68. Market Estimates & Forecast, 2023-2032
      69. Market Estimates & Forecast by Source, 2023-2032
      70. Market Estimates & Forecast by Application, 2023-2032
      71. Market Estimates & Forecast by End Use Industry, 2023-2032
      72. Japan
      73. Market Estimates & Forecast, 2023-2032
      74. Market Estimates & Forecast by Source, 2023-2032
      75. Market Estimates & Forecast by Application, 2023-2032
      76. Market Estimates & Forecast by End Use Industry, 2023-2032
      77. Australia
      78. Market Estimates & Forecast, 2023-2032
      79. Market Estimates & Forecast by Source, 2023-2032
      80. Market Estimates & Forecast by Application, 2023-2032
      81. Market Estimates & Forecast by End Use Industry, 2023-2032
      82. New Zealand
      83. Market Estimates & Forecast, 2023-2032
      84. Market Estimates & Forecast by Source, 2023-2032
      85. Market Estimates & Forecast by Application, 2023-2032
      86. Market Estimates & Forecast by End Use Industry, 2023-2032
      87. Rest of Asia Pacific
      88. Market Estimates & Forecast, 2023-2032
      89. Market Estimates & Forecast by Source, 2023-2032
      90. Market Estimates & Forecast by Application, 2023-2032
      91. Market Estimates & Forecast by End Use Industry, 2023-2032
      92. Middle East & Africa
      93. Market Estimates & Forecast, 2023-2032
      94. Market Estimates & Forecast by Source, 2023-2032
      95. Market Estimates & Forecast by Application, 2023-2032
      96. Market Estimates & Forecast by End Use Industry, 2023-2032
      97. Turkey
      98. Market Estimates & Forecast, 2023-2032
      99. Market Estimates & Forecast by Source, 2023-2032
      100. Market Estimates & Forecast by Application, 2023-2032
      101. Market Estimates & Forecast by End Use Industry, 2023-2032
      102. Israel
      103. Market Estimates & Forecast, 2023-2032
      104. Market Estimates & Forecast by Source, 2023-2032
      105. Market Estimates & Forecast by Application, 2023-2032
      106. Market Estimates & Forecast by End Use Industry, 2023-2032
      107. North Africa
      108. Market Estimates & Forecast, 2023-2032
      109. Market Estimates & Forecast by Source, 2023-2032
      110. Market Estimates & Forecast by Application, 2023-2032
      111. Market Estimates & Forecast by End Use Industry, 2023-2032
      112. GCC
      113. Market Estimates & Forecast, 2023-2032
      114. Market Estimates & Forecast by Source, 2023-2032
      115. Market Estimates & Forecast by Application, 2023-2032
      116. Market Estimates & Forecast by End Use Industry, 2023-2032
      117. Rest of the Middle East & Africa
      118. Market Estimates & Forecast, 2023-2032
      119. Market Estimates & Forecast by Source, 2023-2032
      120. Market Estimates & Forecast by Application, 2023-2032
      121. Market Estimates & Forecast by End Use Industry, 2023-2032
      122. Latin America
      123. Market Estimates & Forecast, 2023-2032
      124. Market Estimates & Forecast by Source, 2023-2032
      125. Market Estimates & Forecast by Application, 2023-2032
      126. Market Estimates & Forecast by End Use Industry, 2023-2032
      127. Brazil
      128. Market Estimates & Forecast, 2023-2032
      129. Market Estimates & Forecast by Source, 2023-2032
      130. Market Estimates & Forecast by Application, 2023-2032
      131. Market Estimates & Forecast by End Use Industry, 2023-2032
      132. Argentina
      133. Market Estimates & Forecast, 2023-2032
      134. Market Estimates & Forecast by Source, 2023-2032
      135. Market Estimates & Forecast by Application, 2023-2032
      136. Market Estimates & Forecast by End Use Industry, 2023-2032
      137. Mexico
      138. Market Estimates & Forecast, 2023-2032
      139. Market Estimates & Forecast by Source, 2023-2032
      140. Market Estimates & Forecast by Application, 2023-2032
      141. Market Estimates & Forecast by End Use Industry, 2023-2032
      142. Rest of Latin America
      143. Market Estimates & Forecast, 2023-2032
      144. Market Estimates & Forecast by Source, 2023-2032
      145. Market Estimates & Forecast by Application, 2023-2032
      146. Market Estimates & Forecast by End Use Industry, 2023-2032
    44. Introduction
    45. North America
    46. Market Estimates & Forecast, 2023-2032
    47. Market Estimates & Forecast by Source, 2023-2032
    48. Market Estimates & Forecast by Application, 2023-2032
    49. Market Estimates & Forecast by End Use Industry, 2023-2032
    50. US
    51. Market Estimates & Forecast, 2023-2032
    52. Market Estimates & Forecast by Source 2023-2032
    53. Market Estimates & Forecast by Application, 2023-2032
    54. Market Estimates & Forecast by End Use Industry, 2023-2032
    55. Canada
    56. Market Estimates & Forecast, 2023-2032
    57. Market Estimates & Forecast by Source, 2023-2032
    58. Market Estimates & Forecast by Application, 2023-2032
    59. Market Estimates & Forecast by End Use Industry, 2023-2032
    60. Europe
    61. Market Estimates & Forecast, 2023-2032
    62. Market Estimates & Forecast by Source, 2023-2032
    63. Market Estimates & Forecast by Application, 2023-2032
    64. Market Estimates & Forecast by End Use Industry, 2023-2032
    65. Germany
    66. Market Estimates & Forecast, 2023-2032
    67. Market Estimates & Forecast by Source, 2023-2032
    68. Market Estimates & Forecast by Application, 2023-2032
    69. Market Estimates & Forecast by End Use Industry, 2023-2032
    70. France
    71. Market Estimates & Forecast, 2023-2032
    72. Market Estimates & Forecast by Source, 2023-2032
    73. Market Estimates & Forecast by Application, 2023-2032
    74. Market Estimates & Forecast by End Use Industry, 2023-2032
    75. Italy
    76. Market Estimates & Forecast, 2023-2032
    77. Market Estimates & Forecast by Source, 2023-2032
    78. Market Estimates & Forecast by Application, 2023-2032
    79. Market Estimates & Forecast by End Use Industry, 2023-2032
    80. Spain
    81. Market Estimates & Forecast, 2023-2032
    82. Market Estimates & Forecast by Source, 2023-2032
    83. Market Estimates & Forecast by Application, 2023-2032
    84. Market Estimates & Forecast by End Use Industry, 2023-2032
    85. UK
    86. Market Estimates & Forecast, 2023-2032
    87. Market Estimates & Forecast by Source, 2023-2032
    88. Market Estimates & Forecast by Application, 2023-2032
    89. Market Estimates & Forecast by End Use Industry, 2023-2032
    90. Russia
    91. Market Estimates & Forecast, 2023-2032
    92. Market Estimates & Forecast by Source, 2023-2032
    93. Market Estimates & Forecast by Application, 2023-2032
    94. Market Estimates & Forecast by End Use Industry, 2023-2032
    95. Rest of Europe
    96. Market Estimates & Forecast, 2023-2032
    97. Market Estimates & Forecast by Source, 2023-2032
    98. Market Estimates & Forecast by Application, 2023-2032
    99. Market Estimates & Forecast by End Use Industry, 2023-2032
    100. Asia Pacific
    101. Market Estimates & Forecast, 2023-2032
    102. Market Estimates & Forecast by Source, 2023-2032
    103. Market Estimates & Forecast by Application, 2023-2032
    104. Market Estimates & Forecast by End Use Industry, 2023-2032
    105. China
    106. Market Estimates & Forecast, 2023-2032
    107. Market Estimates & Forecast by Source, 2023-2032
    108. Market Estimates & Forecast by Application, 2023-2032
    109. Market Estimates & Forecast by End Use Industry, 2023-2032
    110. India
    111. Market Estimates & Forecast, 2023-2032
    112. Market Estimates & Forecast by Source, 2023-2032
    113. Market Estimates & Forecast by Application, 2023-2032
    114. Market Estimates & Forecast by End Use Industry, 2023-2032
    115. Japan
    116. Market Estimates & Forecast, 2023-2032
    117. Market Estimates & Forecast by Source, 2023-2032
    118. Market Estimates & Forecast by Application, 2023-2032
    119. Market Estimates & Forecast by End Use Industry, 2023-2032
    120. Australia
    121. Market Estimates & Forecast, 2023-2032
    122. Market Estimates & Forecast by Source, 2023-2032
    123. Market Estimates & Forecast by Application, 2023-2032
    124. Market Estimates & Forecast by End Use Industry, 2023-2032
    125. New Zealand
    126. Market Estimates & Forecast, 2023-2032
    127. Market Estimates & Forecast by Source, 2023-2032
    128. Market Estimates & Forecast by Application, 2023-2032
    129. Market Estimates & Forecast by End Use Industry, 2023-2032
    130. Rest of Asia Pacific
    131. Market Estimates & Forecast, 2023-2032
    132. Market Estimates & Forecast by Source, 2023-2032
    133. Market Estimates & Forecast by Application, 2023-2032
    134. Market Estimates & Forecast by End Use Industry, 2023-2032
    135. Middle East & Africa
    136. Market Estimates & Forecast, 2023-2032
    137. Market Estimates & Forecast by Source, 2023-2032
    138. Market Estimates & Forecast by Application, 2023-2032
    139. Market Estimates & Forecast by End Use Industry, 2023-2032
    140. Turkey
    141. Market Estimates & Forecast, 2023-2032
    142. Market Estimates & Forecast by Source, 2023-2032
    143. Market Estimates & Forecast by Application, 2023-2032
    144. Market Estimates & Forecast by End Use Industry, 2023-2032
    145. Israel
    146. Market Estimates & Forecast, 2023-2032
    147. Market Estimates & Forecast by Source, 2023-2032
    148. Market Estimates & Forecast by Application, 2023-2032
    149. Market Estimates & Forecast by End Use Industry, 2023-2032
    150. North Africa
    151. Market Estimates & Forecast, 2023-2032
    152. Market Estimates & Forecast by Source, 2023-2032
    153. Market Estimates & Forecast by Application, 2023-2032
    154. Market Estimates & Forecast by End Use Industry, 2023-2032
    155. GCC
    156. Market Estimates & Forecast, 2023-2032
    157. Market Estimates & Forecast by Source, 2023-2032
    158. Market Estimates & Forecast by Application, 2023-2032
    159. Market Estimates & Forecast by End Use Industry, 2023-2032
    160. Rest of the Middle East & Africa
    161. Market Estimates & Forecast, 2023-2032
    162. Market Estimates & Forecast by Source, 2023-2032
    163. Market Estimates & Forecast by Application, 2023-2032
    164. Market Estimates & Forecast by End Use Industry, 2023-2032
    165. Latin America
    166. Market Estimates & Forecast, 2023-2032
    167. Market Estimates & Forecast by Source, 2023-2032
    168. Market Estimates & Forecast by Application, 2023-2032
    169. Market Estimates & Forecast by End Use Industry, 2023-2032
    170. Brazil
    171. Market Estimates & Forecast, 2023-2032
    172. Market Estimates & Forecast by Source, 2023-2032
    173. Market Estimates & Forecast by Application, 2023-2032
    174. Market Estimates & Forecast by End Use Industry, 2023-2032
    175. Argentina
    176. Market Estimates & Forecast, 2023-2032
    177. Market Estimates & Forecast by Source, 2023-2032
    178. Market Estimates & Forecast by Application, 2023-2032
    179. Market Estimates & Forecast by End Use Industry, 2023-2032
    180. Mexico
    181. Market Estimates & Forecast, 2023-2032
    182. Market Estimates & Forecast by Source, 2023-2032
    183. Market Estimates & Forecast by Application, 2023-2032
    184. Market Estimates & Forecast by End Use Industry, 2023-2032
    185. Rest of Latin America
    186. Market Estimates & Forecast, 2023-2032
    187. Market Estimates & Forecast by Source, 2023-2032
    188. Market Estimates & Forecast by Application, 2023-2032
    189. Market Estimates & Forecast by End Use Industry, 2023-2032
    190. . Competitive Landscape
      1. Introduction
      2. Market Strategy
      3. Key Development Analysis (Expansions/Mergers & Acquisitions/Joint Ventures/New Application Developments/Agreements/Investments)
    191. Introduction
    192. Market Strategy
    193. Key Development Analysis (Expansions/Mergers & Acquisitions/Joint Ventures/New Application Developments/Agreements/Investments)
    194. . Company Profiles
      1. Oil and Natural Gas Corporation
      2. Company Overview
      3. Financial Updates
      4. Application/Business Segment Overview
      5. Key Developments
      6. SWOT Analysis
      7. Strategy
      8. Black Diamond Energy Inc.
      9. Company Overview
      10. Financial Updates
      11. Application/Business Segment Overview
      12. Key Developments
      13. SWOT Analysis
      14. Strategy
      15. G3 Exploration
      16. Company Overview
      17. Financial Updates
      18. Application/Business Segment Overview
      19. Key Developments
      20. SWOT Analysis
      21. Strategy
      22. IGas Energy
      23. Company Overview
      24. Financial Updates
      25. Application/Business Segment Overview
      26. Key Developments
      27. SWOT Analysis
      28. Strategy
      29. China National Offshore Oil Company
      30. Company Overview
      31. Financial Updates
      32. Application/Business Segment Overview
      33. Key Developments
      34. SWOT Analysis
      35. Strategy
      36. Royal Dutch Shell PLC
      37. Company Overview
      38. Financial Updates
      39. Application/Business Segment Overview
      40. Key Developments
      41. SWOT Analysis
      42. Strategy
      43. China National Petroleum Corporation
      44. Company Overview
      45. Financial Updates
      46. Application/Business Segment Overview
      47. Key Developments
      48. SWOT Analysis
      49. Strategy
      50. BP PLC
      51. Company Overview
      52. Financial Updates
      53. Application/Business Segment Overview
      54. Key Developments
      55. SWOT Analysis
      56. Strategy
      57. TLOU Energy Ltd
      58. Company Overview
      59. Financial Updates
      60. Application/Business Segment Overview
      61. Key Developments
      62. SWOT Analysis
      63. Strategy
      64. Occidental Petroleum
      65. Company Overview
      66. Financial Updates
      67. Application/Business Segment Overview
      68. Key Developments
      69. SWOT Analysis
      70. Strategy
      71. Senex Energy Limited
      72. Company Overview
      73. Financial Updates
      74. Application/Business Segment Overview
      75. Key Developments
      76. SWOT Analysis
      77. Strategy
      78. IGas Energy
      79. Company Overview
      80. Financial Updates
      81. Application/Business Segment Overview
      82. Key Developments
      83. SWOT Analysis
      84. Strategy
      85. Metgasco Ltd.
      86. Company Overview
      87. Financial Updates
      88. Application/Business Segment Overview
      89. Key Developments
      90. SWOT Analysis
      91. Strategy
      92. Bow Energy
      93. Company Overview
      94. Financial Updates
      95. Application/Business Segment Overview
      96. Key Developments
      97. SWOT Analysis
      98. Strategy
      99. Dart Energy Corporation
      100. Company Overview
      101. Financial Updates
      102. Application/Business Segment Overview
      103. Key Developments
      104. SWOT Analysis
      105. Strategy
    195. Oil and Natural Gas Corporation
    196. Company Overview
    197. Financial Updates
    198. Application/Business Segment Overview
    199. Key Developments
    200. SWOT Analysis
    201. Strategy
    202. Black Diamond Energy Inc.
    203. Company Overview
    204. Financial Updates
    205. Application/Business Segment Overview
    206. Key Developments
    207. SWOT Analysis
    208. Strategy
    209. G3 Exploration
    210. Company Overview
    211. Financial Updates
    212. Application/Business Segment Overview
    213. Key Developments
    214. SWOT Analysis
    215. Strategy
    216. IGas Energy
    217. Company Overview
    218. Financial Updates
    219. Application/Business Segment Overview
    220. Key Developments
    221. SWOT Analysis
    222. Strategy
    223. China National Offshore Oil Company
    224. Company Overview
    225. Financial Updates
    226. Application/Business Segment Overview
    227. Key Developments
    228. SWOT Analysis
    229. Strategy
    230. Royal Dutch Shell PLC
    231. Company Overview
    232. Financial Updates
    233. Application/Business Segment Overview
    234. Key Developments
    235. SWOT Analysis
    236. Strategy
    237. China National Petroleum Corporation
    238. Company Overview
    239. Financial Updates
    240. Application/Business Segment Overview
    241. Key Developments
    242. SWOT Analysis
    243. Strategy
    244. BP PLC
    245. Company Overview
    246. Financial Updates
    247. Application/Business Segment Overview
    248. Key Developments
    249. SWOT Analysis
    250. Strategy
    251. TLOU Energy Ltd
    252. Company Overview
    253. Financial Updates
    254. Application/Business Segment Overview
    255. Key Developments
    256. SWOT Analysis
    257. Strategy
    258. Occidental Petroleum
    259. Company Overview
    260. Financial Updates
    261. Application/Business Segment Overview
    262. Key Developments
    263. SWOT Analysis
    264. Strategy
    265. Senex Energy Limited
    266. Company Overview
    267. Financial Updates
    268. Application/Business Segment Overview
    269. Key Developments
    270. SWOT Analysis
    271. Strategy
    272. IGas Energy
    273. Company Overview
    274. Financial Updates
    275. Application/Business Segment Overview
    276. Key Developments
    277. SWOT Analysis
    278. Strategy
    279. Metgasco Ltd.
    280. Company Overview
    281. Financial Updates
    282. Application/Business Segment Overview
    283. Key Developments
    284. SWOT Analysis
    285. Strategy
    286. Bow Energy
    287. Company Overview
    288. Financial Updates
    289. Application/Business Segment Overview
    290. Key Developments
    291. SWOT Analysis
    292. Strategy
    293. Dart Energy Corporation
    294. Company Overview
    295. Financial Updates
    296. Application/Business Segment Overview
    297. Key Developments
    298. SWOT Analysis
    299. Strategy
    300. . Conclusion LIST OF TABLES Table 1 Global Methane Market, by Region, 2023-2032 Table 2 North America: Methane Market, by Country, 2023-2032 Table 3 Europe: Methane Market, by Country, 2023-2032 Table 4 Asia-Pacific: Methane Market, by Country, 2023-2032 Table 5 Middle East & Africa: Methane Market, by Country, 2023-2032 Table 6 Latin America: Methane Market, by Country, 2023-2032 Table 7 Methane Source Market, by Region, 2023-2032 Table 8 North America: Methane Source Market, by Country, 2023-2032 Table 9 Europe: Methane Source Market, by Country, 2023-2032 Table 10 Asia-Pacific: Methane Source Market, by Country, 2023-2032 Table 11 Middle East & Africa: Methane Source Market, by Country, 2023-2032 Table 12 Latin America: Methane Source Market, by Country, 2023-2032 Table 13 Methane Application Market, by Region, 2023-2032 Table 14 North America: Methane Application Market, by Country, 2023-2032 Table 15 Europe: Methane Application Market, by Country, 2023-2032 Table 16 Asia-Pacific: Methane Application Market, by Country, 2023-2032 Table 17 Middle East & Africa: Methane Application Market, by Country, 2023-2032 Table 18 Latin America: Methane Application Market, by Country, 2023-2032 Table 19 Methane Source Market, by Region, 2023-2032 Table 20 North America: Methane Source Market, by Country, 2023-2032 Table 21 Europe: Methane Source Market, by Country, 2023-2032 Table 22 Asia-Pacific: Methane Source Market, by Country, 2023-2032 Table 23 Middle East & Africa: Methane Source Market, by Country, 2023-2032 Table 24 Latin America: Methane Source Market, by Country, 2023-2032 Table 25 Global Source Market, by Region, 2023-2032 Table 26 Global Application Market, by Region, 2023-2032 Table 27 Global Source Market, by Region, 2023-2032 Table 28 North America: Methane Market, by Country, 2023-2032 Table 29 North America: Methane Market, by Source, 2023-2032 Table 30 North America: Methane Market, by Application, 2023-2032 Table 31 North America: Methane Market, by Grade, 2023-2032 Table 32 Europe: Methane Market, by Country, 2023-2032 Table 33 Europe: Methane Market, by Source, 2023-2032 Table 34 Europe: Methane Market, by Application, 2023-2032 Table 35 Europe: Methane Market, by Grade, 2023-2032 Table 36 Asia-Pacific: Methane Market, by Country, 2023-2032 Table 37 Asia-Pacific: Methane Market, by Source, 2023-2032 Table 38 Asia-Pacific: Methane Market, by Application, 2023-2032 Table 39 Asia-Pacific: Methane Market, by Grade, 2023-2032 Table 40 Middle East & Africa: Methane Market, by Country, 2023-2032 Table 41 Middle East & Africa: Methane Market, by Source, 2023-2032 Table 42 Middle East & Africa: Methane Market, by Application, 2023-2032 Table 43 Middle East & Africa: Methane Market, by Grade, 2023-2032 Table 44 Latin America: Methane Market, by Country, 2023-2032 Table 45 Latin America: Methane Market, by Source, 2023-2032 Table 46 Latin America: Methane Market, by Application, 2023-2032 Table 47 Latin America: Methane Market, by Grade, 2023-2032 LIST OF FIGURES FIGURE 1 Methane Market Segmentation FIGURE 2 Forecast Methodology FIGURE 3 Porter’s Five Forces Analysis of Methane Market FIGURE 4 Value Chain/Supply Chain of Methane Market FIGURE 5 Share of Methane Market, by Country, 2020 (%) FIGURE 6 Global Methane Market, 2023-2032 FIGURE 7 Sub Segments of Source FIGURE 9 Methane Market size, by Source, 2020 (%) FIGURE 10 Share of Methane Market, by Source, 2023-2032 FIGURE 11 Sub Segments of Application FIGURE 12 Methane Market size, by Application, 2020 (%) FIGURE 13 Share of Methane Market, by Application, 2023-2032 FIGURE 14 Sub Segments of Source FIGURE 15 Methane Market size, by Source, 2020 (%) FIGURE 16 Share of Methane Market, by Source, 2023-2032
    301. List of Tables and Figures
      1. Table FIGURE 1 Methane Market Segmentation FIGURE 2 Forecast Methodology FIGURE 3 Porter’s Five Forces Analysis of Methane Market FIGURE 4 Value Chain/Supply Chain of Methane Market FIGURE 5 Share of Methane Market, by Country, 2020 (%) FIGURE 6 Global Methane Market, 2023-2032 FIGURE 7 Sub Segments of Source FIGURE 9 Methane Market size, by Source, 2020 (%) FIGURE 10 Share of Methane Market, by Source, 2023-2032 FIGURE 11 Sub Segments of Application FIGURE 12 Methane Market size, by Application, 2020 (%) FIGURE 13 Share of Methane Market, by Application, 2023-2032 FIGURE 14 Sub Segments of Source FIGURE 15 Methane Market size, by Source, 2020 (%) FIGURE 16 Share of Methane Market, by Source, 2023-2032
    302. Table FIGURE 1 Methane Market Segmentation FIGURE 2 Forecast Methodology FIGURE 3 Porter’s Five Forces Analysis of Methane Market FIGURE 4 Value Chain/Supply Chain of Methane Market FIGURE 5 Share of Methane Market, by Country, 2020 (%) FIGURE 6 Global Methane Market, 2023-2032 FIGURE 7 Sub Segments of Source FIGURE 9 Methane Market size, by Source, 2020 (%) FIGURE 10 Share of Methane Market, by Source, 2023-2032 FIGURE 11 Sub Segments of Application FIGURE 12 Methane Market size, by Application, 2020 (%) FIGURE 13 Share of Methane Market, by Application, 2023-2032 FIGURE 14 Sub Segments of Source FIGURE 15 Methane Market size, by Source, 2020 (%) FIGURE 16 Share of Methane Market, by Source, 2023-2032

    Methane Source Outlook (USD Billion, 2018-2032)

    • Natural
    • Synthetic

    Methane Application Outlook (USD Billion, 2018-2032)

    • Fuel
    • Natural Gas
    • Liquefied Natural Gas
    • Liquid-Methane Rocket Fuel
    • Chemical Feedstock

    Methane End-User Outlook (USD Billion, 2018-2032)

    • Automotive
    • Aerospace & Defense

    Methane Regional Outlook (USD Billion, 2018-2032)

    • North America Outlook (USD Billion, 2018-2032)

      • Methane by Source
        • Natural
        • Synthetic
      • Methane by Application
        • Fuel
        • Natural Gas
        • Liquefied Natural Gas
        • Liquid-Methane Rocket Fuel
        • Chemical Feedstock
      • Methane by End-User
        • Automotive
        • Aerospace & Defense
      • US Outlook (USD Billion, 2018-2032)

      • Methane by Source
        • Natural
        • Synthetic
      • Methane by Application
        • Fuel
        • Natural Gas
        • Liquefied Natural Gas
        • Liquid-Methane Rocket Fuel
        • Chemical Feedstock
      • Methane by End-User
        • Automotive
        • Aerospace & Defense
      • Canada Outlook (USD Billion, 2018-2032)

      • Methane by Source
        • Natural
        • Synthetic
      • Methane by Application
        • Fuel
        • Natural Gas
        • Liquefied Natural Gas
        • Liquid-Methane Rocket Fuel
        • Chemical Feedstock
      • Methane by End-User
        • Automotive
        • Aerospace & Defense
    • Europe Outlook (USD Billion, 2018-2032)

      • Methane by Source
        • Natural
        • Synthetic
      • Methane by Application
        • Fuel
        • Natural Gas
        • Liquefied Natural Gas
        • Liquid-Methane Rocket Fuel
        • Chemical Feedstock
      • Methane by End-User
        • Automotive
        • Aerospace & Defense
      • Germany Outlook (USD Billion, 2018-2032)

      • Methane by Source
        • Natural
        • Synthetic
      • Methane by Application
        • Fuel
        • Natural Gas
        • Liquefied Natural Gas
        • Liquid-Methane Rocket Fuel
        • Chemical Feedstock
      • Methane by End-User
        • Automotive
        • Aerospace & Defense
      • France Outlook (USD Billion, 2018-2032)

      • Methane by Source
        • Natural
        • Synthetic
      • Methane by Application
        • Fuel
        • Natural Gas
        • Liquefied Natural Gas
        • Liquid-Methane Rocket Fuel
        • Chemical Feedstock
      • Methane by End-User
        • Automotive
        • Aerospace & Defense
      • UK Outlook (USD Billion, 2018-2032)

      • Methane by Source
        • Natural
        • Synthetic
      • Methane by Application
        • Fuel
        • Natural Gas
        • Liquefied Natural Gas
        • Liquid-Methane Rocket Fuel
        • Chemical Feedstock
      • Methane by End-User
        • Automotive
        • Aerospace & Defense
      • Italy Outlook (USD Billion, 2018-2032)

      • Methane by Source
        • Natural
        • Synthetic
      • Methane by Application
        • Fuel
        • Natural Gas
        • Liquefied Natural Gas
        • Liquid-Methane Rocket Fuel
        • Chemical Feedstock
      • Methane by End-User
        • Automotive
        • Aerospace & Defense
      • Spain Outlook (USD Billion, 2018-2032)

      • Methane by Source
        • Natural
        • Synthetic
      • Methane by Application
        • Fuel
        • Natural Gas
        • Liquefied Natural Gas
        • Liquid-Methane Rocket Fuel
        • Chemical Feedstock
      • Methane by End-User
        • Automotive
        • Aerospace & Defense
      • Rest Of Europe Outlook (USD Billion, 2018-2032)

      • Methane by Source
        • Natural
        • Synthetic
      • Methane by Application
        • Fuel
        • Natural Gas
        • Liquefied Natural Gas
        • Liquid-Methane Rocket Fuel
        • Chemical Feedstock
      • Methane by End-User
        • Automotive
        • Aerospace & Defense
    • Asia-Pacific Outlook (USD Billion, 2018-2032)

      • Methane by Source
        • Natural
        • Synthetic
      • Methane by Application
        • Fuel
        • Natural Gas
        • Liquefied Natural Gas
        • Liquid-Methane Rocket Fuel
        • Chemical Feedstock
      • Methane by End-User
        • Automotive
        • Aerospace & Defense
      • China Outlook (USD Billion, 2018-2032)

      • Methane by Source
        • Natural
        • Synthetic
      • Methane by Application
        • Fuel
        • Natural Gas
        • Liquefied Natural Gas
        • Liquid-Methane Rocket Fuel
        • Chemical Feedstock
      • Methane by End-User
        • Automotive
        • Aerospace & Defense
      • Japan Outlook (USD Billion, 2018-2032)

      • Methane by Source
        • Natural
        • Synthetic
      • Methane by Application
        • Fuel
        • Natural Gas
        • Liquefied Natural Gas
        • Liquid-Methane Rocket Fuel
        • Chemical Feedstock
      • Methane by End-User
        • Automotive
        • Aerospace & Defense
      • India Outlook (USD Billion, 2018-2032)

      • Methane by Source
        • Natural
        • Synthetic
      • Methane by Application
        • Fuel
        • Natural Gas
        • Liquefied Natural Gas
        • Liquid-Methane Rocket Fuel
        • Chemical Feedstock
      • Methane by End-User
        • Automotive
        • Aerospace & Defense
      • Australia Outlook (USD Billion, 2018-2032)

      • Methane by Source
        • Natural
        • Synthetic
      • Methane by Application
        • Fuel
        • Natural Gas
        • Liquefied Natural Gas
        • Liquid-Methane Rocket Fuel
        • Chemical Feedstock
      • Methane by End-User
        • Automotive
        • Aerospace & Defense
      • Rest of Asia-Pacific Outlook (USD Billion, 2018-2032)

      • Methane by Source
        • Natural
        • Synthetic
      • Methane by Application
        • Fuel
        • Natural Gas
        • Liquefied Natural Gas
        • Liquid-Methane Rocket Fuel
        • Chemical Feedstock
      • Methane by End-User
        • Automotive
        • Aerospace & Defense
    • Rest of the World Outlook (USD Billion, 2018-2032)

      • Methane by Source
        • Natural
        • Synthetic
      • Methane by Application
        • Fuel
        • Natural Gas
        • Liquefied Natural Gas
        • Liquid-Methane Rocket Fuel
        • Chemical Feedstock
      • Methane by End-User
        • Automotive
        • Aerospace & Defense
      • Middle East Outlook (USD Billion, 2018-2032)

      • Methane by Source
        • Natural
        • Synthetic
      • Methane by Application
        • Fuel
        • Natural Gas
        • Liquefied Natural Gas
        • Liquid-Methane Rocket Fuel
        • Chemical Feedstock
      • Methane by End-User
        • Automotive
        • Aerospace & Defense
      • Africa Outlook (USD Billion, 2018-2032)

      • Methane by Source
        • Natural
        • Synthetic
      • Methane by Application
        • Fuel
        • Natural Gas
        • Liquefied Natural Gas
        • Liquid-Methane Rocket Fuel
        • Chemical Feedstock
      • Methane by End-User
        • Automotive
        • Aerospace & Defense
      • Latin America Outlook (USD Billion, 2018-2032)

      • Methane by Source
        • Natural
        • Synthetic
      • Methane by Application
        • Fuel
        • Natural Gas
        • Liquefied Natural Gas
        • Liquid-Methane Rocket Fuel
        • Chemical Feedstock
      • Methane by End-User
        • Automotive
        • Aerospace & Defense
    Infographic

    Free Sample Request

    Kindly complete the form below to receive a free sample of this Report

    Get Free Sample

    Customer Strories

    “I am very pleased with how market segments have been defined in a relevant way for my purposes (such as "Portable Freezers & refrigerators" and "last-mile"). In general the report is well structured. Thanks very much for your efforts.”

    Victoria Milne

    Founder
    Case Study
    Chemicals and Materials