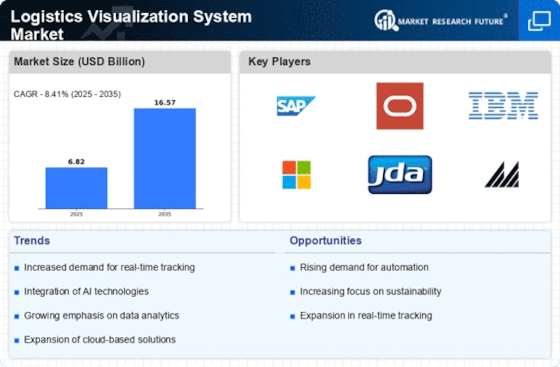
Focus on Sustainability
Sustainability has emerged as a critical driver in the Logistics Visualization System Market. Companies are increasingly prioritizing eco-friendly practices, which necessitate the adoption of systems that can visualize and optimize logistics processes. By utilizing these systems, organizations can identify inefficiencies and reduce waste, leading to lower carbon footprints. The demand for sustainable logistics solutions is expected to rise, with a significant portion of logistics firms aiming to achieve net-zero emissions by 2030. This trend is likely to create opportunities for logistics visualization systems that provide insights into sustainable practices, thereby enhancing their market appeal. As a result, the Logistics Visualization System Market is poised for growth as businesses seek to align their operations with environmental goals.
Rising E-commerce Demand
The surge in e-commerce activities is significantly influencing the Logistics Visualization System Market. As online shopping continues to gain traction, logistics companies are compelled to enhance their operational capabilities to meet consumer expectations for fast and reliable delivery. This shift necessitates the implementation of logistics visualization systems that can streamline processes and provide real-time tracking information. The e-commerce logistics market is projected to grow at a rate of 20% annually, creating a substantial demand for visualization systems that can support this growth. Consequently, the Logistics Visualization System Market is likely to benefit from the increasing need for efficient logistics solutions tailored to the e-commerce sector.
Enhanced Data Visualization Tools
The demand for enhanced data visualization tools is a prominent driver in the Logistics Visualization System Market. As logistics operations become increasingly complex, the ability to visualize data effectively is paramount. Advanced visualization tools enable stakeholders to interpret vast amounts of data quickly, facilitating informed decision-making. The market for these tools is expected to expand, with a projected increase in adoption rates among logistics companies. By 2026, it is estimated that over 60% of logistics firms will implement advanced visualization systems to improve operational efficiency. This trend underscores the importance of data-driven insights in the logistics sector, further fueling the growth of the Logistics Visualization System Market.
Integration of Advanced Technologies
The Logistics Visualization System Market is experiencing a notable shift due to the integration of advanced technologies such as artificial intelligence, machine learning, and the Internet of Things. These technologies enhance real-time data processing and analytics, allowing companies to optimize their supply chain operations. For instance, AI algorithms can predict demand fluctuations, enabling businesses to adjust their logistics strategies accordingly. The market for logistics visualization systems is projected to grow at a compound annual growth rate of approximately 15% over the next five years, driven by the increasing need for efficiency and accuracy in logistics management. As organizations adopt these technologies, they are likely to gain a competitive edge, further propelling the growth of the Logistics Visualization System Market.
Regulatory Compliance and Risk Management
Regulatory compliance and risk management are becoming increasingly vital in the Logistics Visualization System Market. As governments implement stricter regulations regarding transportation and logistics, companies must adopt systems that ensure compliance and mitigate risks. Logistics visualization systems can provide real-time monitoring and reporting capabilities, enabling organizations to adhere to regulatory requirements effectively. The market for compliance-focused logistics solutions is expected to grow, with an emphasis on systems that can adapt to changing regulations. This trend highlights the importance of risk management in logistics operations, suggesting that the Logistics Visualization System Market will continue to expand as businesses seek to navigate the complexities of regulatory landscapes.


