• Cat-intel
  • MedIntelliX
  • Resources
  • About Us
  • Request Free Sample ×

    Kindly complete the form below to receive a free sample of this Report

    Leading companies partner with us for data-driven Insights

    clients tt-cursor

    Fluid Management Visualization System Market

    ID: MRFR/HC/29485-HCR
    100 Pages
    Rahul Gotadki
    September 2025

    Fluid Management & Visualization System Market Research Report By Product Type (Software, Hardware, Services), By Application (Oil and Gas, Chemicals and Petrochemicals, Power Generation, Pharmaceuticals, Other Industrial Applications), By Deployment Type (On-Premises, Cloud-Based), By End-User Industry (Manufacturing, Energy, Healthcare, Government and Defense, Other End-User Industries), By Visualization Tools (Dashboards, Reports, Graphs, Charts, Maps) and By Regional (North America, Europe, South America, Asia Pacific, Middle East an...

    Share:
    Download PDF ×

    We do not share your information with anyone. However, we may send you emails based on your report interest from time to time. You may contact us at any time to opt-out.

    Fluid Management & Visualization System Market Research Report — Global Forecast till 2034 Infographic
    Purchase Options
    $ 4,950.0
    $ 5,950.0
    $ 7,250.0
    Table of Contents

    Fluid Management Visualization System Market Summary

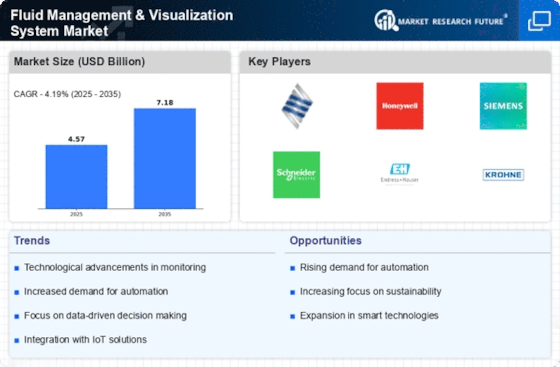
    The Global Fluid Management and Visualization System Market is projected to grow from 4.57 USD Billion in 2024 to 7.18 USD Billion by 2035.

    Key Market Trends & Highlights

    Fluid Management & Visualization System Key Trends and Highlights

    • The market is expected to experience a compound annual growth rate of 4.19 percent from 2025 to 2035.
    • By 2035, the market valuation is anticipated to reach 7.18 USD Billion, indicating robust growth potential.
    • In 2024, the market is valued at 4.57 USD Billion, reflecting a strong foundation for future expansion.
    • Growing adoption of advanced fluid management technologies due to increasing industrial automation is a major market driver.

    Market Size & Forecast

    2024 Market Size 4.57 (USD Billion)
    2035 Market Size 7.18 (USD Billion)
    CAGR (2025-2035) 4.19%

    Major Players

    Siemens, Honeywell International, Formlabs, Stratasys, BigRep, Markforged, ExOne, Carbon, Fast Radius, Protolabs, Renishaw, 3D Systems, Arcam EBM, Xometry, EOS, Materialise

    Fluid Management Visualization System Market Trends

    Fluid Management & Visualization System is being driven by the increasing need for proper and precise monitoring of fluids in industries, environmental concerns, and numerous regulations. The expansion of markets is fueled by the creation of new advanced visualization tools, for example, augmented and virtual reality, which enhance the return on investment potential optimized decision-making. For example, the recent trends in Fluid Management & Visualization System Market is evident on the shift to cloud-base systems, application of IoT sensors, and integration of predictive analytics using various algorithms.

    The increasing complexity of fluid management systems in various industries suggests a growing need for advanced visualization technologies to enhance operational efficiency and safety.

    U.S. Department of Energy

    Fluid Management Visualization System Market Drivers

    Regulatory Compliance

    Stringent regulatory frameworks across various industries drive the Global Fluid Management and Visualization System Market Industry. Governments worldwide impose regulations to ensure safety, environmental protection, and efficient resource management. For example, the water management sector faces regulations that mandate accurate monitoring of fluid quality and quantity. Compliance with these regulations necessitates advanced fluid management systems, thereby propelling market growth. As industries adapt to these requirements, the market is expected to grow at a CAGR of 4.19% from 2025 to 2035, reflecting the increasing importance of regulatory adherence in fluid management.

    Market Growth Projections

    The Global Fluid Management and Visualization System Market Industry is projected to experience substantial growth in the coming years. With an estimated market value of 4.57 USD Billion in 2024, the industry is on a trajectory to reach 7.18 USD Billion by 2035, reflecting a compound annual growth rate (CAGR) of 4.19% from 2025 to 2035. This growth is indicative of the increasing adoption of advanced fluid management technologies across various sectors, driven by factors such as technological advancements, regulatory compliance, and the rising demand for sustainable solutions.

    Technological Advancements

    The Global Fluid Management and Visualization System Market Industry experiences a surge in demand due to rapid technological advancements. Innovations in sensor technology, data analytics, and visualization software enhance the efficiency and accuracy of fluid management systems. For instance, the integration of IoT devices allows for real-time monitoring and control, which is crucial in sectors such as oil and gas, water treatment, and pharmaceuticals. As these technologies evolve, they contribute to the market's projected growth, with an estimated value of 4.57 USD Billion in 2024, indicating a robust trajectory towards 7.18 USD Billion by 2035.

    Growing Focus on Sustainability

    A growing focus on sustainability and environmental conservation significantly impacts the Global Fluid Management and Visualization System Market Industry. Companies are increasingly prioritizing sustainable practices, leading to the adoption of fluid management systems that minimize waste and enhance resource efficiency. This trend is particularly evident in sectors such as agriculture and manufacturing, where efficient fluid management can lead to substantial cost savings and reduced environmental footprints. As sustainability becomes a core business strategy, the market is poised for growth, potentially reaching 7.18 USD Billion by 2035, driven by the demand for eco-friendly fluid management solutions.

    Increased Industrial Automation

    The trend towards increased industrial automation plays a pivotal role in shaping the Global Fluid Management and Visualization System Market Industry. Industries are increasingly adopting automated systems to enhance operational efficiency and reduce human error. Fluid management systems equipped with advanced visualization tools enable seamless integration with existing automated processes, facilitating better decision-making and resource allocation. This shift towards automation is expected to drive market growth, with projections indicating a market value of 4.57 USD Billion in 2024, further escalating as industries seek to optimize their fluid management practices.

    Rising Demand for Water Management Solutions

    The Global Fluid Management and Visualization System Market Industry is significantly influenced by the rising demand for effective water management solutions. As global water scarcity becomes a pressing issue, industries are compelled to adopt advanced fluid management systems to optimize water usage and reduce waste. Technologies that provide real-time data visualization and analytics are particularly valuable in this context. The market's growth is underscored by the increasing investments in water infrastructure, which are projected to reach substantial figures in the coming years. This trend highlights the critical role of fluid management systems in addressing global water challenges.

    Market Segment Insights

    Fluid Management & Visualization System Market Product Type Insights

    The Fluid Management & Visualization System Market is segmented based on product type into software, hardware, and services. Among these segments, the software segment is expected to hold the largest market share in 2023 and is projected to continue its dominance throughout the forecast period. The growth of the software segment can be attributed to the increasing adoption of advanced software solutions for fluid management and visualization applications.

    These software solutions provide real-time data monitoring, analysis, and visualization capabilities, enabling organizations to optimize their fluid management processes and enhance operational efficiency.The hardware segment is also expected to witness significant growth during the forecast period. This growth is driven by the rising demand for specialized hardware components, such as sensors, actuators, and controllers, used in fluid management and visualization systems.

    The integration of advanced hardware technologies, such as the Internet of Things (IoT) Testing and edge computing, is further propelling the growth of the hardware segment. The services segment is expected to play a crucial role in the Fluid Management & Visualization System Market.Services such as consulting, implementation, and maintenance are essential for the effective deployment and utilization of fluid management and visualization systems. Organizations are increasingly relying on service providers to help them design, implement, and manage their fluid management systems, ensuring optimal performance and maximizing return on investment.

    Overall, the Fluid Management & Visualization System Market is poised for robust growth in the coming years, driven by the increasing adoption of advanced software and hardware solutions, as well as the growing demand for specialized services.The convergence of these segments is creating a comprehensive ecosystem that supports the efficient management and visualization of fluids in various industries.

    Source: Primary Research, Secondary Research, Market Research Future Database and Analyst Review

    Fluid Management & Visualization System Market Application Insights

    The Fluid Management & Visualization System Market is segmented based on application into Oil and Gas, Chemicals and Petrochemicals, Power Generation, Pharmaceuticals, and Other Industrial Applications. Among these segments, the Oil and Gas segment held the largest market share in 2023, owing to the increasing demand for fluid management and visualization systems in the exploration and production of oil and gas.

    The Chemicals and Petrochemicals segment is expected to witness significant growth over the forecast period, driven by the rising demand for fluid management systems in the chemical and petrochemical industries.The Power Generation segment is also anticipated to grow at a steady pace, as fluid management and visualization systems play a crucial role in ensuring efficient and reliable power generation. The Pharmaceuticals segment is expected to contribute a significant share to the market growth, driven by the increasing need for fluid management systems in the production of pharmaceuticals.

    Other Industrial Applications, which include applications in various industries such as automotive, food and beverage, and mining, are also expected to contribute to the overall market growth.

    Fluid Management & Visualization System Market Deployment Type Insights

    The deployment type segment of the Fluid Management & Visualization System Market is bifurcated into on-premises and cloud-based. The on-premises segment held a larger market share in 2023 and is anticipated to continue its dominance throughout the forecast period. This can be attributed to the increased adoption of on-premises solutions by large enterprises due to factors such as data security and control, customization options, and regulatory compliance.

    However, the cloud-based segment is projected to grow at a faster CAGR during the forecast period.This growth is attributed to the increasing adoption of cloud-based solutions by small and medium-sized enterprises (SMEs) due to their cost-effectiveness, scalability, and ease of use. Additionally, the growing popularity of cloud-based services, such as software-as-a-service (SaaS) and platform-as-a-service (PaaS), is expected to drive the growth of the cloud-based deployment type segment.

    Fluid Management & Visualization System Market End-User Industry Insights

    The Fluid Management & Visualization System Market segmentation by End-User Industry offers valuable insights into the diverse applications of these systems across various industries. Manufacturing holds a significant share of the market, driven by the need for efficient fluid management and visualization in production processes. The Energy sector is another key end-user, utilizing these systems for monitoring and optimizing fluid flow in power plants and refineries. Healthcare applications include fluid management during surgeries and medical imaging, contributing to its growing market share.Government and Defense agencies also leverage fluid management systems for simulation and training purposes.

    Other end-user industries include transportation, mining, and construction, where these systems play a crucial role in enhancing operational efficiency and safety. The Fluid Management & Visualization System Market revenue is projected to surpass $4.5 billion by 2024, indicating the increasing adoption and market growth across all end-user industries.

    Fluid Management & Visualization System Market Visualization Tools Insights

    The Fluid Management & Visualization System Market segmentation includes Visualization Tools, which play a crucial role in presenting data in a visual format. Dashboards provide real-time data monitoring and insights, enabling quick decision-making. Reports offer comprehensive data analysis and summaries. Graphs and charts visually represent data patterns and trends. Maps display data geographically, enhancing understanding of regional performance. In 2023, the Visualization Tools segment accounted for a significant share of the Fluid Management & Visualization System Market revenue.The segment is expected to maintain its growth trajectory, driven by increasing demand for data visualization and analytics solutions.

    Key industry players are investing in developing advanced visualization tools to meet the evolving needs of customers.

    Get more detailed insights about Fluid Management & Visualization System Market Research Report — Global Forecast till 2034

    Regional Insights

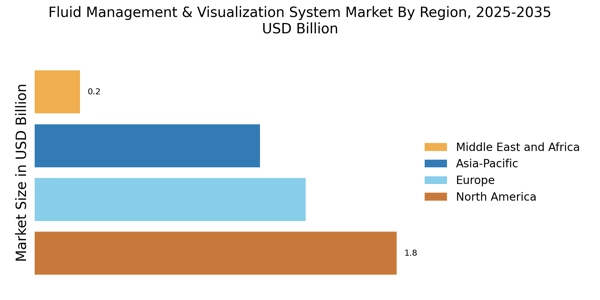
    The Fluid Management & Visualization System Market is segmented into North America, Europe, APAC, South America, and MEA. North America held the largest market share in 2023, valued at 1.708 USD Billion, and is expected to continue to dominate the market during the forecast period, reaching 2.446 USD Billion by 2032. The growth of the market in this region can be attributed to the increasing adoption of advanced fluid management and visualization systems in healthcare facilities, as well as the presence of a number of key market players.

    Europe is expected to be the second largest market for fluid management and visualization systems over the forecast period, valued at 1.077 USD Billion in 2023 and expected to grow to 1.541 USD Billion by 2032.The growth of the market in this region is being driven by the increasing demand for minimally invasive surgical procedures and the growing awareness of the benefits of fluid management systems.

    The APAC region is expected to experience the fastest growth in the market for fluid management and visualization systems during the forecast period, growing from 0.891 USD Billion in 2023 to 1.309 USD Billion by 2032. This growth is being driven by the increasing number of hospitals and healthcare facilities in the region, as well as the growing adoption of advanced medical technologies.

    South America and MEA are expected to experience moderate growth in the market for fluid management and visualization systems during the forecast period, with South America valued at 0.223 USD Billion in 2023 and expected to reach 0.337 USD Billion by 2032, and MEA valued at 0.312 USD Billion in 2023 and expected to grow to 0.456 USD Billion by 2032.

    Fluid Management & Visualization System Market Regional Insights

    Source: Primary Research, Secondary Research, Market Research Future Database and Analyst Review

    Key Players and Competitive Insights

    Major players in Fluid Management & Visualization System Market are focusing on providing innovative and advanced solutions to cater to the evolving demands of the industry. They are investing in research and development activities to enhance the capabilities of their products and stay ahead in the competitive landscape. The Fluid Management & Visualization System Market industry is characterized by strategic partnerships and collaborations among key players to strengthen their market position and expand their geographical reach.

    Leading Fluid Management & Visualization System Market players are also focusing on expanding their product portfolios through mergers and acquisitions, as well as establishing a global presence. 

    The competitive landscape is expected to intensify further as new entrants emerge and existing players seek to maintain their market share.Siemens is a leading provider of Fluid Management & Visualization System Market solutions globally. The company offers a comprehensive portfolio of products and services that enable customers to optimize their fluid management systems. Siemens has a strong focus on innovation and customer satisfaction, which has helped it maintain its position as a leading player in the industry.

    The company's commitment to research and development has resulted in the introduction of advanced technologies that enhance the efficiency and reliability of fluid management systems. Siemens has a global presence with a strong network of partners, which enables it to provide tailored solutions to customers worldwide.

    Honeywell International is a major competitor in the Fluid Management & Visualization System Market. The company offers a wide range of products and services that cater to diverse industry needs. Honeywell has a strong focus on technology and innovation, which has helped it develop cutting-edge solutions for fluid management applications. The company's products are designed to improve operational efficiency, reduce costs, and enhance safety. Honeywell has a global presence and a strong network of distributors and partners, which enables it to provide comprehensive solutions to customers worldwide.

    Key Companies in the Fluid Management Visualization System Market market include

    Industry Developments

    The Fluid Management & Visualization System market is anticipated to reach a valuation of USD 6.09 billion by 2032, expanding at a CAGR of 4.19% from 2024 to 2032. Increasing demand for minimally invasive surgeries, rising prevalence of chronic diseases, and technological advancements in fluid management systems are driving market growth. Key industry developments include the launch of the Alphenix System by Stryker in 2023, designed to enhance fluid management during robotic-assisted surgeries. Additionally, companies like Medtronic and Baxter International are investing in research and development to improve the accuracy and efficiency of visualization systems.

    The market is expected to witness increased adoption of disposable fluid management sets due to infection control concerns, particularly in emerging markets.

    Future Outlook

    Fluid Management Visualization System Market Future Outlook

    The Fluid Management & Visualization System Market is projected to grow at a 4.19% CAGR from 2024 to 2035, driven by technological advancements, increasing demand for automation, and enhanced data analytics capabilities.

    New opportunities lie in:

    • Develop AI-driven analytics tools for real-time fluid management optimization.
    • Expand into emerging markets with tailored solutions for local industries.
    • Invest in IoT integration for enhanced system connectivity and data sharing.

    By 2035, the market is expected to achieve substantial growth, reflecting evolving industry needs and technological innovations.

    Market Segmentation

    Fluid Management & Visualization System Market Regional Outlook

    • North America
    • Europe
    • South America
    • Asia Pacific
    • Middle East and Africa

    Fluid Management & Visualization System Market Application Outlook

    • Oil and Gas
    • Chemicals and Petrochemicals
    • Power Generation
    • Pharmaceuticals
    • Other Industrial Applications

    Fluid Management & Visualization System Market Product Type Outlook

    • Software
    • Hardware
    • Services

    Fluid Management & Visualization System Market Deployment Type Outlook

    • On-Premises
    • Cloud-Based

    Fluid Management & Visualization System Market End-User Industry Outlook

    • Manufacturing
    • Energy
    • Healthcare
    • Government and Defense
    • Other End-User Industries

    Fluid Management & Visualization System Market Visualization Tools Outlook

    • Dashboards
    • Reports
    • Graphs
    • Charts
    • Maps

    Report Scope

    Report Attribute/Metric Details
    Market Size 2024    4.57 (USD Billion)
    Market Size 2025    4.76 (USD Billion)
    Market Size 2034    6.89 (USD Billion)
    Compound Annual Growth Rate (CAGR)    4.19 % (2025 - 2034)
    Report Coverage Revenue Forecast, Competitive Landscape, Growth Factors, and Trends
    Base Year 2024
    Market Forecast Period 2025 - 2034
    Historical Data 2020 - 2024
    Market Forecast Units USD Billion
    Key Companies Profiled Formlabs, Stratasys, BigRep, Markforged, ExOne, Carbon, Fast Radius, Protolabs, Renishaw, 3D Systems, Arcam EBM, Xometry, EOS, Materialise
    Segments Covered Product Type, Application, Deployment Type, End-User Industry, Visualization Tools, Regional
    Key Market Opportunities Increasing demand for real-time visualization and monitoring Adoption of advanced technologies like AI and ML Growing emphasis on energy efficiency Expansion into emerging markets Government regulations and industry standards
    Key Market Dynamics Aging infrastructure, regulatory mandates, increasing automation, digitalization, remote monitoring
    Countries Covered North America, Europe, APAC, South America, MEA

    Market Highlights

    Author
    Rahul Gotadki
    Assistant Manager

    He holds an experience of about 7+ years in Market Research and Business Consulting, working under the spectrum of Life Sciences and Healthcare domains. Rahul conceptualizes and implements a scalable business strategy and provides strategic leadership to the clients. His expertise lies in market estimation, competitive intelligence, pipeline analysis, customer assessment, etc. In addition to the above, his other responsibility includes strategic tracking of high growth markets & advising clients on the potential areas of focus they could direct their business initiatives

    Leave a Comment

    FAQs

    What is the expected valuation of the Fluid Management & Visualization System Market in 2023?

    The Fluid Management & Visualization System Market is projected to reach a valuation of 6.89 billion USD in 2023.

    What is the projected CAGR of the Fluid Management & Visualization System Market from 2025 to 2034?

    The Fluid Management & Visualization System Market is expected to grow at a CAGR of 4.19% from 2025 to 2034.

    What is the expected valuation of the Fluid Management & Visualization System Market in 2034?

    The Fluid Management & Visualization System Market is projected to reach a valuation of 6.89 billion USD by 2034.

    Which region is expected to hold the largest market share in the Fluid Management & Visualization System Market?

    North America is expected to hold the largest market share in the Fluid Management & Visualization System Market throughout the forecast period.

    Which application segment is expected to account for the largest share of the Fluid Management & Visualization System Market?

    The industrial segment is expected to account for the largest share of the Fluid Management & Visualization System Market.

    Who are some of the key competitors in the Fluid Management & Visualization System Market?

    Some of the key competitors in the Fluid Management & Visualization System Market include Siemens, GE Healthcare, Philips Healthcare, and Medtronic.

    What are the major trends driving the growth of the Fluid Management & Visualization System Market?

    The increasing demand for minimally invasive surgeries and the growing adoption of image-guided procedures are major trends driving the growth of the Fluid Management & Visualization System Market.

    What are the challenges faced by the Fluid Management & Visualization System Market?

    The high cost of fluid management and visualization systems and the lack of skilled professionals are some of the challenges faced by the Fluid Management & Visualization System Market.

    What are the opportunities for growth in the Fluid Management & Visualization System Market?

    The growing demand for personalized medicine and the increasing awareness of the benefits of fluid management and visualization systems are creating opportunities for growth in the Fluid Management & Visualization System Market.

    What are the key factors that will shape the future of the Fluid Management & Visualization System Market?

    The integration of artificial intelligence and the development of new and innovative technologies are key factors that will shape the future of the Fluid Management & Visualization System Market.

    1. 'TABLE OF CONTENTS
    2. EXECUTIVE SUMMARY
    3. Market Overview
      1. Key Findings
      2. Market Segmentation
    4. Competitive Landscape
      1. Challenges and Opportunities
      2. Future Outlook
    5. MARKET INTRODUCTION
      1. Definition
      2. Scope of the study
        1. Research Objective
        2. Assumption
        3. Limitations
    6. RESEARCH METHODOLOGY
      1. Overview
    7. Data Mining
      1. Secondary Research
      2. Primary Research
    8. Primary Interviews and Information Gathering Process
      1. Breakdown of Primary
    9. Respondents
      1. Forecasting Model
      2. Market Size Estimation
    10. Bottom-Up Approach
      1. Top-Down Approach
      2. Data Triangulation
      3. Validation
    11. MARKET DYNAMICS
      1. Overview
      2. Drivers
      3. Restraints
      4. Opportunities
    12. MARKET FACTOR ANALYSIS
      1. Value chain Analysis
      2. Porter''s Five Forces
    13. Analysis
      1. Bargaining Power of Suppliers
        1. Bargaining Power
    14. of Buyers
      1. Threat of New Entrants
        1. Threat of Substitutes
        2. Intensity of Rivalry
      2. COVID-19 Impact Analysis
    15. Market Impact Analysis
      1. Regional Impact
        1. Opportunity and
    16. Threat Analysis
    17. FLUID MANAGEMENT VISUALIZATION SYSTEM
    18. MARKET, BY PRODUCT TYPE (USD BILLION)
      1. Software
      2. Hardware
      3. Services
    19. FLUID MANAGEMENT VISUALIZATION SYSTEM MARKET, BY APPLICATION
    20. (USD BILLION)
      1. Oil and Gas
      2. Chemicals and Petrochemicals
      3. Power Generation
      4. Pharmaceuticals
      5. Other Industrial Applications
    21. FLUID MANAGEMENT VISUALIZATION SYSTEM MARKET, BY DEPLOYMENT TYPE (USD BILLION)
      1. On-Premises
      2. Cloud-Based
    22. FLUID MANAGEMENT VISUALIZATION
    23. SYSTEM MARKET, BY END-USER INDUSTRY (USD BILLION)
      1. Manufacturing
    24. Energy
      1. Healthcare
      2. Government and Defense
      3. Other
    25. End-User Industries
    26. FLUID MANAGEMENT VISUALIZATION SYSTEM MARKET, BY VISUALIZATION
    27. TOOLS (USD BILLION)
      1. Dashboards
      2. Reports
      3. Graphs
      4. Charts
      5. Maps
    28. FLUID MANAGEMENT VISUALIZATION SYSTEM
    29. MARKET, BY REGIONAL (USD BILLION)
      1. North America
        1. US
        2. Canada
      2. Europe
        1. Germany
        2. UK
    30. France
      1. Russia
        1. Italy
        2. Spain
    31. Rest of Europe
      1. APAC
        1. China
        2. India
    32. Japan
      1. South Korea
        1. Malaysia
        2. Thailand
        3. Indonesia
        4. Rest of APAC
      2. South America
    33. Brazil
      1. Mexico
        1. Argentina
        2. Rest of South
    34. America
      1. MEA
        1. GCC Countries
        2. South Africa
        3. Rest of MEA
    35. COMPETITIVE LANDSCAPE
    36. Overview
      1. Competitive Analysis
      2. Market share Analysis
      3. Major Growth Strategy in the Fluid Management Visualization System Market
      4. Competitive Benchmarking
      5. Leading Players in Terms of Number
    37. of Developments in the Fluid Management Visualization System Market
    38. Key developments and growth strategies
      1. New Product Launch/Service
    39. Deployment
      1. Merger Acquisitions
        1. Joint Ventures
    40. Major Players Financial Matrix
      1. Sales and Operating Income
    41. Major Players RD Expenditure. 2023
    42. COMPANY PROFILES
      1. Formlabs
        1. Financial Overview
        2. Products Offered
        3. Key
    43. Developments
      1. SWOT Analysis
        1. Key Strategies
    44. Stratasys
      1. Financial Overview
        1. Products Offered
    45. Key Developments
      1. SWOT Analysis
        1. Key Strategies
    46. BigRep
      1. Financial Overview
        1. Products Offered
    47. Key Developments
      1. SWOT Analysis
        1. Key Strategies
    48. Markforged
      1. Financial Overview
        1. Products Offered
    49. Key Developments
      1. SWOT Analysis
        1. Key Strategies
    50. ExOne
      1. Financial Overview
        1. Products Offered
    51. Key Developments
      1. SWOT Analysis
        1. Key Strategies
    52. Carbon
      1. Financial Overview
        1. Products Offered
    53. Key Developments
      1. SWOT Analysis
        1. Key Strategies
    54. Fast Radius
      1. Financial Overview
        1. Products Offered
        2. Key Developments
        3. SWOT Analysis
        4. Key Strategies
      2. Protolabs
        1. Financial Overview
        2. Products Offered
        3. Key Developments
        4. SWOT Analysis
        5. Key Strategies
      3. Renishaw
        1. Financial Overview
        2. Products Offered
        3. Key Developments
        4. SWOT Analysis
        5. Key Strategies
      4. 3D Systems
        1. Financial Overview
        2. Products
    55. Offered
      1. Key Developments
        1. SWOT Analysis
    56. Key Strategies
      1. Arcam EBM
        1. Financial Overview
    57. Products Offered
      1. Key Developments
        1. SWOT Analysis
        2. Key Strategies
      2. Xometry
        1. Financial Overview
        2. Products Offered
        3. Key Developments
        4. SWOT
    58. Analysis
      1. Key Strategies
      2. EOS
        1. Financial
    59. Overview
      1. Products Offered
        1. Key Developments
    60. SWOT Analysis
      1. Key Strategies
      2. Materialise
    61. Financial Overview
      1. Products Offered
        1. Key Developments
        2. SWOT Analysis
        3. Key Strategies
    62. APPENDIX
      1. References
      2. Related Reports
    63. LIST OF ASSUMPTIONS
    64. SYSTEM MARKET SIZE ESTIMATES & FORECAST, BY PRODUCT TYPE, 2019-2032 (USD BILLIONS)
    65. SIZE ESTIMATES & FORECAST, BY APPLICATION, 2019-2032 (USD BILLIONS)
    66. NORTH AMERICA FLUID MANAGEMENT & VISUALIZATION SYSTEM MARKET SIZE ESTIMATES
    67. & FORECAST, BY DEPLOYMENT TYPE, 2019-2032 (USD BILLIONS)
    68. AMERICA FLUID MANAGEMENT & VISUALIZATION SYSTEM MARKET SIZE ESTIMATES &
    69. FORECAST, BY END-USER INDUSTRY, 2019-2032 (USD BILLIONS)
    70. FLUID MANAGEMENT & VISUALIZATION SYSTEM MARKET SIZE ESTIMATES & FORECAST,
    71. BY VISUALIZATION TOOLS, 2019-2032 (USD BILLIONS)
    72. MANAGEMENT & VISUALIZATION SYSTEM MARKET SIZE ESTIMATES & FORECAST, BY REGIONAL,
    73. 2032 (USD BILLIONS)
    74. SYSTEM MARKET SIZE ESTIMATES & FORECAST, BY PRODUCT TYPE, 2019-2032 (USD BILLIONS)
    75. & FORECAST, BY APPLICATION, 2019-2032 (USD BILLIONS)
    76. MANAGEMENT & VISUALIZATION SYSTEM MARKET SIZE ESTIMATES & FORECAST, BY DEPLOYMENT
    77. TYPE, 2019-2032 (USD BILLIONS)
    78. SYSTEM MARKET SIZE ESTIMATES & FORECAST, BY END-USER INDUSTRY, 2019-2032 (USD
    79. BILLIONS)
    80. SIZE ESTIMATES & FORECAST, BY VISUALIZATION TOOLS, 2019-2032 (USD BILLIONS)
    81. & FORECAST, BY REGIONAL, 2019-2032 (USD BILLIONS)
    82. MANAGEMENT & VISUALIZATION SYSTEM MARKET SIZE ESTIMATES & FORECAST, BY PRODUCT
    83. TYPE, 2019-2032 (USD BILLIONS)
    84. SYSTEM MARKET SIZE ESTIMATES & FORECAST, BY APPLICATION, 2019-2032 (USD BILLIONS)
    85. & FORECAST, BY DEPLOYMENT TYPE, 2019-2032 (USD BILLIONS)
    86. FLUID MANAGEMENT & VISUALIZATION SYSTEM MARKET SIZE ESTIMATES & FORECAST,
    87. BY END-USER INDUSTRY, 2019-2032 (USD BILLIONS)
    88. & VISUALIZATION SYSTEM MARKET SIZE ESTIMATES & FORECAST, BY VISUALIZATION
    89. TOOLS, 2019-2032 (USD BILLIONS)
    90. SYSTEM MARKET SIZE ESTIMATES & FORECAST, BY REGIONAL, 2019-2032 (USD BILLIONS)
    91. & FORECAST, BY PRODUCT TYPE, 2019-2032 (USD BILLIONS)
    92. FLUID MANAGEMENT & VISUALIZATION SYSTEM MARKET SIZE ESTIMATES & FORECAST,
    93. BY APPLICATION, 2019-2032 (USD BILLIONS)
    94. & VISUALIZATION SYSTEM MARKET SIZE ESTIMATES & FORECAST, BY DEPLOYMENT TYPE,
    95. 2032 (USD BILLIONS)
    96. SYSTEM MARKET SIZE ESTIMATES & FORECAST, BY END-USER INDUSTRY, 2019-2032 (USD
    97. BILLIONS)
    98. SIZE ESTIMATES & FORECAST, BY VISUALIZATION TOOLS, 2019-2032 (USD BILLIONS)
    99. & FORECAST, BY REGIONAL, 2019-2032 (USD BILLIONS)
    100. MANAGEMENT & VISUALIZATION SYSTEM MARKET SIZE ESTIMATES & FORECAST, BY PRODUCT
    101. TYPE, 2019-2032 (USD BILLIONS)
    102. SYSTEM MARKET SIZE ESTIMATES & FORECAST, BY APPLICATION, 2019-2032 (USD BILLIONS)
    103. ESTIMATES & FORECAST, BY DEPLOYMENT TYPE, 2019-2032 (USD BILLIONS)
    104. GERMANY FLUID MANAGEMENT & VISUALIZATION SYSTEM MARKET SIZE ESTIMATES &
    105. FORECAST, BY END-USER INDUSTRY, 2019-2032 (USD BILLIONS)
    106. FLUID MANAGEMENT & VISUALIZATION SYSTEM MARKET SIZE ESTIMATES & FORECAST,
    107. BY VISUALIZATION TOOLS, 2019-2032 (USD BILLIONS)
    108. & VISUALIZATION SYSTEM MARKET SIZE ESTIMATES & FORECAST, BY REGIONAL, 2019-2032
    109. (USD BILLIONS)
    110. SIZE ESTIMATES & FORECAST, BY PRODUCT TYPE, 2019-2032 (USD BILLIONS)
    111. UK FLUID MANAGEMENT & VISUALIZATION SYSTEM MARKET SIZE ESTIMATES & FORECAST,
    112. BY APPLICATION, 2019-2032 (USD BILLIONS)
    113. VISUALIZATION SYSTEM MARKET SIZE ESTIMATES & FORECAST, BY DEPLOYMENT TYPE, 2019-2032
    114. (USD BILLIONS)
    115. SIZE ESTIMATES & FORECAST, BY END-USER INDUSTRY, 2019-2032 (USD BILLIONS)
    116. & FORECAST, BY VISUALIZATION TOOLS, 2019-2032 (USD BILLIONS)
    117. UK FLUID MANAGEMENT & VISUALIZATION SYSTEM MARKET SIZE ESTIMATES & FORECAST,
    118. BY REGIONAL, 2019-2032 (USD BILLIONS)
    119. VISUALIZATION SYSTEM MARKET SIZE ESTIMATES & FORECAST, BY PRODUCT TYPE, 2019-2032
    120. (USD BILLIONS)
    121. MARKET SIZE ESTIMATES & FORECAST, BY APPLICATION, 2019-2032 (USD BILLIONS)
    122. & FORECAST, BY DEPLOYMENT TYPE, 2019-2032 (USD BILLIONS)
    123. FLUID MANAGEMENT & VISUALIZATION SYSTEM MARKET SIZE ESTIMATES & FORECAST,
    124. BY END-USER INDUSTRY, 2019-2032 (USD BILLIONS)
    125. & VISUALIZATION SYSTEM MARKET SIZE ESTIMATES & FORECAST, BY VISUALIZATION
    126. TOOLS, 2019-2032 (USD BILLIONS)
    127. SYSTEM MARKET SIZE ESTIMATES & FORECAST, BY REGIONAL, 2019-2032 (USD BILLIONS)
    128. & FORECAST, BY PRODUCT TYPE, 2019-2032 (USD BILLIONS)
    129. FLUID MANAGEMENT & VISUALIZATION SYSTEM MARKET SIZE ESTIMATES & FORECAST,
    130. BY APPLICATION, 2019-2032 (USD BILLIONS)
    131. & VISUALIZATION SYSTEM MARKET SIZE ESTIMATES & FORECAST, BY DEPLOYMENT TYPE,
    132. 2032 (USD BILLIONS)
    133. SYSTEM MARKET SIZE ESTIMATES & FORECAST, BY END-USER INDUSTRY, 2019-2032 (USD
    134. BILLIONS)
    135. SIZE ESTIMATES & FORECAST, BY VISUALIZATION TOOLS, 2019-2032 (USD BILLIONS)
    136. & FORECAST, BY REGIONAL, 2019-2032 (USD BILLIONS)
    137. MANAGEMENT & VISUALIZATION SYSTEM MARKET SIZE ESTIMATES & FORECAST, BY PRODUCT
    138. TYPE, 2019-2032 (USD BILLIONS)
    139. SYSTEM MARKET SIZE ESTIMATES & FORECAST, BY APPLICATION, 2019-2032 (USD BILLIONS)
    140. & FORECAST, BY DEPLOYMENT TYPE, 2019-2032 (USD BILLIONS)
    141. FLUID MANAGEMENT & VISUALIZATION SYSTEM MARKET SIZE ESTIMATES & FORECAST,
    142. BY END-USER INDUSTRY, 2019-2032 (USD BILLIONS)
    143. & VISUALIZATION SYSTEM MARKET SIZE ESTIMATES & FORECAST, BY VISUALIZATION
    144. TOOLS, 2019-2032 (USD BILLIONS)
    145. SYSTEM MARKET SIZE ESTIMATES & FORECAST, BY REGIONAL, 2019-2032 (USD BILLIONS)
    146. & FORECAST, BY PRODUCT TYPE, 2019-2032 (USD BILLIONS)
    147. FLUID MANAGEMENT & VISUALIZATION SYSTEM MARKET SIZE ESTIMATES & FORECAST,
    148. BY APPLICATION, 2019-2032 (USD BILLIONS)
    149. & VISUALIZATION SYSTEM MARKET SIZE ESTIMATES & FORECAST, BY DEPLOYMENT TYPE,
    150. 2032 (USD BILLIONS)
    151. SYSTEM MARKET SIZE ESTIMATES & FORECAST, BY END-USER INDUSTRY, 2019-2032 (USD
    152. BILLIONS)
    153. SIZE ESTIMATES & FORECAST, BY VISUALIZATION TOOLS, 2019-2032 (USD BILLIONS)
    154. & FORECAST, BY REGIONAL, 2019-2032 (USD BILLIONS)
    155. FLUID MANAGEMENT & VISUALIZATION SYSTEM MARKET SIZE ESTIMATES & FORECAST,
    156. BY PRODUCT TYPE, 2019-2032 (USD BILLIONS)
    157. & VISUALIZATION SYSTEM MARKET SIZE ESTIMATES & FORECAST, BY APPLICATION,
    158. 2032 (USD BILLIONS)
    159. SYSTEM MARKET SIZE ESTIMATES & FORECAST, BY DEPLOYMENT TYPE, 2019-2032 (USD
    160. BILLIONS)
    161. MARKET SIZE ESTIMATES & FORECAST, BY END-USER INDUSTRY, 2019-2032 (USD BILLIONS)
    162. SIZE ESTIMATES & FORECAST, BY VISUALIZATION TOOLS, 2019-2032 (USD BILLIONS)
    163. SIZE ESTIMATES & FORECAST, BY REGIONAL, 2019-2032 (USD BILLIONS)
    164. APAC FLUID MANAGEMENT & VISUALIZATION SYSTEM MARKET SIZE ESTIMATES &
    165. FORECAST, BY PRODUCT TYPE, 2019-2032 (USD BILLIONS)
    166. & VISUALIZATION SYSTEM MARKET SIZE ESTIMATES & FORECAST, BY APPLICATION,
    167. 2032 (USD BILLIONS)
    168. SYSTEM MARKET SIZE ESTIMATES & FORECAST, BY DEPLOYMENT TYPE, 2019-2032 (USD
    169. BILLIONS)
    170. SIZE ESTIMATES & FORECAST, BY END-USER INDUSTRY, 2019-2032 (USD BILLIONS)
    171. & FORECAST, BY VISUALIZATION TOOLS, 2019-2032 (USD BILLIONS)
    172. APAC FLUID MANAGEMENT & VISUALIZATION SYSTEM MARKET SIZE ESTIMATES & FORECAST,
    173. BY REGIONAL, 2019-2032 (USD BILLIONS)
    174. VISUALIZATION SYSTEM MARKET SIZE ESTIMATES & FORECAST, BY PRODUCT TYPE, 2019-2032
    175. (USD BILLIONS)
    176. MARKET SIZE ESTIMATES & FORECAST, BY APPLICATION, 2019-2032 (USD BILLIONS)
    177. & FORECAST, BY DEPLOYMENT TYPE, 2019-2032 (USD BILLIONS)
    178. FLUID MANAGEMENT & VISUALIZATION SYSTEM MARKET SIZE ESTIMATES & FORECAST,
    179. BY END-USER INDUSTRY, 2019-2032 (USD BILLIONS)
    180. & VISUALIZATION SYSTEM MARKET SIZE ESTIMATES & FORECAST, BY VISUALIZATION
    181. TOOLS, 2019-2032 (USD BILLIONS)
    182. SYSTEM MARKET SIZE ESTIMATES & FORECAST, BY REGIONAL, 2019-2032 (USD BILLIONS)
    183. & FORECAST, BY PRODUCT TYPE, 2019-2032 (USD BILLIONS)
    184. FLUID MANAGEMENT & VISUALIZATION SYSTEM MARKET SIZE ESTIMATES & FORECAST,
    185. BY APPLICATION, 2019-2032 (USD BILLIONS)
    186. & VISUALIZATION SYSTEM MARKET SIZE ESTIMATES & FORECAST, BY DEPLOYMENT TYPE,
    187. 2032 (USD BILLIONS)
    188. SYSTEM MARKET SIZE ESTIMATES & FORECAST, BY END-USER INDUSTRY, 2019-2032 (USD
    189. BILLIONS)
    190. SIZE ESTIMATES & FORECAST, BY VISUALIZATION TOOLS, 2019-2032 (USD BILLIONS)
    191. & FORECAST, BY REGIONAL, 2019-2032 (USD BILLIONS)
    192. MANAGEMENT & VISUALIZATION SYSTEM MARKET SIZE ESTIMATES & FORECAST, BY PRODUCT
    193. TYPE, 2019-2032 (USD BILLIONS)
    194. SYSTEM MARKET SIZE ESTIMATES & FORECAST, BY APPLICATION, 2019-2032 (USD BILLIONS)
    195. & FORECAST, BY DEPLOYMENT TYPE, 2019-2032 (USD BILLIONS)
    196. FLUID MANAGEMENT & VISUALIZATION SYSTEM MARKET SIZE ESTIMATES & FORECAST,
    197. BY END-USER INDUSTRY, 2019-2032 (USD BILLIONS)
    198. & VISUALIZATION SYSTEM MARKET SIZE ESTIMATES & FORECAST, BY VISUALIZATION
    199. TOOLS, 2019-2032 (USD BILLIONS)
    200. SYSTEM MARKET SIZE ESTIMATES & FORECAST, BY REGIONAL, 2019-2032 (USD BILLIONS)
    201. ESTIMATES & FORECAST, BY PRODUCT TYPE, 2019-2032 (USD BILLIONS)
    202. SOUTH KOREA FLUID MANAGEMENT & VISUALIZATION SYSTEM MARKET SIZE ESTIMATES
    203. & FORECAST, BY APPLICATION, 2019-2032 (USD BILLIONS)
    204. FLUID MANAGEMENT & VISUALIZATION SYSTEM MARKET SIZE ESTIMATES & FORECAST,
    205. BY DEPLOYMENT TYPE, 2019-2032 (USD BILLIONS)
    206. & VISUALIZATION SYSTEM MARKET SIZE ESTIMATES & FORECAST, BY END-USER INDUSTRY,
    207. 2032 (USD BILLIONS)
    208. SYSTEM MARKET SIZE ESTIMATES & FORECAST, BY VISUALIZATION TOOLS, 2019-2032 (USD
    209. BILLIONS)
    210. MARKET SIZE ESTIMATES & FORECAST, BY REGIONAL, 2019-2032 (USD BILLIONS)
    211. & FORECAST, BY PRODUCT TYPE, 2019-2032 (USD BILLIONS)
    212. FLUID MANAGEMENT & VISUALIZATION SYSTEM MARKET SIZE ESTIMATES & FORECAST,
    213. BY APPLICATION, 2019-2032 (USD BILLIONS)
    214. & VISUALIZATION SYSTEM MARKET SIZE ESTIMATES & FORECAST, BY DEPLOYMENT TYPE,
    215. 2032 (USD BILLIONS)
    216. SYSTEM MARKET SIZE ESTIMATES & FORECAST, BY END-USER INDUSTRY, 2019-2032 (USD
    217. BILLIONS)
    218. MARKET SIZE ESTIMATES & FORECAST, BY VISUALIZATION TOOLS, 2019-2032 (USD BILLIONS)
    219. ESTIMATES & FORECAST, BY REGIONAL, 2019-2032 (USD BILLIONS)
    220. THAILAND FLUID MANAGEMENT & VISUALIZATION SYSTEM MARKET SIZE ESTIMATES &
    221. FORECAST, BY PRODUCT TYPE, 2019-2032 (USD BILLIONS)
    222. MANAGEMENT & VISUALIZATION SYSTEM MARKET SIZE ESTIMATES & FORECAST, BY APPLICATION,
    223. 2032 (USD BILLIONS)
    224. SYSTEM MARKET SIZE ESTIMATES & FORECAST, BY DEPLOYMENT TYPE, 2019-2032 (USD
    225. BILLIONS)
    226. MARKET SIZE ESTIMATES & FORECAST, BY END-USER INDUSTRY, 2019-2032 (USD BILLIONS)
    227. ESTIMATES & FORECAST, BY VISUALIZATION TOOLS, 2019-2032 (USD BILLIONS)
    228. THAILAND FLUID MANAGEMENT & VISUALIZATION SYSTEM MARKET SIZE ESTIMATES
    229. & FORECAST, BY REGIONAL, 2019-2032 (USD BILLIONS)
    230. FLUID MANAGEMENT & VISUALIZATION SYSTEM MARKET SIZE ESTIMATES & FORECAST,
    231. BY PRODUCT TYPE, 2019-2032 (USD BILLIONS)
    232. & VISUALIZATION SYSTEM MARKET SIZE ESTIMATES & FORECAST, BY APPLICATION,
    233. 2032 (USD BILLIONS)
    234. SYSTEM MARKET SIZE ESTIMATES & FORECAST, BY DEPLOYMENT TYPE, 2019-2032 (USD
    235. BILLIONS)
    236. MARKET SIZE ESTIMATES & FORECAST, BY END-USER INDUSTRY, 2019-2032 (USD BILLIONS)
    237. ESTIMATES & FORECAST, BY VISUALIZATION TOOLS, 2019-2032 (USD BILLIONS)
    238. INDONESIA FLUID MANAGEMENT & VISUALIZATION SYSTEM MARKET SIZE ESTIMATES
    239. & FORECAST, BY REGIONAL, 2019-2032 (USD BILLIONS)
    240. FLUID MANAGEMENT & VISUALIZATION SYSTEM MARKET SIZE ESTIMATES & FORECAST,
    241. BY PRODUCT TYPE, 2019-2032 (USD BILLIONS)
    242. & VISUALIZATION SYSTEM MARKET SIZE ESTIMATES & FORECAST, BY APPLICATION,
    243. 2032 (USD BILLIONS)
    244. SYSTEM MARKET SIZE ESTIMATES & FORECAST, BY DEPLOYMENT TYPE, 2019-2032 (USD
    245. BILLIONS)
    246. MARKET SIZE ESTIMATES & FORECAST, BY END-USER INDUSTRY, 2019-2032 (USD BILLIONS)
    247. SIZE ESTIMATES & FORECAST, BY VISUALIZATION TOOLS, 2019-2032 (USD BILLIONS)
    248. SIZE ESTIMATES & FORECAST, BY REGIONAL, 2019-2032 (USD BILLIONS)
    249. SOUTH AMERICA FLUID MANAGEMENT & VISUALIZATION SYSTEM MARKET SIZE ESTIMATES
    250. & FORECAST, BY PRODUCT TYPE, 2019-2032 (USD BILLIONS)
    251. AMERICA FLUID MANAGEMENT & VISUALIZATION SYSTEM MARKET SIZE ESTIMATES &
    252. FORECAST, BY APPLICATION, 2019-2032 (USD BILLIONS)
    253. FLUID MANAGEMENT & VISUALIZATION SYSTEM MARKET SIZE ESTIMATES & FORECAST,
    254. BY DEPLOYMENT TYPE, 2019-2032 (USD BILLIONS)
    255. MANAGEMENT & VISUALIZATION SYSTEM MARKET SIZE ESTIMATES & FORECAST, BY END-USER
    256. INDUSTRY, 2019-2032 (USD BILLIONS)
    257. & VISUALIZATION SYSTEM MARKET SIZE ESTIMATES & FORECAST, BY VISUALIZATION
    258. TOOLS, 2019-2032 (USD BILLIONS)
    259. & VISUALIZATION SYSTEM MARKET SIZE ESTIMATES & FORECAST, BY REGIONAL, 2019-2032
    260. (USD BILLIONS)
    261. MARKET SIZE ESTIMATES & FORECAST, BY PRODUCT TYPE, 2019-2032 (USD BILLIONS)
    262. ESTIMATES & FORECAST, BY APPLICATION, 2019-2032 (USD BILLIONS)
    263. BRAZIL FLUID MANAGEMENT & VISUALIZATION SYSTEM MARKET SIZE ESTIMATES & FORECAST,
    264. BY DEPLOYMENT TYPE, 2019-2032 (USD BILLIONS)
    265. & VISUALIZATION SYSTEM MARKET SIZE ESTIMATES & FORECAST, BY END-USER INDUSTRY,
    266. 2032 (USD BILLIONS)
    267. SYSTEM MARKET SIZE ESTIMATES & FORECAST, BY VISUALIZATION TOOLS, 2019-2032 (USD
    268. BILLIONS)
    269. SIZE ESTIMATES & FORECAST, BY REGIONAL, 2019-2032 (USD BILLIONS)
    270. MEXICO FLUID MANAGEMENT & VISUALIZATION SYSTEM MARKET SIZE ESTIMATES &
    271. FORECAST, BY PRODUCT TYPE, 2019-2032 (USD BILLIONS)
    272. MANAGEMENT & VISUALIZATION SYSTEM MARKET SIZE ESTIMATES & FORECAST, BY APPLICATION,
    273. 2032 (USD BILLIONS)
    274. SYSTEM MARKET SIZE ESTIMATES & FORECAST, BY DEPLOYMENT TYPE, 2019-2032 (USD
    275. BILLIONS)
    276. SIZE ESTIMATES & FORECAST, BY END-USER INDUSTRY, 2019-2032 (USD BILLIONS)
    277. & FORECAST, BY VISUALIZATION TOOLS, 2019-2032 (USD BILLIONS)
    278. MEXICO FLUID MANAGEMENT & VISUALIZATION SYSTEM MARKET SIZE ESTIMATES & FORECAST,
    279. BY REGIONAL, 2019-2032 (USD BILLIONS)
    280. & VISUALIZATION SYSTEM MARKET SIZE ESTIMATES & FORECAST, BY PRODUCT TYPE,
    281. 2032 (USD BILLIONS)
    282. SYSTEM MARKET SIZE ESTIMATES & FORECAST, BY APPLICATION, 2019-2032 (USD BILLIONS)
    283. ESTIMATES & FORECAST, BY DEPLOYMENT TYPE, 2019-2032 (USD BILLIONS)
    284. ARGENTINA FLUID MANAGEMENT & VISUALIZATION SYSTEM MARKET SIZE ESTIMATES
    285. & FORECAST, BY END-USER INDUSTRY, 2019-2032 (USD BILLIONS)
    286. ARGENTINA FLUID MANAGEMENT & VISUALIZATION SYSTEM MARKET SIZE ESTIMATES &
    287. FORECAST, BY VISUALIZATION TOOLS, 2019-2032 (USD BILLIONS)
    288. FLUID MANAGEMENT & VISUALIZATION SYSTEM MARKET SIZE ESTIMATES & FORECAST,
    289. BY REGIONAL, 2019-2032 (USD BILLIONS)
    290. MANAGEMENT & VISUALIZATION SYSTEM MARKET SIZE ESTIMATES & FORECAST, BY PRODUCT
    291. TYPE, 2019-2032 (USD BILLIONS)
    292. & VISUALIZATION SYSTEM MARKET SIZE ESTIMATES & FORECAST, BY APPLICATION,
    293. 2032 (USD BILLIONS)
    294. & VISUALIZATION SYSTEM MARKET SIZE ESTIMATES & FORECAST, BY DEPLOYMENT TYPE,
    295. 2032 (USD BILLIONS)
    296. & VISUALIZATION SYSTEM MARKET SIZE ESTIMATES & FORECAST, BY END-USER INDUSTRY,
    297. 2032 (USD BILLIONS)
    298. & VISUALIZATION SYSTEM MARKET SIZE ESTIMATES & FORECAST, BY VISUALIZATION
    299. TOOLS, 2019-2032 (USD BILLIONS)
    300. & VISUALIZATION SYSTEM MARKET SIZE ESTIMATES & FORECAST, BY REGIONAL, 2019-2032
    301. (USD BILLIONS)
    302. MARKET SIZE ESTIMATES & FORECAST, BY PRODUCT TYPE, 2019-2032 (USD BILLIONS)
    303. & FORECAST, BY APPLICATION, 2019-2032 (USD BILLIONS)
    304. MANAGEMENT & VISUALIZATION SYSTEM MARKET SIZE ESTIMATES & FORECAST, BY DEPLOYMENT
    305. TYPE, 2019-2032 (USD BILLIONS)
    306. SYSTEM MARKET SIZE ESTIMATES & FORECAST, BY END-USER INDUSTRY, 2019-2032 (USD
    307. BILLIONS)
    308. SIZE ESTIMATES & FORECAST, BY VISUALIZATION TOOLS, 2019-2032 (USD BILLIONS)
    309. & FORECAST, BY REGIONAL, 2019-2032 (USD BILLIONS)
    310. FLUID MANAGEMENT & VISUALIZATION SYSTEM MARKET SIZE ESTIMATES & FORECAST,
    311. BY PRODUCT TYPE, 2019-2032 (USD BILLIONS)
    312. & VISUALIZATION SYSTEM MARKET SIZE ESTIMATES & FORECAST, BY APPLICATION,
    313. 2032 (USD BILLIONS)
    314. SYSTEM MARKET SIZE ESTIMATES & FORECAST, BY DEPLOYMENT TYPE, 2019-2032 (USD
    315. BILLIONS)
    316. MARKET SIZE ESTIMATES & FORECAST, BY END-USER INDUSTRY, 2019-2032 (USD BILLIONS)
    317. SIZE ESTIMATES & FORECAST, BY VISUALIZATION TOOLS, 2019-2032 (USD BILLIONS)
    318. SIZE ESTIMATES & FORECAST, BY REGIONAL, 2019-2032 (USD BILLIONS)
    319. SOUTH AFRICA FLUID MANAGEMENT & VISUALIZATION SYSTEM MARKET SIZE ESTIMATES
    320. & FORECAST, BY PRODUCT TYPE, 2019-2032 (USD BILLIONS)
    321. AFRICA FLUID MANAGEMENT & VISUALIZATION SYSTEM MARKET SIZE ESTIMATES & FORECAST,
    322. BY APPLICATION, 2019-2032 (USD BILLIONS)
    323. & VISUALIZATION SYSTEM MARKET SIZE ESTIMATES & FORECAST, BY DEPLOYMENT TYPE,
    324. 2032 (USD BILLIONS)
    325. SYSTEM MARKET SIZE ESTIMATES & FORECAST, BY END-USER INDUSTRY, 2019-2032 (USD
    326. BILLIONS)
    327. MARKET SIZE ESTIMATES & FORECAST, BY VISUALIZATION TOOLS, 2019-2032 (USD BILLIONS)
    328. SIZE ESTIMATES & FORECAST, BY REGIONAL, 2019-2032 (USD BILLIONS)
    329. REST OF MEA FLUID MANAGEMENT & VISUALIZATION SYSTEM MARKET SIZE ESTIMATES
    330. & FORECAST, BY PRODUCT TYPE, 2019-2032 (USD BILLIONS)
    331. OF MEA FLUID MANAGEMENT & VISUALIZATION SYSTEM MARKET SIZE ESTIMATES & FORECAST,
    332. BY APPLICATION, 2019-2032 (USD BILLIONS)
    333. & VISUALIZATION SYSTEM MARKET SIZE ESTIMATES & FORECAST, BY DEPLOYMENT TYPE,
    334. 2032 (USD BILLIONS)
    335. SYSTEM MARKET SIZE ESTIMATES & FORECAST, BY END-USER INDUSTRY, 2019-2032 (USD
    336. BILLIONS)
    337. MARKET SIZE ESTIMATES & FORECAST, BY VISUALIZATION TOOLS, 2019-2032 (USD BILLIONS)
    338. SIZE ESTIMATES & FORECAST, BY REGIONAL, 2019-2032 (USD BILLIONS)
    339. PRODUCT LAUNCH/PRODUCT DEVELOPMENT/APPROVAL
    340. NORTH AMERICA FLUID MANAGEMENT & VISUALIZATION SYSTEM MARKET ANALYSIS
    341. TYPE
    342. BY APPLICATION
    343. ANALYSIS BY DEPLOYMENT TYPE
    344. SYSTEM MARKET ANALYSIS BY END-USER INDUSTRY
    345. & VISUALIZATION SYSTEM MARKET ANALYSIS BY VISUALIZATION TOOLS
    346. US FLUID MANAGEMENT & VISUALIZATION SYSTEM MARKET ANALYSIS BY REGIONAL
    347. CANADA FLUID MANAGEMENT & VISUALIZATION SYSTEM MARKET ANALYSIS BY PRODUCT
    348. TYPE
    349. ANALYSIS BY APPLICATION
    350. SYSTEM MARKET ANALYSIS BY DEPLOYMENT TYPE
    351. & VISUALIZATION SYSTEM MARKET ANALYSIS BY END-USER INDUSTRY
    352. CANADA FLUID MANAGEMENT & VISUALIZATION SYSTEM MARKET ANALYSIS BY VISUALIZATION
    353. TOOLS
    354. ANALYSIS BY REGIONAL
    355. SYSTEM MARKET ANALYSIS
    356. SYSTEM MARKET ANALYSIS BY PRODUCT TYPE
    357. & VISUALIZATION SYSTEM MARKET ANALYSIS BY APPLICATION
    358. FLUID MANAGEMENT & VISUALIZATION SYSTEM MARKET ANALYSIS BY DEPLOYMENT TYPE
    359. BY END-USER INDUSTRY
    360. SYSTEM MARKET ANALYSIS BY VISUALIZATION TOOLS
    361. & VISUALIZATION SYSTEM MARKET ANALYSIS BY REGIONAL
    362. MANAGEMENT & VISUALIZATION SYSTEM MARKET ANALYSIS BY PRODUCT TYPE
    363. UK FLUID MANAGEMENT & VISUALIZATION SYSTEM MARKET ANALYSIS BY APPLICATION
    364. BY DEPLOYMENT TYPE
    365. MARKET ANALYSIS BY END-USER INDUSTRY
    366. VISUALIZATION SYSTEM MARKET ANALYSIS BY VISUALIZATION TOOLS
    367. FLUID MANAGEMENT & VISUALIZATION SYSTEM MARKET ANALYSIS BY REGIONAL
    368. FRANCE FLUID MANAGEMENT & VISUALIZATION SYSTEM MARKET ANALYSIS BY PRODUCT
    369. TYPE
    370. ANALYSIS BY APPLICATION
    371. SYSTEM MARKET ANALYSIS BY DEPLOYMENT TYPE
    372. & VISUALIZATION SYSTEM MARKET ANALYSIS BY END-USER INDUSTRY
    373. FRANCE FLUID MANAGEMENT & VISUALIZATION SYSTEM MARKET ANALYSIS BY VISUALIZATION
    374. TOOLS
    375. ANALYSIS BY REGIONAL
    376. SYSTEM MARKET ANALYSIS BY PRODUCT TYPE
    377. & VISUALIZATION SYSTEM MARKET ANALYSIS BY APPLICATION
    378. FLUID MANAGEMENT & VISUALIZATION SYSTEM MARKET ANALYSIS BY DEPLOYMENT TYPE
    379. BY END-USER INDUSTRY
    380. SYSTEM MARKET ANALYSIS BY VISUALIZATION TOOLS
    381. & VISUALIZATION SYSTEM MARKET ANALYSIS BY REGIONAL
    382. MANAGEMENT & VISUALIZATION SYSTEM MARKET ANALYSIS BY PRODUCT TYPE
    383. ITALY FLUID MANAGEMENT & VISUALIZATION SYSTEM MARKET ANALYSIS BY APPLICATION
    384. BY DEPLOYMENT TYPE
    385. MARKET ANALYSIS BY END-USER INDUSTRY
    386. VISUALIZATION SYSTEM MARKET ANALYSIS BY VISUALIZATION TOOLS
    387. FLUID MANAGEMENT & VISUALIZATION SYSTEM MARKET ANALYSIS BY REGIONAL
    388. SPAIN FLUID MANAGEMENT & VISUALIZATION SYSTEM MARKET ANALYSIS BY PRODUCT
    389. TYPE
    390. BY APPLICATION
    391. MARKET ANALYSIS BY DEPLOYMENT TYPE
    392. VISUALIZATION SYSTEM MARKET ANALYSIS BY END-USER INDUSTRY
    393. FLUID MANAGEMENT & VISUALIZATION SYSTEM MARKET ANALYSIS BY VISUALIZATION TOOLS
    394. BY REGIONAL
    395. SYSTEM MARKET ANALYSIS BY PRODUCT TYPE
    396. & VISUALIZATION SYSTEM MARKET ANALYSIS BY APPLICATION
    397. OF EUROPE FLUID MANAGEMENT & VISUALIZATION SYSTEM MARKET ANALYSIS BY DEPLOYMENT
    398. TYPE
    399. MARKET ANALYSIS BY END-USER INDUSTRY
    400. & VISUALIZATION SYSTEM MARKET ANALYSIS BY VISUALIZATION TOOLS
    401. REST OF EUROPE FLUID MANAGEMENT & VISUALIZATION SYSTEM MARKET ANALYSIS BY REGIONAL
    402. BY PRODUCT TYPE
    403. MARKET ANALYSIS BY APPLICATION
    404. SYSTEM MARKET ANALYSIS BY DEPLOYMENT TYPE
    405. & VISUALIZATION SYSTEM MARKET ANALYSIS BY END-USER INDUSTRY
    406. CHINA FLUID MANAGEMENT & VISUALIZATION SYSTEM MARKET ANALYSIS BY VISUALIZATION
    407. TOOLS
    408. ANALYSIS BY REGIONAL
    409. SYSTEM MARKET ANALYSIS BY PRODUCT TYPE
    410. VISUALIZATION SYSTEM MARKET ANALYSIS BY APPLICATION
    411. MANAGEMENT & VISUALIZATION SYSTEM MARKET ANALYSIS BY DEPLOYMENT TYPE
    412. INDIA FLUID MANAGEMENT & VISUALIZATION SYSTEM MARKET ANALYSIS BY END-USER
    413. INDUSTRY
    414. ANALYSIS BY VISUALIZATION TOOLS
    415. SYSTEM MARKET ANALYSIS BY REGIONAL
    416. VISUALIZATION SYSTEM MARKET ANALYSIS BY PRODUCT TYPE
    417. MANAGEMENT & VISUALIZATION SYSTEM MARKET ANALYSIS BY APPLICATION
    418. JAPAN FLUID MANAGEMENT & VISUALIZATION SYSTEM MARKET ANALYSIS BY DEPLOYMENT
    419. TYPE
    420. BY END-USER INDUSTRY
    421. SYSTEM MARKET ANALYSIS BY VISUALIZATION TOOLS
    422. & VISUALIZATION SYSTEM MARKET ANALYSIS BY REGIONAL
    423. FLUID MANAGEMENT & VISUALIZATION SYSTEM MARKET ANALYSIS BY PRODUCT TYPE
    424. BY APPLICATION
    425. SYSTEM MARKET ANALYSIS BY DEPLOYMENT TYPE
    426. & VISUALIZATION SYSTEM MARKET ANALYSIS BY END-USER INDUSTRY
    427. SOUTH KOREA FLUID MANAGEMENT & VISUALIZATION SYSTEM MARKET ANALYSIS BY VISUALIZATION
    428. TOOLS
    429. ANALYSIS BY REGIONAL
    430. SYSTEM MARKET ANALYSIS BY PRODUCT TYPE
    431. & VISUALIZATION SYSTEM MARKET ANALYSIS BY APPLICATION
    432. FLUID MANAGEMENT & VISUALIZATION SYSTEM MARKET ANALYSIS BY DEPLOYMENT TYPE
    433. BY END-USER INDUSTRY
    434. SYSTEM MARKET ANALYSIS BY VISUALIZATION TOOLS
    435. & VISUALIZATION SYSTEM MARKET ANALYSIS BY REGIONAL
    436. FLUID MANAGEMENT & VISUALIZATION SYSTEM MARKET ANALYSIS BY PRODUCT TYPE
    437. BY APPLICATION
    438. MARKET ANALYSIS BY DEPLOYMENT TYPE
    439. VISUALIZATION SYSTEM MARKET ANALYSIS BY END-USER INDUSTRY
    440. FLUID MANAGEMENT & VISUALIZATION SYSTEM MARKET ANALYSIS BY VISUALIZATION TOOLS
    441. BY REGIONAL
    442. MARKET ANALYSIS BY PRODUCT TYPE
    443. VISUALIZATION SYSTEM MARKET ANALYSIS BY APPLICATION
    444. MANAGEMENT & VISUALIZATION SYSTEM MARKET ANALYSIS BY DEPLOYMENT TYPE
    445. INDONESIA FLUID MANAGEMENT & VISUALIZATION SYSTEM MARKET ANALYSIS BY END-USER
    446. INDUSTRY
    447. MARKET ANALYSIS BY VISUALIZATION TOOLS
    448. & VISUALIZATION SYSTEM MARKET ANALYSIS BY REGIONAL
    449. APAC FLUID MANAGEMENT & VISUALIZATION SYSTEM MARKET ANALYSIS BY PRODUCT TYPE
    450. ANALYSIS BY APPLICATION
    451. SYSTEM MARKET ANALYSIS BY DEPLOYMENT TYPE
    452. & VISUALIZATION SYSTEM MARKET ANALYSIS BY END-USER INDUSTRY
    453. REST OF APAC FLUID MANAGEMENT & VISUALIZATION SYSTEM MARKET ANALYSIS BY VISUALIZATION
    454. TOOLS
    455. MARKET ANALYSIS BY REGIONAL
    456. VISUALIZATION SYSTEM MARKET ANALYSIS
    457. VISUALIZATION SYSTEM MARKET ANALYSIS BY PRODUCT TYPE
    458. MANAGEMENT & VISUALIZATION SYSTEM MARKET ANALYSIS BY APPLICATION
    459. BRAZIL FLUID MANAGEMENT & VISUALIZATION SYSTEM MARKET ANALYSIS BY DEPLOYMENT
    460. TYPE
    461. ANALYSIS BY END-USER INDUSTRY
    462. SYSTEM MARKET ANALYSIS BY VISUALIZATION TOOLS
    463. & VISUALIZATION SYSTEM MARKET ANALYSIS BY REGIONAL
    464. FLUID MANAGEMENT & VISUALIZATION SYSTEM MARKET ANALYSIS BY PRODUCT TYPE
    465. BY APPLICATION
    466. MARKET ANALYSIS BY DEPLOYMENT TYPE
    467. VISUALIZATION SYSTEM MARKET ANALYSIS BY END-USER INDUSTRY
    468. FLUID MANAGEMENT & VISUALIZATION SYSTEM MARKET ANALYSIS BY VISUALIZATION TOOLS
    469. BY REGIONAL
    470. MARKET ANALYSIS BY PRODUCT TYPE
    471. VISUALIZATION SYSTEM MARKET ANALYSIS BY APPLICATION
    472. FLUID MANAGEMENT & VISUALIZATION SYSTEM MARKET ANALYSIS BY DEPLOYMENT TYPE
    473. BY END-USER INDUSTRY
    474. SYSTEM MARKET ANALYSIS BY VISUALIZATION TOOLS
    475. MANAGEMENT & VISUALIZATION SYSTEM MARKET ANALYSIS BY REGIONAL
    476. REST OF SOUTH AMERICA FLUID MANAGEMENT & VISUALIZATION SYSTEM MARKET ANALYSIS
    477. BY PRODUCT TYPE
    478. SYSTEM MARKET ANALYSIS BY APPLICATION
    479. MANAGEMENT & VISUALIZATION SYSTEM MARKET ANALYSIS BY DEPLOYMENT TYPE
    480. REST OF SOUTH AMERICA FLUID MANAGEMENT & VISUALIZATION SYSTEM MARKET ANALYSIS
    481. BY END-USER INDUSTRY
    482. VISUALIZATION SYSTEM MARKET ANALYSIS BY VISUALIZATION TOOLS
    483. OF SOUTH AMERICA FLUID MANAGEMENT & VISUALIZATION SYSTEM MARKET ANALYSIS BY
    484. REGIONAL
    485. ANALYSIS
    486. MARKET ANALYSIS BY PRODUCT TYPE
    487. & VISUALIZATION SYSTEM MARKET ANALYSIS BY APPLICATION
    488. COUNTRIES FLUID MANAGEMENT & VISUALIZATION SYSTEM MARKET ANALYSIS BY DEPLOYMENT
    489. TYPE
    490. MARKET ANALYSIS BY END-USER INDUSTRY
    491. & VISUALIZATION SYSTEM MARKET ANALYSIS BY VISUALIZATION TOOLS
    492. GCC COUNTRIES FLUID MANAGEMENT & VISUALIZATION SYSTEM MARKET ANALYSIS BY REGIONAL
    493. ANALYSIS BY PRODUCT TYPE
    494. SYSTEM MARKET ANALYSIS BY APPLICATION
    495. & VISUALIZATION SYSTEM MARKET ANALYSIS BY DEPLOYMENT TYPE
    496. SOUTH AFRICA FLUID MANAGEMENT & VISUALIZATION SYSTEM MARKET ANALYSIS BY END-USER
    497. INDUSTRY
    498. MARKET ANALYSIS BY VISUALIZATION TOOLS
    499. & VISUALIZATION SYSTEM MARKET ANALYSIS BY REGIONAL
    500. MEA FLUID MANAGEMENT & VISUALIZATION SYSTEM MARKET ANALYSIS BY PRODUCT TYPE
    501. ANALYSIS BY APPLICATION
    502. SYSTEM MARKET ANALYSIS BY DEPLOYMENT TYPE
    503. & VISUALIZATION SYSTEM MARKET ANALYSIS BY END-USER INDUSTRY
    504. REST OF MEA FLUID MANAGEMENT & VISUALIZATION SYSTEM MARKET ANALYSIS BY VISUALIZATION
    505. TOOLS
    506. MARKET ANALYSIS BY REGIONAL
    507. & VISUALIZATION SYSTEM MARKET
    508. SYSTEM MARKET
    509. VISUALIZATION SYSTEM MARKET
    510. & VISUALIZATION SYSTEM MARKET
    511. SYSTEM MARKET, BY PRODUCT TYPE, 2024 (% SHARE)
    512. & VISUALIZATION SYSTEM MARKET, BY PRODUCT TYPE, 2019 TO 2032 (USD Billions)
    513. (% SHARE)
    514. BY APPLICATION, 2019 TO 2032 (USD Billions)
    515. VISUALIZATION SYSTEM MARKET, BY DEPLOYMENT TYPE, 2024 (% SHARE)
    516. FLUID MANAGEMENT & VISUALIZATION SYSTEM MARKET, BY DEPLOYMENT TYPE, 2019 TO
    517. (USD Billions)
    518. MARKET, BY END-USER INDUSTRY, 2024 (% SHARE)
    519. & VISUALIZATION SYSTEM MARKET, BY END-USER INDUSTRY, 2019 TO 2032 (USD Billions)
    520. TOOLS, 2024 (% SHARE)
    521. MARKET, BY VISUALIZATION TOOLS, 2019 TO 2032 (USD Billions)
    522. MANAGEMENT & VISUALIZATION SYSTEM MARKET, BY REGIONAL, 2024 (% SHARE)
    523. FLUID MANAGEMENT & VISUALIZATION SYSTEM MARKET, BY REGIONAL, 2019 TO 2032
    524. (USD Billions)

    Fluid Management  Visualization System  Market Segmentation


    • Fluid Management Visualization System Market By Product Type (USD Billion, 2019-2032)    
      • Software
      • Hardware
      • Services


    • Fluid Management Visualization System Market By Application (USD Billion, 2019-2032)    
      • Oil and Gas
      • Chemicals and Petrochemicals
      • Power Generation
      • Pharmaceuticals
      • Other Industrial Applications


    • Fluid Management Visualization System Market By Deployment Type (USD Billion, 2019-2032)    
      • On-Premises
      • Cloud-Based


    • Fluid Management Visualization System Market By End-User Industry (USD Billion, 2019-2032)    
      • Manufacturing
      • Energy
      • Healthcare
      • Government and Defense
      • Other End-User Industries


    • Fluid Management Visualization System Market By Visualization Tools (USD Billion, 2019-2032)    
      • Dashboards
      • Reports
      • Graphs
      • Charts
      • Maps


    • Fluid Management Visualization System Market By Regional (USD Billion, 2019-2032)    
      • North America
      • Europe
      • South America
      • Asia Pacific
      • Middle East and Africa


    Fluid Management  Visualization System Market Regional Outlook (USD Billion, 2019-2032)


    • North America Outlook (USD Billion, 2019-2032)
      • North America Fluid Management Visualization System Market by Product Type 
        • Software
        • Hardware
        • Services
      • North America Fluid Management Visualization System Market by Application Type 
        • Oil and Gas
        • Chemicals and Petrochemicals
        • Power Generation
        • Pharmaceuticals
        • Other Industrial Applications
      • North America Fluid Management Visualization System Market by Deployment Type 
        • On-Premises
        • Cloud-Based
      • North America Fluid Management Visualization System Market by End-User Industry Type 
        • Manufacturing
        • Energy
        • Healthcare
        • Government and Defense
        • Other End-User Industries
      • North America Fluid Management Visualization System Market by Visualization Tools Type 
        • Dashboards
        • Reports
        • Graphs
        • Charts
        • Maps
      • North America Fluid Management Visualization System Market by Regional Type 
        • US
        • Canada
      • US Outlook (USD Billion, 2019-2032)
      • US Fluid Management Visualization System Market by Product Type 
        • Software
        • Hardware
        • Services
      • US Fluid Management Visualization System Market by Application Type 
        • Oil and Gas
        • Chemicals and Petrochemicals
        • Power Generation
        • Pharmaceuticals
        • Other Industrial Applications
      • US Fluid Management Visualization System Market by Deployment Type 
        • On-Premises
        • Cloud-Based
      • US Fluid Management Visualization System Market by End-User Industry Type 
        • Manufacturing
        • Energy
        • Healthcare
        • Government and Defense
        • Other End-User Industries
      • US Fluid Management Visualization System Market by Visualization Tools Type 
        • Dashboards
        • Reports
        • Graphs
        • Charts
        • Maps
      • CANADA Outlook (USD Billion, 2019-2032)
      • CANADA Fluid Management Visualization System Market by Product Type 
        • Software
        • Hardware
        • Services
      • CANADA Fluid Management Visualization System Market by Application Type 
        • Oil and Gas
        • Chemicals and Petrochemicals
        • Power Generation
        • Pharmaceuticals
        • Other Industrial Applications
      • CANADA Fluid Management Visualization System Market by Deployment Type 
        • On-Premises
        • Cloud-Based
      • CANADA Fluid Management Visualization System Market by End-User Industry Type 
        • Manufacturing
        • Energy
        • Healthcare
        • Government and Defense
        • Other End-User Industries
      • CANADA Fluid Management Visualization System Market by Visualization Tools Type 
        • Dashboards
        • Reports
        • Graphs
        • Charts
        • Maps
      • Europe Outlook (USD Billion, 2019-2032)
        • Europe Fluid Management Visualization System Market by Product Type 
          • Software
          • Hardware
          • Services
        • Europe Fluid Management Visualization System Market by Application Type 
          • Oil and Gas
          • Chemicals and Petrochemicals
          • Power Generation
          • Pharmaceuticals
          • Other Industrial Applications
        • Europe Fluid Management Visualization System Market by Deployment Type 
          • On-Premises
          • Cloud-Based
        • Europe Fluid Management Visualization System Market by End-User Industry Type 
          • Manufacturing
          • Energy
          • Healthcare
          • Government and Defense
          • Other End-User Industries
        • Europe Fluid Management Visualization System Market by Visualization Tools Type 
          • Dashboards
          • Reports
          • Graphs
          • Charts
          • Maps
        • Europe Fluid Management Visualization System Market by Regional Type 
          • Germany
          • UK
          • France
          • Russia
          • Italy
          • Spain
          • Rest of Europe
        • GERMANY Outlook (USD Billion, 2019-2032)
        • GERMANY Fluid Management Visualization System Market by Product Type 
          • Software
          • Hardware
          • Services
        • GERMANY Fluid Management Visualization System Market by Application Type 
          • Oil and Gas
          • Chemicals and Petrochemicals
          • Power Generation
          • Pharmaceuticals
          • Other Industrial Applications
        • GERMANY Fluid Management Visualization System Market by Deployment Type 
          • On-Premises
          • Cloud-Based
        • GERMANY Fluid Management Visualization System Market by End-User Industry Type 
          • Manufacturing
          • Energy
          • Healthcare
          • Government and Defense
          • Other End-User Industries
        • GERMANY Fluid Management Visualization System Market by Visualization Tools Type 
          • Dashboards
          • Reports
          • Graphs
          • Charts
          • Maps
        • UK Outlook (USD Billion, 2019-2032)
        • UK Fluid Management Visualization System Market by Product Type 
          • Software
          • Hardware
          • Services
        • UK Fluid Management Visualization System Market by Application Type 
          • Oil and Gas
          • Chemicals and Petrochemicals
          • Power Generation
          • Pharmaceuticals
          • Other Industrial Applications
        • UK Fluid Management Visualization System Market by Deployment Type 
          • On-Premises
          • Cloud-Based
        • UK Fluid Management Visualization System Market by End-User Industry Type 
          • Manufacturing
          • Energy
          • Healthcare
          • Government and Defense
          • Other End-User Industries
        • UK Fluid Management Visualization System Market by Visualization Tools Type 
          • Dashboards
          • Reports
          • Graphs
          • Charts
          • Maps
        • FRANCE Outlook (USD Billion, 2019-2032)
        • FRANCE Fluid Management Visualization System Market by Product Type 
          • Software
          • Hardware
          • Services
        • FRANCE Fluid Management Visualization System Market by Application Type 
          • Oil and Gas
          • Chemicals and Petrochemicals
          • Power Generation
          • Pharmaceuticals
          • Other Industrial Applications
        • FRANCE Fluid Management Visualization System Market by Deployment Type 
          • On-Premises
          • Cloud-Based
        • FRANCE Fluid Management Visualization System Market by End-User Industry Type 
          • Manufacturing
          • Energy
          • Healthcare
          • Government and Defense
          • Other End-User Industries
        • FRANCE Fluid Management Visualization System Market by Visualization Tools Type 
          • Dashboards
          • Reports
          • Graphs
          • Charts
          • Maps
        • RUSSIA Outlook (USD Billion, 2019-2032)
        • RUSSIA Fluid Management Visualization System Market by Product Type 
          • Software
          • Hardware
          • Services
        • RUSSIA Fluid Management Visualization System Market by Application Type 
          • Oil and Gas
          • Chemicals and Petrochemicals
          • Power Generation
          • Pharmaceuticals
          • Other Industrial Applications
        • RUSSIA Fluid Management Visualization System Market by Deployment Type 
          • On-Premises
          • Cloud-Based
        • RUSSIA Fluid Management Visualization System Market by End-User Industry Type 
          • Manufacturing
          • Energy
          • Healthcare
          • Government and Defense
          • Other End-User Industries
        • RUSSIA Fluid Management Visualization System Market by Visualization Tools Type 
          • Dashboards
          • Reports
          • Graphs
          • Charts
          • Maps
        • ITALY Outlook (USD Billion, 2019-2032)
        • ITALY Fluid Management Visualization System Market by Product Type 
          • Software
          • Hardware
          • Services
        • ITALY Fluid Management Visualization System Market by Application Type 
          • Oil and Gas
          • Chemicals and Petrochemicals
          • Power Generation
          • Pharmaceuticals
          • Other Industrial Applications
        • ITALY Fluid Management Visualization System Market by Deployment Type 
          • On-Premises
          • Cloud-Based
        • ITALY Fluid Management Visualization System Market by End-User Industry Type 
          • Manufacturing
          • Energy
          • Healthcare
          • Government and Defense
          • Other End-User Industries
        • ITALY Fluid Management Visualization System Market by Visualization Tools Type 
          • Dashboards
          • Reports
          • Graphs
          • Charts
          • Maps
        • SPAIN Outlook (USD Billion, 2019-2032)
        • SPAIN Fluid Management Visualization System Market by Product Type 
          • Software
          • Hardware
          • Services
        • SPAIN Fluid Management Visualization System Market by Application Type 
          • Oil and Gas
          • Chemicals and Petrochemicals
          • Power Generation
          • Pharmaceuticals
          • Other Industrial Applications
        • SPAIN Fluid Management Visualization System Market by Deployment Type 
          • On-Premises
          • Cloud-Based
        • SPAIN Fluid Management Visualization System Market by End-User Industry Type 
          • Manufacturing
          • Energy
          • Healthcare
          • Government and Defense
          • Other End-User Industries
        • SPAIN Fluid Management Visualization System Market by Visualization Tools Type 
          • Dashboards
          • Reports
          • Graphs
          • Charts
          • Maps
        • REST OF EUROPE Outlook (USD Billion, 2019-2032)
        • REST OF EUROPE Fluid Management Visualization System Market by Product Type 
          • Software
          • Hardware
          • Services
        • REST OF EUROPE Fluid Management Visualization System Market by Application Type 
          • Oil and Gas
          • Chemicals and Petrochemicals
          • Power Generation
          • Pharmaceuticals
          • Other Industrial Applications
        • REST OF EUROPE Fluid Management Visualization System Market by Deployment Type 
          • On-Premises
          • Cloud-Based
        • REST OF EUROPE Fluid Management Visualization System Market by End-User Industry Type 
          • Manufacturing
          • Energy
          • Healthcare
          • Government and Defense
          • Other End-User Industries
        • REST OF EUROPE Fluid Management Visualization System Market by Visualization Tools Type 
          • Dashboards
          • Reports
          • Graphs
          • Charts
          • Maps
        • APAC Outlook (USD Billion, 2019-2032)
          • APAC Fluid Management Visualization System Market by Product Type 
            • Software
            • Hardware
            • Services
          • APAC Fluid Management Visualization System Market by Application Type 
            • Oil and Gas
            • Chemicals and Petrochemicals
            • Power Generation
            • Pharmaceuticals
            • Other Industrial Applications
          • APAC Fluid Management Visualization System Market by Deployment Type 
            • On-Premises
            • Cloud-Based
          • APAC Fluid Management Visualization System Market by End-User Industry Type 
            • Manufacturing
            • Energy
            • Healthcare
            • Government and Defense
            • Other End-User Industries
          • APAC Fluid Management Visualization System Market by Visualization Tools Type 
            • Dashboards
            • Reports
            • Graphs
            • Charts
            • Maps
          • APAC Fluid Management Visualization System Market by Regional Type 
            • China
            • India
            • Japan
            • South Korea
            • Malaysia
            • Thailand
            • Indonesia
            • Rest of APAC
          • CHINA Outlook (USD Billion, 2019-2032)
          • CHINA Fluid Management Visualization System Market by Product Type 
            • Software
            • Hardware
            • Services
          • CHINA Fluid Management Visualization System Market by Application Type 
            • Oil and Gas
            • Chemicals and Petrochemicals
            • Power Generation
            • Pharmaceuticals
            • Other Industrial Applications
          • CHINA Fluid Management Visualization System Market by Deployment Type 
            • On-Premises
            • Cloud-Based
          • CHINA Fluid Management Visualization System Market by End-User Industry Type 
            • Manufacturing
            • Energy
            • Healthcare
            • Government and Defense
            • Other End-User Industries
          • CHINA Fluid Management Visualization System Market by Visualization Tools Type 
            • Dashboards
            • Reports
            • Graphs
            • Charts
            • Maps
          • INDIA Outlook (USD Billion, 2019-2032)
          • INDIA Fluid Management Visualization System Market by Product Type 
            • Software
            • Hardware
            • Services
          • INDIA Fluid Management Visualization System Market by Application Type 
            • Oil and Gas
            • Chemicals and Petrochemicals
            • Power Generation
            • Pharmaceuticals
            • Other Industrial Applications
          • INDIA Fluid Management Visualization System Market by Deployment Type 
            • On-Premises
            • Cloud-Based
          • INDIA Fluid Management Visualization System Market by End-User Industry Type 
            • Manufacturing
            • Energy
            • Healthcare
            • Government and Defense
            • Other End-User Industries
          • INDIA Fluid Management Visualization System Market by Visualization Tools Type 
            • Dashboards
            • Reports
            • Graphs
            • Charts
            • Maps
          • JAPAN Outlook (USD Billion, 2019-2032)
          • JAPAN Fluid Management Visualization System Market by Product Type 
            • Software
            • Hardware
            • Services
          • JAPAN Fluid Management Visualization System Market by Application Type 
            • Oil and Gas
            • Chemicals and Petrochemicals
            • Power Generation
            • Pharmaceuticals
            • Other Industrial Applications
          • JAPAN Fluid Management Visualization System Market by Deployment Type 
            • On-Premises
            • Cloud-Based
          • JAPAN Fluid Management Visualization System Market by End-User Industry Type 
            • Manufacturing
            • Energy
            • Healthcare
            • Government and Defense
            • Other End-User Industries
          • JAPAN Fluid Management Visualization System Market by Visualization Tools Type 
            • Dashboards
            • Reports
            • Graphs
            • Charts
            • Maps
          • SOUTH KOREA Outlook (USD Billion, 2019-2032)
          • SOUTH KOREA Fluid Management Visualization System Market by Product Type 
            • Software
            • Hardware
            • Services
          • SOUTH KOREA Fluid Management Visualization System Market by Application Type 
            • Oil and Gas
            • Chemicals and Petrochemicals
            • Power Generation
            • Pharmaceuticals
            • Other Industrial Applications
          • SOUTH KOREA Fluid Management Visualization System Market by Deployment Type 
            • On-Premises
            • Cloud-Based
          • SOUTH KOREA Fluid Management Visualization System Market by End-User Industry Type 
            • Manufacturing
            • Energy
            • Healthcare
            • Government and Defense
            • Other End-User Industries
          • SOUTH KOREA Fluid Management Visualization System Market by Visualization Tools Type 
            • Dashboards
            • Reports
            • Graphs
            • Charts
            • Maps
          • MALAYSIA Outlook (USD Billion, 2019-2032)
          • MALAYSIA Fluid Management Visualization System Market by Product Type 
            • Software
            • Hardware
            • Services
          • MALAYSIA Fluid Management Visualization System Market by Application Type 
            • Oil and Gas
            • Chemicals and Petrochemicals
            • Power Generation
            • Pharmaceuticals
            • Other Industrial Applications
          • MALAYSIA Fluid Management Visualization System Market by Deployment Type 
            • On-Premises
            • Cloud-Based
          • MALAYSIA Fluid Management Visualization System Market by End-User Industry Type 
            • Manufacturing
            • Energy
            • Healthcare
            • Government and Defense
            • Other End-User Industries
          • MALAYSIA Fluid Management Visualization System Market by Visualization Tools Type 
            • Dashboards
            • Reports
            • Graphs
            • Charts
            • Maps
          • THAILAND Outlook (USD Billion, 2019-2032)
          • THAILAND Fluid Management Visualization System Market by Product Type 
            • Software
            • Hardware
            • Services
          • THAILAND Fluid Management Visualization System Market by Application Type 
            • Oil and Gas
            • Chemicals and Petrochemicals
            • Power Generation
            • Pharmaceuticals
            • Other Industrial Applications
          • THAILAND Fluid Management Visualization System Market by Deployment Type 
            • On-Premises
            • Cloud-Based
          • THAILAND Fluid Management Visualization System Market by End-User Industry Type 
            • Manufacturing
            • Energy
            • Healthcare
            • Government and Defense
            • Other End-User Industries
          • THAILAND Fluid Management Visualization System Market by Visualization Tools Type 
            • Dashboards
            • Reports
            • Graphs
            • Charts
            • Maps
          • INDONESIA Outlook (USD Billion, 2019-2032)
          • INDONESIA Fluid Management Visualization System Market by Product Type 
            • Software
            • Hardware
            • Services
          • INDONESIA Fluid Management Visualization System Market by Application Type 
            • Oil and Gas
            • Chemicals and Petrochemicals
            • Power Generation
            • Pharmaceuticals
            • Other Industrial Applications
          • INDONESIA Fluid Management Visualization System Market by Deployment Type 
            • On-Premises
            • Cloud-Based
          • INDONESIA Fluid Management Visualization System Market by End-User Industry Type 
            • Manufacturing
            • Energy
            • Healthcare
            • Government and Defense
            • Other End-User Industries
          • INDONESIA Fluid Management Visualization System Market by Visualization Tools Type 
            • Dashboards
            • Reports
            • Graphs
            • Charts
            • Maps
          • REST OF APAC Outlook (USD Billion, 2019-2032)
          • REST OF APAC Fluid Management Visualization System Market by Product Type 
            • Software
            • Hardware
            • Services
          • REST OF APAC Fluid Management Visualization System Market by Application Type 
            • Oil and Gas
            • Chemicals and Petrochemicals
            • Power Generation
            • Pharmaceuticals
            • Other Industrial Applications
          • REST OF APAC Fluid Management Visualization System Market by Deployment Type 
            • On-Premises
            • Cloud-Based
          • REST OF APAC Fluid Management Visualization System Market by End-User Industry Type 
            • Manufacturing
            • Energy
            • Healthcare
            • Government and Defense
            • Other End-User Industries
          • REST OF APAC Fluid Management Visualization System Market by Visualization Tools Type 
            • Dashboards
            • Reports
            • Graphs
            • Charts
            • Maps
          • South America Outlook (USD Billion, 2019-2032)
            • South America Fluid Management Visualization System Market by Product Type 
              • Software
              • Hardware
              • Services
            • South America Fluid Management Visualization System Market by Application Type 
              • Oil and Gas
              • Chemicals and Petrochemicals
              • Power Generation
              • Pharmaceuticals
              • Other Industrial Applications
            • South America Fluid Management Visualization System Market by Deployment Type 
              • On-Premises
              • Cloud-Based
            • South America Fluid Management Visualization System Market by End-User Industry Type 
              • Manufacturing
              • Energy
              • Healthcare
              • Government and Defense
              • Other End-User Industries
            • South America Fluid Management Visualization System Market by Visualization Tools Type 
              • Dashboards
              • Reports
              • Graphs
              • Charts
              • Maps
            • South America Fluid Management Visualization System Market by Regional Type 
              • Brazil
              • Mexico
              • Argentina
              • Rest of South America
            • BRAZIL Outlook (USD Billion, 2019-2032)
            • BRAZIL Fluid Management Visualization System Market by Product Type 
              • Software
              • Hardware
              • Services
            • BRAZIL Fluid Management Visualization System Market by Application Type 
              • Oil and Gas
              • Chemicals and Petrochemicals
              • Power Generation
              • Pharmaceuticals
              • Other Industrial Applications
            • BRAZIL Fluid Management Visualization System Market by Deployment Type 
              • On-Premises
              • Cloud-Based
            • BRAZIL Fluid Management Visualization System Market by End-User Industry Type 
              • Manufacturing
              • Energy
              • Healthcare
              • Government and Defense
              • Other End-User Industries
            • BRAZIL Fluid Management Visualization System Market by Visualization Tools Type 
              • Dashboards
              • Reports
              • Graphs
              • Charts
              • Maps
            • MEXICO Outlook (USD Billion, 2019-2032)
            • MEXICO Fluid Management Visualization System Market by Product Type 
              • Software
              • Hardware
              • Services
            • MEXICO Fluid Management Visualization System Market by Application Type 
              • Oil and Gas
              • Chemicals and Petrochemicals
              • Power Generation
              • Pharmaceuticals
              • Other Industrial Applications
            • MEXICO Fluid Management Visualization System Market by Deployment Type 
              • On-Premises
              • Cloud-Based
            • MEXICO Fluid Management Visualization System Market by End-User Industry Type 
              • Manufacturing
              • Energy
              • Healthcare
              • Government and Defense
              • Other End-User Industries
            • MEXICO Fluid Management Visualization System Market by Visualization Tools Type 
              • Dashboards
              • Reports
              • Graphs
              • Charts
              • Maps
            • ARGENTINA Outlook (USD Billion, 2019-2032)
            • ARGENTINA Fluid Management Visualization System Market by Product Type 
              • Software
              • Hardware
              • Services
            • ARGENTINA Fluid Management Visualization System Market by Application Type 
              • Oil and Gas
              • Chemicals and Petrochemicals
              • Power Generation
              • Pharmaceuticals
              • Other Industrial Applications
            • ARGENTINA Fluid Management Visualization System Market by Deployment Type 
              • On-Premises
              • Cloud-Based
            • ARGENTINA Fluid Management Visualization System Market by End-User Industry Type 
              • Manufacturing
              • Energy
              • Healthcare
              • Government and Defense
              • Other End-User Industries
            • ARGENTINA Fluid Management Visualization System Market by Visualization Tools Type 
              • Dashboards
              • Reports
              • Graphs
              • Charts
              • Maps
            • REST OF SOUTH AMERICA Outlook (USD Billion, 2019-2032)
            • REST OF SOUTH AMERICA Fluid Management Visualization System Market by Product Type 
              • Software
              • Hardware
              • Services
            • REST OF SOUTH AMERICA Fluid Management Visualization System Market by Application Type 
              • Oil and Gas
              • Chemicals and Petrochemicals
              • Power Generation
              • Pharmaceuticals
              • Other Industrial Applications
            • REST OF SOUTH AMERICA Fluid Management Visualization System Market by Deployment Type 
              • On-Premises
              • Cloud-Based
            • REST OF SOUTH AMERICA Fluid Management Visualization System Market by End-User Industry Type 
              • Manufacturing
              • Energy
              • Healthcare
              • Government and Defense
              • Other End-User Industries
            • REST OF SOUTH AMERICA Fluid Management Visualization System Market by Visualization Tools Type 
              • Dashboards
              • Reports
              • Graphs
              • Charts
              • Maps
            • MEA Outlook (USD Billion, 2019-2032)
              • MEA Fluid Management Visualization System Market by Product Type 
                • Software
                • Hardware
                • Services
              • MEA Fluid Management Visualization System Market by Application Type 
                • Oil and Gas
                • Chemicals and Petrochemicals
                • Power Generation
                • Pharmaceuticals
                • Other Industrial Applications
              • MEA Fluid Management Visualization System Market by Deployment Type 
                • On-Premises
                • Cloud-Based
              • MEA Fluid Management Visualization System Market by End-User Industry Type 
                • Manufacturing
                • Energy
                • Healthcare
                • Government and Defense
                • Other End-User Industries
              • MEA Fluid Management Visualization System Market by Visualization Tools Type 
                • Dashboards
                • Reports
                • Graphs
                • Charts
                • Maps
              • MEA Fluid Management Visualization System Market by Regional Type 
                • GCC Countries
                • South Africa
                • Rest of MEA
              • GCC COUNTRIES Outlook (USD Billion, 2019-2032)
              • GCC COUNTRIES Fluid Management Visualization System Market by Product Type 
                • Software
                • Hardware
                • Services
              • GCC COUNTRIES Fluid Management Visualization System Market by Application Type 
                • Oil and Gas
                • Chemicals and Petrochemicals
                • Power Generation
                • Pharmaceuticals
                • Other Industrial Applications
              • GCC COUNTRIES Fluid Management Visualization System Market by Deployment Type 
                • On-Premises
                • Cloud-Based
              • GCC COUNTRIES Fluid Management Visualization System Market by End-User Industry Type 
                • Manufacturing
                • Energy
                • Healthcare
                • Government and Defense
                • Other End-User Industries
              • GCC COUNTRIES Fluid Management Visualization System Market by Visualization Tools Type 
                • Dashboards
                • Reports
                • Graphs
                • Charts
                • Maps
              • SOUTH AFRICA Outlook (USD Billion, 2019-2032)
              • SOUTH AFRICA Fluid Management Visualization System Market by Product Type 
                • Software
                • Hardware
                • Services
              • SOUTH AFRICA Fluid Management Visualization System Market by Application Type 
                • Oil and Gas
                • Chemicals and Petrochemicals
                • Power Generation
                • Pharmaceuticals
                • Other Industrial Applications
              • SOUTH AFRICA Fluid Management Visualization System Market by Deployment Type 
                • On-Premises
                • Cloud-Based
              • SOUTH AFRICA Fluid Management Visualization System Market by End-User Industry Type 
                • Manufacturing
                • Energy
                • Healthcare
                • Government and Defense
                • Other End-User Industries
              • SOUTH AFRICA Fluid Management Visualization System Market by Visualization Tools Type 
                • Dashboards
                • Reports
                • Graphs
                • Charts
                • Maps
              • REST OF MEA Outlook (USD Billion, 2019-2032)
              • REST OF MEA Fluid Management Visualization System Market by Product Type 
                • Software
                • Hardware
                • Services
              • REST OF MEA Fluid Management Visualization System Market by Application Type 
                • Oil and Gas
                • Chemicals and Petrochemicals
                • Power Generation
                • Pharmaceuticals
                • Other Industrial Applications
              • REST OF MEA Fluid Management Visualization System Market by Deployment Type 
                • On-Premises
                • Cloud-Based
              • REST OF MEA Fluid Management Visualization System Market by End-User Industry Type 
                • Manufacturing
                • Energy
                • Healthcare
                • Government and Defense
                • Other End-User Industries
              • REST OF MEA Fluid Management Visualization System Market by Visualization Tools Type 
                • Dashboards
                • Reports
                • Graphs
                • Charts
                • Maps
    Report Infographic
    Free Sample Request

    Kindly complete the form below to receive a free sample of this Report

    Customer Strories

    “I am very pleased with how market segments have been defined in a relevant way for my purposes (such as "Portable Freezers & refrigerators" and "last-mile"). In general the report is well structured. Thanks very much for your efforts.”

    Victoria Milne Founder
    Case Study

    Chemicals and Materials