info@marketresearchfuture.com   📞  +1 (855) 661-4441(US)   📞  +44 1720 412 167(UK)
Certified Global Research Member
Isomar fd.webp Wcrc 57.webp
Key Questions Answered
  • Global Market Outlook
  • In-depth analysis of global and regional trends
  • Analyze and identify the major players in the market, their market share, key developments, etc.
  • To understand the capability of the major players based on products offered, financials, and strategies.
  • Identify disrupting products, companies, and trends.
  • To identify opportunities in the market.
  • Analyze the key challenges in the market.
  • Analyze the regional penetration of players, products, and services in the market.
  • Comparison of major players financial performance.
  • Evaluate strategies adopted by major players.
  • Recommendations
Why Choose Market Research Future?
  • Vigorous research methodologies for specific market.
  • Knowledge partners across the globe
  • Large network of partner consultants.
  • Ever-increasing/ Escalating data base with quarterly monitoring of various markets
  • Trusted by fortune 500 companies/startups/ universities/organizations
  • Large database of 5000+ markets reports.
  • Effective and prompt pre- and post-sales support.

Data Visualization Applications Market Research Report By Deployment Type (Cloud, On-Premises), By Visualization Type (Interactive Dashboards, Charts and Graphs, Maps, Data Storytelling), By Data Source (Spreadsheets, Databases, Cloud Storage), By End-User Industry (Financial Services, Healthcare, Retail, Manufacturing) and By Regional (North America, Europe, South America, Asia Pacific, Middle East and Africa) - Forecast to 2032


ID: MRFR/ICT/22391-HCR | 100 Pages | Author: Aarti Dhapte| September 2024

Data Visualization Applications Market Overview


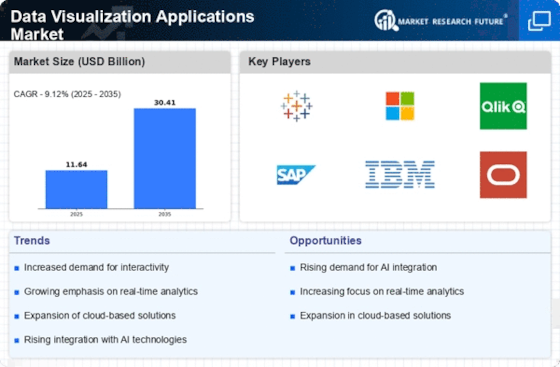
As per MRFR analysis, the Data Visualization Applications Market Size was estimated at 8.96 (USD Billion) in 2022. The Data Visualization Applications Market Industry is expected to grow from 9.78 (USD Billion) in 2023 to 21.4 (USD Billion) by 2032. The Data Visualization Applications Market CAGR (growth rate) is expected to be around 9.1% during the forecast period (2024 - 2032).


Key Data Visualization Applications Market Trends Highlighted


Key market drivers for data visualization applications include the growing volume and complexity of data, the need for real-time insights, and the increasing adoption of artificial intelligence (AI) and machine learning (ML). Opportunities to be explored or captured include the development of new visualization techniques, the integration of data visualization with other technologies, and the expansion into new markets.


Recent trends in the data visualization applications market include the adoption of cloud-based solutions, the use of interactive and immersive visualization techniques, and the growing importance of data storytelling. As organizations continue to generate and collect vast amounts of data, the need for effective data visualization tools to analyze and understand this data will drive the growth of this market.


Global Data Visualization Applications Market Overview


Source: Primary Research, Secondary Research, MRFR Database and Analyst Review


Data Visualization Applications Market Drivers


Increasing Adoption of Data Visualization Tools for Enhanced Decision Making


Data visualization tools empower businesses to transform raw data into easily digestible visual formats, enabling stakeholders to gain actionable insights and make informed decisions. The surge in data volume and complexity has heightened the need for effective data visualization solutions, propelling market growth. Interactive dashboards, real-time analytics, and customizable visualizations are gaining traction, allowing organizations to monitor key performance indicators (KPIs), identify trends, and optimize operations.By leveraging data visualization applications, businesses can improve their decision-making processes, enhance operational efficiency, and gain a competitive edge in the Data Visualization Applications Market Industry.


Growing Demand for Data Visualization in Various Industries


The rapidly growing use of data visualization in numerous industries, such as healthcare, retail, manufacturing, and finance, is increasingly driving the market. Data visualization helps understand databases, recognize patterns, and communicate results and insights. Effective patient data analysis, tracking the treatment results and improving patient care with data visualization tools in the healthcare segment facilitate reporting and monitoring. Among retail companies, these applications are also essential for understanding customers' behavior, developing marketing strategies, and improving products. Therefore, the growing use of data visualization applications in various industries will continue driving the market.


Advancements in Artificial Intelligence (AI) and Machine Learning (ML)


The data visualization market is transforming due to the growing implementation of AI and ML in data visualization tools Landscape. For instance, these tools analyze data automatically, detect hidden insights, and build intelligent models. Therefore, visualizations look more precise and are useful for decision-makers and analytics. By diving deeper into these processes, ML algorithms allow learning from the data using historical data, detecting patterns, and conducting future predictions. Consequently, it is relevant to state that the future development of the Data Visualization Applications Market Industry will be associated with the increasing implementation of AI and ML technologies and their convergence with data visualization.


Data Visualization Applications Market Segment Insights


Data Visualization Applications Market Deployment Type Insights


The Data Visualization Applications Market is segmented by deployment type into cloud and on-premises. Forecast to account for a higher market share in 2023, the cloud segment is also projected to grow at a higher compound annual growth rate. The increasing adoption of cloud-based data visualization applications by all sizes of businesses contributes to its projected growth rate. Businesses are increasingly realising the benefits that come with adopting cloud-based solutions, such as reduced costs, scalability, and flexibility. In the cloud deployment model, applications are hosted, managed, and stored by third-party providers, which further reduces the complexity experienced by businesses using on-premises solutions.


The on-premises segment is expected to account for a lower market share in 2023 and grow at a lower compound annual growth rate. In general, on-premises data visualization applications are those that are hosted, stored, and managed on a company’s servers. This type of deployment solution is typically preferred by businesses that require high levels of control and security over their data. However, the need to manage servers in-house, slower implementation, and restrictive architecture will result in a lower growth rate. In turn, the increasing volume and complexity of data is a critical factor promoting the growth of the market. In addition to the use of big data analytics and the Internet of Things IoT, the need for data-driven decision-making with an emphasis on enhanced forecasting and predictive tools will contribute to higher market growth rates.


Data_Visualization_Applications_Market, By Deployment Type


Source: Primary Research, Secondary Research, MRFR Database and Analyst Review


Data Visualization Applications Market Visualization Type Insights


For the Data Visualization Applications Market, the Visualization Type segment is expected to be the fastest-growing segment over the forecast period. The interactive dashboards, as one of the major sub-segments of the Visualization Type, provide the end-users with the opportunity to play with data and drill down to specific values or groups of values. So, users can apply different operations to analyze those data. Because of the interactive nature of dashboards, they are increasingly applied across a diversity of fields. Meanwhile, charts and graphs, as another main sub-segment of the Visualization Type, are commonly used to represent the data graphically in a simple form.


Therefore, charts and graphs are widely used in such applications as business intelligence and data analysis. However, to visualize the geographical data, maps play a significant role. Modern business intelligence applications are also based on the use of maps to analyze the patterns and trends formed around the location. Finally, data storytelling is a relatively new sub-segment of the Visualization Type, which combines the power of visualization and a storytelling method to create a perfect description and define the point of view. At present, many firms choose to be data-driven companies. That is why it is assumed to increase the demand for the application, which means the Visualization Type will be the fastest-growing segment for the given market.


Data Visualization Applications Market Data Source Insights


The Data Visualization Applications Market market is segmented based on data source into spreadsheets, databases, and cloud storage. Among these, the spreadsheets segment held the largest market share in 2023 and is expected to continue its dominance throughout the forecast period. The widespread usage of spreadsheets in various industries for data management and analysis is a key factor driving the growth of this segment. Additionally, the increasing adoption of cloud-based spreadsheet solutions, such as Google Sheets and Microsoft Excel Online, is further contributing to the growth of the spreadsheets segment. Databases are another important data source for data visualization applications.


The growing adoption of structured and semi-structured data in various industries is fueling the demand for database-driven data visualization solutions. Cloud storage is also gaining traction as a data source for data visualization applications, owing to its scalability, flexibility, and cost-effectiveness. The increasing adoption of cloud-based data storage services, such as Amazon S3 and Microsoft Azure Blob Storage, is driving the growth of the cloud storage segment in the data visualization market.


Data Visualization Applications Market End-User Industry Insights


The Data Visualization Applications Market is segmented based on end-user industry into Financial Services, Healthcare, Retail, and Manufacturing. Among these segments, the Financial Services segment holds the largest market share due to the increasing demand for data visualization tools to analyze financial data, identify trends, and make informed decisions. The Healthcare segment is also expected to witness significant growth in the coming years due to the growing adoption of data visualization applications for analyzing patient data, tracking disease trends, and improving patient outcomes.


The Retail segment is another key end-user industry for data visualization applications, as retailers use these tools to analyze customer data, optimize marketing campaigns, and improve product placement. The Manufacturing segment is also expected to contribute to the growth of the Data Visualization Applications Market, as manufacturers use data visualization tools to analyze production data, identify inefficiencies, and improve operational efficiency.


Data Visualization Applications Market Regional Insights


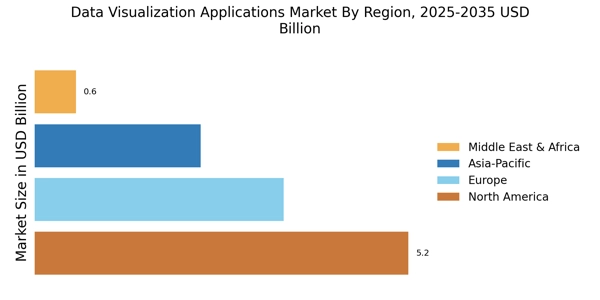
Regionally, North America is anticipated to dominate the market with a share of 38.5% in 2023, followed by Europe and APAC. The growth in North America is attributed to the increasing adoption of data visualization tools by businesses to gain insights from complex data. Europe is expected to witness a significant growth rate over the forecast period due to the rising awareness of data visualization benefits and the presence of a large number of data visualization software vendors. APAC is projected to be the fastest-growing region, with a CAGR of 10.2% from 2023 to 2032.


This growth is primarily driven by the increasing adoption of data visualization tools in emerging economies such as India and China. South America and MEA are expected to have a moderate growth rate during the forecast period due to the limited adoption of data visualization tools in these regions.


Data_Visualization_Applications_Market, By Regional


Source: Primary Research, Secondary Research, MRFR Database and Analyst Review


Data Visualization Applications Market Key Players And Competitive Insights


Major players in the Data Visualization Applications Market industry are constantly innovating and developing new features to stay ahead of the competition. Leading Data Visualization Applications Market players are investing heavily in research and development to create new and improved products that meet the evolving needs of customers. The Data Visualization Applications Market development is being driven by the increasing demand for data visualization tools from various industries. The competitive landscape of the Data Visualization Applications Market is expected to remain competitive in the coming years, with new entrants and existing players vying for market share. One of the leading companies in the Data Visualization Applications Market is Tableau.


Tableau is a software company that provides data visualization and business intelligence software. Tableau's products are used by businesses of all sizes to visualize and analyze data. Tableau has a strong presence in the market and is known for its user-friendly software and its ability to handle large data sets. A key competitor of Tableau is Qlik. Qlik is a software company that provides business intelligence and data visualization software. Qlik's products are used by businesses of all sizes to visualize and analyze data. Qlik has a strong presence in the market and is known for its powerful analytics capabilities and its ability to handle complex data sets.


Key Companies in the Data Visualization Applications Market Include


  • SAP Analytics Cloud

  • Yellowfin

  • Power BI

  • SAS Visual Analytics

  • Domo

  • TIBCO Spotfire

  • IBM Cognos Analytics

  • Tableau

  • Looker

  • Sisense

  • Zoho Analytics

  • Qlik Sense

  • Google Data Studio

  • Oracle Analytics Cloud


Data Visualization Applications Market Industry Developments


The Data Visualization Applications Market is projected to grow from an estimated USD 9.78 billion in 2023 to USD 21.4 billion by 2032, at a CAGR of 9.1%. This growth is attributed to factors such as the increasing adoption of data visualization tools for business intelligence and analytics, rising demand for interactive and user-friendly data visualization solutions, and the growing adoption of cloud-based data visualization platforms. Recent news developments include the launch of new data visualization tools by vendors such as Tableau and Microsoft, as well as partnerships between data visualization companies and cloud providers to offer integrated solutions.


Key market players are focusing on developing innovative solutions that leverage artificial intelligence and machine learning to enhance data visualization capabilities. Overall, the market is expected to witness significant growth in the coming years due to the increasing need for businesses to effectively analyze and interpret data for decision-making.


Data Visualization Applications Market Segmentation Insights


Data Visualization Applications Market Deployment Type Outlook


  • Cloud

  • On-Premises


Data Visualization Applications Market Visualization Type Outlook


  • Interactive Dashboards

  • Charts and Graphs

  • Maps

  • Data Storytelling


Data Visualization Applications Market Data Source Outlook


  • Spreadsheets

  • Databases

  • Cloud Storage


Data Visualization Applications Market End-User Industry Outlook


  • Financial Services

  • Healthcare

  • Retail

  • Manufacturing


Data Visualization Applications Market Regional Outlook


  • North America

  • Europe

  • South America

  • Asia Pacific

  • Middle East and Africa

Report Attribute/Metric Details
Market Size 2022 8.96 (USD Billion)
Market Size 2023 9.78 (USD Billion)
Market Size 2032 21.4 (USD Billion)
Compound Annual Growth Rate (CAGR) 9.1% (2024 - 2032)
Report Coverage Revenue Forecast, Competitive Landscape, Growth Factors, and Trends
Base Year 2023
Market Forecast Period 2024 - 2032
Historical Data 2019 - 2023
Market Forecast Units USD Billion
Key Companies Profiled SAP Analytics Cloud, Yellowfin, Power BI, SAS Visual Analytics, Domo, TIBCO Spotfire, IBM Cognos Analytics, Tableau, Looker, Sisense, Zoho Analytics, Qlik Sense, Google Data Studio, Oracle Analytics Cloud
Segments Covered Deployment Type, Visualization Type, Data Source, End-User Industry, Regional
Key Market Opportunities 1 Cloud-based data visualization solutions2 Realtime data analytics and visualization3 Embedded data visualization4 Advanced data visualization techniques, e.g., AIMLdriven insights5 Increasing demand for self-service data visualization
Key Market Dynamics Increasing adoption of AI and ML techniques Growing demand for real-time data visualization Shift towards cloud-based data visualization solutions. Increasing focus on data governance and security Rise of interactive and immersive visualization technologies
Countries Covered North America, Europe, APAC, South America, MEA


Frequently Asked Questions (FAQ) :

The Data Visualization Applications Market is expected to reach a valuation of 9.78 Billion USD in 2023.

The Data Visualization Applications Market is projected to grow at a CAGR of 9.1% from 2024 to 2032.

North America is expected to hold the largest market share in the Data Visualization Applications Market in 2023.

Data Visualization Applications are used in a wide range of applications, including business intelligence, data analysis, financial analysis, marketing, sales, and customer relationship management.

Key competitors in the Data Visualization Applications Market include Tableau, Microsoft, Qlik, SAP, and IBM.

The growth of the Data Visualization Applications Market is being driven by a number of factors, including the increasing volume of data, the need for better data visualization tools, and the growing adoption of cloud-based data visualization solutions.

The Data Visualization Applications Market faces a number of challenges, including the lack of skilled data visualization professionals, the high cost of data visualization software, and the need for better data integration.

There are a number of opportunities for the Data Visualization Applications Market, including the growing adoption of data visualization in new industries, the development of new data visualization technologies, and the increasing demand for data visualization services.

Key trends in the Data Visualization Applications Market include the increasing adoption of cloud-based data visualization solutions, the growing use of data visualization in artificial intelligence and machine learning, and the development of new data visualization techniques.

The future outlook for the Data Visualization Applications Market is positive, with the market expected to continue to grow at a healthy rate in the coming years.

Leading companies partner with us for data-driven Insights
client_1 client_2 client_3 client_4 client_5 client_6 client_7 client_8 client_9 client_10
Kindly complete the form below to receive a free sample of this Report
Please fill in Business Email for Quick Response

We do not share your information with anyone. However, we may send you emails based on your report interest from time to time. You may contact us at any time to opt-out.

Purchase Option
Single User $ 4,950
Multiuser License $ 5,950
Enterprise User $ 7,250
Compare Licenses
Tailored for You
  • Dedicated Research on any specifics segment or region.
  • Focused Research on specific players in the market.
  • Custom Report based only on your requirements.
  • Flexibility to add or subtract any chapter in the study.
  • Historic data from 2014 and forecasts outlook till 2040.
  • Flexibility of providing data/insights in formats (PDF, PPT, Excel).
  • Provide cross segmentation in applicable scenario/markets.