

Healthcare Revenue Cycle Management Market Summary
As per Market Research Future Analysis, the Healthcare Revenue Cycle Management (RCM) Market was valued at USD 51.60 billion in 2025 and is projected to reach USD 140.31 billion by 2035, growing at a CAGR of 9.52% from 2025 to 2035. Key drivers include the digitalization of healthcare, increasing healthcare IT spending, and the rise of well-established healthcare facilities. Innovations such as AI-driven technologies and improved automation tools are enhancing claim accuracy and operational efficiency. The market is characterized by a shift towards outsourcing RCM services, driven by the need for optimized workflows and cost reductions.
Key Market Trends & Highlights
The Healthcare RCM market is witnessing significant growth driven by technological advancements and regulatory mandates.
- Market Size in 2024: USD 51.60 billion; projected to reach USD 140.31 billion by 2035.
- CAGR from 2025 to 2035: 9.52%; driven by increasing healthcare spending and technological advancements.
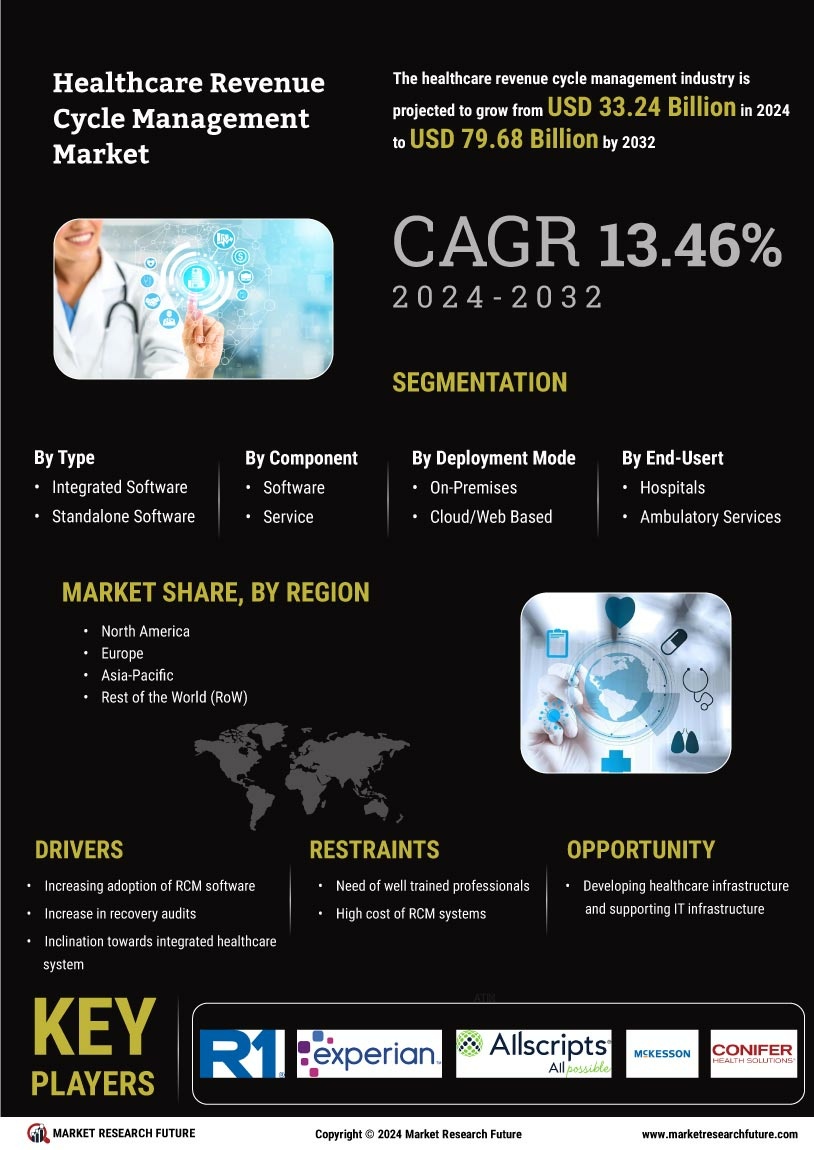
- Integrated software segment accounted for 35% of market revenue; standalone software is the fastest-growing category.
- North America holds the largest market share; the US market is the largest in this region.
Market Size & Forecast
| 2024 Market Size | USD 51.60 Billion |
| 2035 Market Size | USD 140.31 Billion |
| CAGR (2024-2035) | 9.52% |
Major Players
Key players include R1 RCM, Inc., Allscripts Healthcare, LLC, Experian Information Solutions, Inc., AGS Health Inc., Athenahealth, and Cerner Corporation.


Leave a Comment