• Cat-intel
  • MedIntelliX
  • Resources
  • About Us
  • Request Free Sample ×

    Kindly complete the form below to receive a free sample of this Report

    Leading companies partner with us for data-driven Insights

    clients tt-cursor

    Graph Analytics Market

    ID: MRFR/ICT/8079-HCR
    100 Pages
    Aarti Dhapte
    September 2025

    Graph Analytics Market Research Report By Application (Fraud Detection, Social Network Analysis, Recommendation Systems, Risk Management, Knowledge Graphs), By Deployment Mode (On-Premises, Cloud-Based, Hybrid), By End User (BFSI, Retail, Telecommunications, Healthcare, Government), By Component (Software, Services) and By Regional (North America, Europe, South America, Asia Pacific, Middle East and Africa) - Forecast to 2032

    Share:
    Download PDF ×

    We do not share your information with anyone. However, we may send you emails based on your report interest from time to time. You may contact us at any time to opt-out.

    Graph Analytics Market Research Report - Global Forecast till 2032 Infographic
    Purchase Options
    $ 4,950.0
    $ 5,950.0
    $ 7,250.0
    Table of Contents

    Graph Analytics Market Summary

    As per Market Research Future Analysis, the Graph Analytics Market was valued at 2.92 USD Billion in 2022 and is projected to grow from 3.43 USD Billion in 2023 to 14.6 USD Billion by 2032, reflecting a CAGR of 17.47% from 2024 to 2032. The market is driven by the increasing demand for data-driven decision-making across sectors, with significant opportunities in finance, healthcare, and retail. The integration of AI and machine learning enhances graph analytics capabilities, while the rise of cloud-based solutions and open-source databases makes these technologies more accessible.

    Key Market Trends & Highlights

    The Graph Analytics Market is experiencing robust growth due to several key trends.

    • Fraud Detection application is expected to grow from 0.929 USD Billion in 2023 to 4.082 USD Billion by 2032.
    • Social Network Analysis is projected to increase from 0.619 USD Billion in 2023 to 2.747 USD Billion by 2032.
    • Recommendation Systems are anticipated to rise from 0.697 USD Billion in 2023 to 3.14 USD Billion by 2032.
    • Cloud-Based solutions are gaining traction due to their scalability and cost-effectiveness.

    Market Size & Forecast

    2022 Market Size USD 2.92 Billion
    2023 Market Size USD 3.43 Billion
    2032 Market Size USD 14.6 Billion
    CAGR (2024-2032) 17.47%

    Major Players

    Key players include Amazon, Cytoscape, Google, Redis Labs, TIBCO Software, Oracle, TigerGraph, Alteryx, SAP, ArangoDB, IBM, Microsoft, Neo4j, MarkLogic, DataStax.

    Graph Analytics Market Trends

    The Graph Analytics Market is witnessing significant growth driven by the increasing need for data-driven decision-making across various sectors. Organizations are leveraging graph analytics to better understand relationships and patterns within complex datasets. The push for improved customer experience, enhanced operational efficiency and risk management are key market drivers. As businesses gather more data, the demand for tools that can transform this data into actionable insights is on the rise. This need is further propelled by the expansion of social media platforms, IoT devices, and the evolving landscape of big data.

    There are numerous opportunities to be explored within the market, particularly as more companies realize the potential benefits of adopting graph analytics solutions.Industries such as finance, healthcare, and retail are poised to gain from implementing these technologies. The ability to identify fraud patterns, optimize supply chains, and improve patient outcomes creates a fertile ground for innovation. Additionally, developments in artificial intelligence and machine learning present avenues for enhancing graph analytics capabilities, allowing firms to decipher even more complex relationships in their data.

    Recent trends show an increasing adoption of cloud-based graph analytics solutions, making them more accessible for businesses of all sizes. Companies are also focusing on integrating graph analytics with existing enterprise applications, promoting seamless data flow and collaborative efforts.The rise of open-source graph databases is another trend, as they provide cost-effective options for organizations looking to implement graph analytics without extensive investments. Altogether, these factors contribute to a dynamic and evolving market, indicating bright prospects for future growth and innovation in graph analytics.

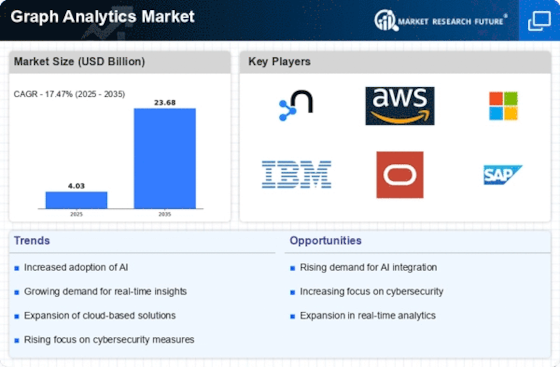
    Fig 1: Graph Analytics Market Overview

    Source: Primary Research, Secondary Research, Market Research Future Database and Analyst Review

    The increasing complexity of data relationships in various sectors appears to drive the demand for advanced graph analytics solutions, which may enhance decision-making processes and operational efficiencies.

    U.S. Department of Commerce

    Graph Analytics Market Drivers

    Market Growth Projections

    The Global Graph Analytics Market Industry is poised for substantial growth, with projections indicating a market value of 4.04 USD Billion in 2024 and a remarkable increase to 23.7 USD Billion by 2035. This growth trajectory suggests a compound annual growth rate of 17.44% from 2025 to 2035, reflecting the increasing adoption of graph analytics across various sectors. The rising need for data-driven insights, coupled with advancements in technology and the growing emphasis on cybersecurity, positions the graph analytics market as a key player in the broader analytics landscape.

    Advancements in Technology

    Technological advancements play a pivotal role in propelling the Global Graph Analytics Market Industry forward. Innovations in artificial intelligence and machine learning facilitate the processing of vast amounts of data, allowing for more sophisticated graph analysis. These technologies enable organizations to visualize complex networks and derive actionable insights efficiently. For example, social media platforms leverage graph analytics to enhance user engagement by analyzing user interactions. As these technologies continue to evolve, the market is anticipated to grow significantly, with projections indicating a value of 23.7 USD Billion by 2035.

    Rising Demand for Data-Driven Insights

    The Global Graph Analytics Market Industry experiences a surge in demand for data-driven insights as organizations increasingly rely on data to inform decision-making. This trend is driven by the need to analyze complex relationships within data sets, enabling businesses to uncover hidden patterns and correlations. For instance, companies in sectors such as finance and healthcare utilize graph analytics to enhance fraud detection and patient care. As a result, the market is projected to reach 4.04 USD Billion in 2024, reflecting the growing recognition of graph analytics as a vital tool for competitive advantage.

    Need for Enhanced Cybersecurity Measures

    The Global Graph Analytics Market Industry is significantly influenced by the growing need for enhanced cybersecurity measures. As cyber threats become increasingly sophisticated, organizations are turning to graph analytics to identify vulnerabilities and detect anomalies within their networks. By mapping relationships between users, devices, and data, graph analytics can reveal potential security breaches before they escalate. For example, financial institutions utilize graph analytics to monitor transactions and flag suspicious activities. This heightened focus on cybersecurity is likely to drive market growth, as businesses prioritize investments in advanced analytics solutions.

    Regulatory Compliance and Data Governance

    Regulatory compliance and data governance are critical factors influencing the Global Graph Analytics Market Industry. Organizations are required to adhere to stringent regulations regarding data privacy and security, prompting them to implement robust analytics solutions. Graph analytics aids in ensuring compliance by providing insights into data lineage and usage patterns, thereby enhancing transparency and accountability. For instance, healthcare organizations utilize graph analytics to track patient data access and ensure compliance with regulations such as HIPAA. As regulatory frameworks evolve, the demand for graph analytics solutions is expected to rise, further propelling market growth.

    Increasing Adoption of Cloud-Based Solutions

    The shift towards cloud-based solutions is a notable driver of growth within the Global Graph Analytics Market Industry. Organizations are increasingly adopting cloud platforms to store and analyze data, as these solutions offer scalability, flexibility, and cost-effectiveness. Cloud-based graph analytics tools allow businesses to access real-time data insights from anywhere, fostering collaboration and informed decision-making. For instance, companies can utilize cloud-based graph databases to manage customer relationships more effectively. This trend is expected to contribute to a compound annual growth rate of 17.44% from 2025 to 2035, indicating a robust future for the market.

    Market Segment Insights

    Graph Analytics Market Application Insights

    The Graph Analytics Market revenue focuses heavily on the Application segment, which is a critical driver for market growth, driven by a significant need to analyze vast amounts of complex data relationships effectively. In 2023, the market is valued at 3.43 USD Billion, with projections indicating a remarkable increase by 2032. Within this segment, the application in Fraud Detection is particularly noteworthy, valued at 0.929 USD Billion in 2023 and expected to reach 4.082 USD Billion in 2032.

    This growth is largely attributed to the increasing concerns about financial fraud across various industries, necessitating advanced analytics to identify and prevent fraudulent activities.Social Network Analysis, valued at 0.619 USD Billion in 2023 and projected to attain 2.747 USD Billion by 2032, plays a vital role in understanding customer behavior and enhancing user engagement on social platforms. The rapid expansion of social media and digital interactions has fostered a greater demand for tools capable of extracting insights from relationship networks.

    Recommendation Systems, also significant, are projected to grow from 0.697 USD Billion in 2023 to 3.14 USD Billion in 2032 as businesses leverage graph analytics to provide personalized recommendations, thereby enhancing customer experiences and driving sales.Risk Management applications are valued at 0.581 USD Billion and are expected to grow to 2.669 USD Billion by 2032; they underline the rising importance of risk mitigation strategies within organizations, using graph-based models to assess and manage potential risks efficiently.

    Lastly, Knowledge Graphs, valued at 0.604 USD Billion in 2023, anticipate reaching 1.962 USD Billion by 2032, illustrating their increasing utilization in search engines and AI applications to enable enhanced data retrieval and insight generation. Each of these applications holds strategic importance in the Graph Analytics Market segmentation, as they cater to distinct industry needs, thereby fostering substantial market growth and expansion opportunities by addressing risk, fraud detection and consumer engagement demands.The growing adoption of advanced analytics technologies underscores the importance of these applications in shaping the future landscape of the Graph Analytics Market industry.

    Fig 2: Graph Analytics Market Insights

    Fig 2: Graph Analytics Market Insights

    Source: Primary Research, Secondary Research, Market Research Future Database and Analyst Review

    Graph Analytics Market Deployment Mode Insights

    This segment comprises various implementations, notably On-Premises, Cloud-Based and Hybrid solutions, each playing a vital role in the ecosystem. On-Premises solutions are often essential for industries demanding stringent data security protocols, providing greater control and customization. In contrast, Cloud-Based options are gaining traction due to their scalability and cost-effectiveness, allowing businesses to easily adapt to growing data needs.Hybrid deployments combine the benefits of both On-Premises and Cloud-based models, catering to companies looking to balance security and flexibility. The significant interest in these diverse deployment modes illustrates the shifting preferences of organizations seeking optimized graph analytics capabilities.

    The Graph Analytics Market statistics show that advancements in technology and increases in data volume are driving rapid adoption, presenting opportunities for innovation while also posing challenges such as managing data integration and security.Overall, understanding these Deployment Modes is crucial for grasping the broader Graph Analytics Market revenue trends and growth potential.

    Graph Analytics Market End User Insights

    The End User segment plays a pivotal role in this growth, with sectors such as BFSI, Retail, Telecommunications, Healthcare and Government leveraging graph analytics to enhance decision-making and operational efficiency. BFSI dominates this market due to its strong need for fraud detection and risk assessments, utilizing graph structures to analyze interconnected financial transactions.Similarly, the Retail sector significantly benefits from customer insights and personalized marketing strategies, making effective use of graph data in understanding buyer behavior. Telecommunications companies capitalize on graph analytics for network optimization and management of complex interconnections.

    Healthcare organizations are increasingly adopting these analytics for patient management and predictive modeling, enabling improved patient outcomes. Lastly, Government agencies utilize graph analytics for public safety and resource allocation, highlighting the importance of understanding relationships within data.As organizations across these sectors continue to recognize the value of visualizing complex relationships, the Graph Analytics Market is poised for sustained growth, driven by the demand for advanced analytic capabilities to manage vast amounts of interconnected data efficiently.

    Graph Analytics Market Component Insights

    The Component segment plays a crucial role in this dynamic market, featuring two primary areas of focus: Software and Services. The Software component is pivotal as it provides essential tools and frameworks for organizations to analyze complex data structures effectively, significantly impacting decision-making processes. Services complement these tools by offering expert assistance and support, ensuring that businesses can leverage graph analytics to its fullest potential.Given the increasing adoption of advanced technologies and the necessity for data-driven insights across numerous industries, the Graph Analytics Market segmentation reveals that both Software and Services are integral to driving market growth.

    This landscape is further supported by rising trends in big data analytics and machine learning, which create significant opportunities for enhancing graph analytics capabilities across various sectors. Moreover, the growing demand for predictive analytics and real-time data processing underscores the increasing importance of this segment in the Graph Analytics Market industry.

    Get more detailed insights about Graph Analytics Market Research Report - Global Forecast till 2032

    Regional Insights

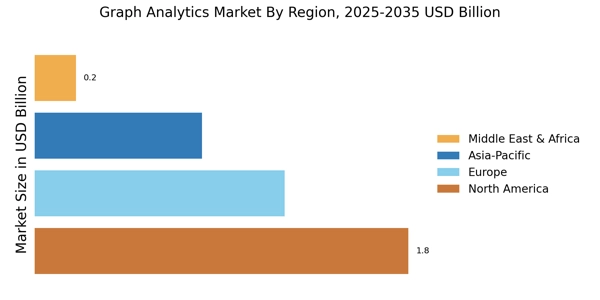
    The Graph Analytics Market is witnessing substantial growth across various regions. In 2023, North America leads the market with a valuation of 1.2 USD Billion, reflecting its major role in technological advancements and data-driven decision-making. Following closely, Europe holds a significant share at 0.89 USD Billion, driven by increased adoption of analytics solutions across industries.

    The APAC region, valued at 0.658 USD Billion, shows promising expansion potential due to rapid industrialization and digital transformation initiatives.South America, with a valuation of 0.333 USD Billion, and MEA at 0.348 USD Billion, represent emerging markets with significant opportunities for growth as businesses begin to leverage data analytics for competitive advantage. The overall market trends indicate increased investments in technology among these regions, alongside challenges like data privacy concerns and a lack of skilled professionals. However, the rising demand for real-time data analysis is creating opportunities across all markets.

    Thus, the Graph Analytics Market segmentation illustrates diverse growth trajectories influenced by regional business dynamics and technological adoption rates.

    Fig 3: Graph Analytics Market Regional Insights

    Graph Analytics Market Regional Insights

    Source: Primary Research, Secondary Research, Market Research Future Database and Analyst Review

    Key Players and Competitive Insights

    The Graph Analytics Market has emerged as a significant sector within the broader landscape of data analysis and business intelligence, driven by the increasing importance of interconnected data and the need for insights derived from complex relationships. Organizations across various industries are recognizing the value of graph-based algorithms and technologies that can efficiently process relational data, enhancing decision-making processes and unlocking innovative solutions. As more companies invest in advanced analytics strategies, the level of competition within this market intensifies, with providers striving to differentiate their offerings and enhance their technological capabilities.

    As a result, companies in this space are focusing on the scalability, performance, and usability of their graph analytics solutions to cater to the demands of diverse customer bases.Amazon holds a prominent position in the Graph Analytics Market, leveraging its cloud computing infrastructure and sophisticated analytics tools to provide value-added services. The strength of Amazon lies in its extensive experience in handling large-scale data operations combined with its advanced algorithms that can analyze complex graph structures efficiently. By integrating graph analytics with its larger cloud ecosystem, Amazon enables businesses to derive actionable insights from their data seamlessly.

    The company’s commitment to innovation ensures that it continuously enhances its graph analytics capabilities, providing users with robust and user-friendly tools. Additionally, Amazon's ability to attract a vast customer base across multiple industries amplifies its market presence, establishing it as a key player in the competitive landscape of graph analytics.Cytoscape is recognized for its contributions to the Graph Analytics Market, particularly within the domain of biological networks and research. The platform is renowned for its open-source framework, which allows users to visualize and analyze complex network data effectively.

    Cytoscape's strengths lie in its strong community support, extensive range of plugins and ability to facilitate collaborative research efforts. By focusing on providing specialized tools tailored to specific research needs, Cytoscape has established itself as a preferred choice among researchers and scientists looking for graph analytics solutions in life sciences. This specialization not only enhances the platform's usability but also fosters a culture of innovation and continuous improvement, allowing Cytoscape to maintain its relevance and competitiveness in the evolving landscape of graph analytics.

    Key Companies in the Graph Analytics Market market include

    Industry Developments

    The Graph Analytics Market has recently witnessed significant developments, particularly with the increasing adoption of advanced analytics by major tech companies. Amazon, Google, and Microsoft are intensifying their efforts in enhancing graph analytical capabilities to cater to growing customer needs for real-time insights. Meanwhile, Oracle has been expanding its cloud offerings with integrated graph databases, which is contributing to a growing market valuation. In more strategic moves, TIBCO Software and DataStax have been collaborating to enhance data visualization and contextual analytics, enabling businesses to derive actionable insights from interconnected data sources.

    Additionally, Neo4j has recently announced updates to its graph database solutions, enhancing performance and scalability, which aligns with the rising demand for big data processing. Merger and acquisition activity continues to shape the landscape; however, concrete reports about acquisitions among these major players remain limited. Overall, the market is experiencing a surge in growth due to advancements in technology and an increasing focus on data-driven decision-making by organizations worldwide.

    Future Outlook

    Graph Analytics Market Future Outlook

    The Graph Analytics Market is projected to grow at a 17.44% CAGR from 2024 to 2035, driven by increasing data complexity, demand for real-time insights, and advancements in AI technologies.

    New opportunities lie in:

    • Develop tailored graph analytics solutions for specific industries like healthcare and finance.
    • Leverage cloud-based platforms to enhance accessibility and scalability of graph analytics tools.
    • Invest in partnerships with AI firms to integrate advanced machine learning capabilities into graph analytics.

    By 2035, the Graph Analytics Market is expected to achieve substantial growth, solidifying its role in data-driven decision-making.

    Market Segmentation

    Graph Analytics Market End User Outlook

    • BFSI
    • Retail
    • Telecommunications
    • Healthcare
    • Government

    Graph Analytics Market Regional Outlook

    • North America
    • Europe
    • South America
    • Asia Pacific
    • Middle East and Africa

    Graph Analytics Market Component Outlook

    • Software
    • Services

    Graph Analytics Market Application Outlook

    • Fraud Detection
    • Social Network Analysis
    • Recommendation Systems
    • Risk Management
    • Knowledge Graphs

    Graph Analytics Market Deployment Mode Outlook

    • On-Premises
    • Cloud-Based
    • Hybrid

    Report Scope

    Report Attribute/Metric Details
    Market Size 2022 2.92(USD Billion)
    Market Size 2023 3.43(USD Billion)
    Market Size 2032 14.6(USD Billion)
    Compound Annual Growth Rate (CAGR) 17.47% (2024 - 2032)
    Report Coverage Revenue Forecast, Competitive Landscape, Growth Factors, and Trends
    Base Year 2023
    Market Forecast Period 2024 - 2032
    Historical Data 2019 - 2023
    Market Forecast Units USD Billion
    Key Companies Profiled Amazon, Cytoscape, Google, Redis Labs, TIBCO Software, Oracle, TigerGraph, Alteryx, SAP, ArangoDB, IBM, Microsoft, Neo4j, MarkLogic, DataStax
    Segments Covered Application, Deployment Mode, End User, Component, Regional
    Key Market Opportunities 1.       Increased demand for AI integration, 2.       Expansion in social network analysis, 3.       Growth in IoT data analytics, 4.       Enhanced fraud detection solutions, 5.       Adoption by financial services providers
    Key Market Dynamics 1.       Increased data complexity, 2.       Growing demand for AI, 3.       Rising use cases in enterprises, 4.       Enhanced customer insights, 5.       Adoption of cloud technologies
    Countries Covered North America, Europe, APAC, South America, MEA

    Market Highlights

    Author
    Aarti Dhapte
    Team Lead - Research

    She holds an experience of about 6+ years in Market Research and Business Consulting, working under the spectrum of Information Communication Technology, Telecommunications and Semiconductor domains. Aarti conceptualizes and implements a scalable business strategy and provides strategic leadership to the clients. Her expertise lies in market estimation, competitive intelligence, pipeline analysis, customer assessment, etc.

    Leave a Comment

    FAQs

    What is the projected market size of the Graph Analytics Market by 2032?

    The Graph Analytics Market is expected to reach a value of 14.6 USD Billion by the year 2032.

    What is the anticipated compound annual growth rate (CAGR) for the Graph Analytics Market from 2024 to 2032?

    The expected CAGR for the Graph Analytics Market from 2024 to 2032 is 17.47%.

    Which application is projected to have the largest market size in the Graph Analytics Market by 2032?

    Fraud Detection is projected to have the largest market size, valued at 4.082 USD Billion by 2032.

    How will the North American market for Graph Analytics grow by 2032?

    The North American market for Graph Analytics is expected to grow to 5.095 USD Billion by 2032.

    Which key player in the Graph Analytics Market holds a significant market share?

    Companies like Amazon, Google, and Microsoft are among the key players with substantial market share in the Graph Analytics Market.

    What is the expected market size for Recommendation Systems in the Graph Analytics Market by 2032?

    The expected market size for Recommendation Systems in the Graph Analytics Market is projected to be 3.14 USD Billion by 2032.

    What is the projected market size for the APAC region in the Graph Analytics Market by 2032?

    The APAC region is projected to reach a market size of 2.812 USD Billion by 2032.

    How significant is the growth opportunity for Risk Management applications in the Graph Analytics Market?

    Risk Management applications are projected to grow to 2.669 USD Billion in the Graph Analytics Market by 2032.

    What is the expected market size for Knowledge Graphs in the Graph Analytics Market by 2032?

    Knowledge Graphs are expected to reach a market size of 1.962 USD Billion by 2032 in the Graph Analytics Market.

    What market size is anticipated for the South American segment of the Graph Analytics Market by 2032?

    The South American segment of the Graph Analytics Market is anticipated to reach 1.406 USD Billion by 2032.

    1. 'TABLE OF CONTENTS
    2. EXECUTIVE SUMMARY
    3. Market Overview
      1. Key Findings
      2. Market Segmentation
    4. Competitive Landscape
      1. Challenges and Opportunities
      2. Future Outlook
    5. MARKET INTRODUCTION
      1. Definition
      2. Scope of the study
        1. Research Objective
        2. Assumption
        3. Limitations
    6. RESEARCH METHODOLOGY
      1. Overview
    7. Data Mining
      1. Secondary Research
      2. Primary Research
    8. Primary Interviews and Information Gathering Process
      1. Breakdown of Primary
    9. Respondents
      1. Forecasting Model
      2. Market Size Estimation
    10. Bottom-Up Approach
      1. Top-Down Approach
      2. Data Triangulation
      3. Validation
    11. MARKET DYNAMICS
      1. Overview
      2. Drivers
      3. Restraints
      4. Opportunities
    12. MARKET FACTOR ANALYSIS
      1. Value chain Analysis
      2. Porter''s Five Forces
    13. Analysis
      1. Bargaining Power of Suppliers
        1. Bargaining Power
    14. of Buyers
      1. Threat of New Entrants
        1. Threat of Substitutes
        2. Intensity of Rivalry
      2. COVID-19 Impact Analysis
    15. Market Impact Analysis
      1. Regional Impact
        1. Opportunity and
    16. Threat Analysis
    17. GRAPH ANALYTICS MARKET, BY APPLICATION
    18. (USD BILLION)
      1. Fraud Detection
      2. Social Network Analysis
      3. Recommendation Systems
      4. Risk Management
      5. Knowledge Graphs
    19. GRAPH ANALYTICS MARKET, BY DEPLOYMENT MODE (USD BILLION)
      1. On-Premises
      2. Cloud-Based
      3. Hybrid
    20. GRAPH ANALYTICS MARKET, BY END
    21. USER (USD BILLION)
      1. BFSI
      2. Retail
      3. Telecommunications
      4. Healthcare
      5. Government
    22. GRAPH ANALYTICS MARKET, BY
    23. COMPONENT (USD BILLION)
      1. Software
      2. Services
    24. GRAPH
    25. ANALYTICS MARKET, BY REGIONAL (USD BILLION)
      1. North America
    26. US
      1. Canada
      2. Europe
        1. Germany
        2. UK
        3. France
        4. Russia
        5. Italy
        6. Spain
        7. Rest of Europe
      3. APAC
        1. China
    27. India
      1. Japan
        1. South Korea
        2. Malaysia
    28. Thailand
      1. Indonesia
        1. Rest of APAC
      2. South America
        1. Brazil
        2. Mexico
        3. Argentina
    29. Rest of South America
      1. MEA
        1. GCC Countries
    30. South Africa
      1. Rest of MEA
    31. COMPETITIVE LANDSCAPE
      1. Overview
      2. Competitive Analysis
      3. Market share Analysis
      4. Major Growth Strategy in the Graph Analytics Market
      5. Competitive
    32. Benchmarking
      1. Leading Players in Terms of Number of Developments in the
    33. Graph Analytics Market
      1. Key developments and growth strategies
    34. New Product Launch/Service Deployment
      1. Merger & Acquisitions
        1. Joint Ventures
      2. Major Players Financial Matrix
    35. Sales and Operating Income
      1. Major Players R&D Expenditure. 2023
    36. COMPANY PROFILES
      1. Amazon
        1. Financial Overview
        2. Products Offered
        3. Key Developments
        4. SWOT Analysis
        5. Key Strategies
      2. Cytoscape
        1. Financial Overview
        2. Products Offered
        3. Key Developments
        4. SWOT
    37. Analysis
      1. Key Strategies
      2. Google
        1. Financial
    38. Overview
      1. Products Offered
        1. Key Developments
    39. SWOT Analysis
      1. Key Strategies
      2. Redis Labs
    40. Financial Overview
      1. Products Offered
        1. Key Developments
        2. SWOT Analysis
        3. Key Strategies
      2. TIBCO Software
        1. Financial Overview
        2. Products Offered
        3. Key
    41. Developments
      1. SWOT Analysis
        1. Key Strategies
    42. Oracle
      1. Financial Overview
        1. Products Offered
    43. Key Developments
      1. SWOT Analysis
        1. Key Strategies
    44. TigerGraph
      1. Financial Overview
        1. Products Offered
    45. Key Developments
      1. SWOT Analysis
        1. Key Strategies
    46. Alteryx
      1. Financial Overview
        1. Products Offered
    47. Key Developments
      1. SWOT Analysis
        1. Key Strategies
    48. SAP
      1. Financial Overview
        1. Products Offered
    49. Key Developments
      1. SWOT Analysis
        1. Key Strategies
    50. ArangoDB
      1. Financial Overview
        1. Products Offered
    51. Key Developments
      1. SWOT Analysis
        1. Key Strategies
      2. IBM
        1. Financial Overview
        2. Products Offered
        3. Key Developments
        4. SWOT Analysis
        5. Key Strategies
      3. Microsoft
        1. Financial Overview
        2. Products
    52. Offered
      1. Key Developments
        1. SWOT Analysis
    53. Key Strategies
      1. Neo4j
        1. Financial Overview
    54. Products Offered
      1. Key Developments
        1. SWOT Analysis
        2. Key Strategies
      2. MarkLogic
        1. Financial Overview
        2. Products Offered
        3. Key Developments
        4. SWOT
    55. Analysis
      1. Key Strategies
      2. DataStax
        1. Financial
    56. Overview
      1. Products Offered
        1. Key Developments
    57. SWOT Analysis
      1. Key Strategies
    58. APPENDIX
      1. References
      2. Related Reports
    59. BY APPLICATION, 2019-2032 (USD BILLIONS)
    60. MARKET SIZE ESTIMATES & FORECAST, BY DEPLOYMENT MODE, 2019-2032 (USD BILLIONS)
    61. BY END USER, 2019-2032 (USD BILLIONS)
    62. MARKET SIZE ESTIMATES & FORECAST, BY COMPONENT, 2019-2032 (USD BILLIONS)
    63. REGIONAL, 2019-2032 (USD BILLIONS)
    64. ESTIMATES & FORECAST, BY APPLICATION, 2019-2032 (USD BILLIONS)
    65. US GRAPH ANALYTICS MARKET SIZE ESTIMATES & FORECAST, BY DEPLOYMENT MODE, 2019-2032
    66. (USD BILLIONS)
    67. BY END USER, 2019-2032 (USD BILLIONS)
    68. SIZE ESTIMATES & FORECAST, BY COMPONENT, 2019-2032 (USD BILLIONS)
    69. US GRAPH ANALYTICS MARKET SIZE ESTIMATES & FORECAST, BY REGIONAL, 2019-2032
    70. (USD BILLIONS)
    71. FORECAST, BY APPLICATION, 2019-2032 (USD BILLIONS)
    72. ANALYTICS MARKET SIZE ESTIMATES & FORECAST, BY DEPLOYMENT MODE, 2019-2032 (USD
    73. BILLIONS)
    74. BY END USER, 2019-2032 (USD BILLIONS)
    75. SIZE ESTIMATES & FORECAST, BY COMPONENT, 2019-2032 (USD BILLIONS)
    76. CANADA GRAPH ANALYTICS MARKET SIZE ESTIMATES & FORECAST, BY REGIONAL, 2019-2032
    77. (USD BILLIONS)
    78. FORECAST, BY APPLICATION, 2019-2032 (USD BILLIONS)
    79. ANALYTICS MARKET SIZE ESTIMATES & FORECAST, BY DEPLOYMENT MODE, 2019-2032 (USD
    80. BILLIONS)
    81. BY END USER, 2019-2032 (USD BILLIONS)
    82. SIZE ESTIMATES & FORECAST, BY COMPONENT, 2019-2032 (USD BILLIONS)
    83. EUROPE GRAPH ANALYTICS MARKET SIZE ESTIMATES & FORECAST, BY REGIONAL, 2019-2032
    84. (USD BILLIONS)
    85. FORECAST, BY APPLICATION, 2019-2032 (USD BILLIONS)
    86. ANALYTICS MARKET SIZE ESTIMATES & FORECAST, BY DEPLOYMENT MODE, 2019-2032 (USD
    87. BILLIONS)
    88. BY END USER, 2019-2032 (USD BILLIONS)
    89. SIZE ESTIMATES & FORECAST, BY COMPONENT, 2019-2032 (USD BILLIONS)
    90. GERMANY GRAPH ANALYTICS MARKET SIZE ESTIMATES & FORECAST, BY REGIONAL, 2019-2032
    91. (USD BILLIONS)
    92. BY APPLICATION, 2019-2032 (USD BILLIONS)
    93. SIZE ESTIMATES & FORECAST, BY DEPLOYMENT MODE, 2019-2032 (USD BILLIONS)
    94. 2032 (USD BILLIONS)
    95. & FORECAST, BY COMPONENT, 2019-2032 (USD BILLIONS)
    96. ANALYTICS MARKET SIZE ESTIMATES & FORECAST, BY REGIONAL, 2019-2032 (USD BILLIONS)
    97. APPLICATION, 2019-2032 (USD BILLIONS)
    98. SIZE ESTIMATES & FORECAST, BY DEPLOYMENT MODE, 2019-2032 (USD BILLIONS)
    99. USER, 2019-2032 (USD BILLIONS)
    100. ESTIMATES & FORECAST, BY COMPONENT, 2019-2032 (USD BILLIONS)
    101. FRANCE GRAPH ANALYTICS MARKET SIZE ESTIMATES & FORECAST, BY REGIONAL, 2019-2032
    102. (USD BILLIONS)
    103. FORECAST, BY APPLICATION, 2019-2032 (USD BILLIONS)
    104. ANALYTICS MARKET SIZE ESTIMATES & FORECAST, BY DEPLOYMENT MODE, 2019-2032 (USD
    105. BILLIONS)
    106. BY END USER, 2019-2032 (USD BILLIONS)
    107. SIZE ESTIMATES & FORECAST, BY COMPONENT, 2019-2032 (USD BILLIONS)
    108. RUSSIA GRAPH ANALYTICS MARKET SIZE ESTIMATES & FORECAST, BY REGIONAL, 2019-2032
    109. (USD BILLIONS)
    110. FORECAST, BY APPLICATION, 2019-2032 (USD BILLIONS)
    111. MARKET SIZE ESTIMATES & FORECAST, BY DEPLOYMENT MODE, 2019-2032 (USD BILLIONS)
    112. USER, 2019-2032 (USD BILLIONS)
    113. ESTIMATES & FORECAST, BY COMPONENT, 2019-2032 (USD BILLIONS)
    114. ITALY GRAPH ANALYTICS MARKET SIZE ESTIMATES & FORECAST, BY REGIONAL, 2019-2032
    115. (USD BILLIONS)
    116. FORECAST, BY APPLICATION, 2019-2032 (USD BILLIONS)
    117. MARKET SIZE ESTIMATES & FORECAST, BY DEPLOYMENT MODE, 2019-2032 (USD BILLIONS)
    118. USER, 2019-2032 (USD BILLIONS)
    119. ESTIMATES & FORECAST, BY COMPONENT, 2019-2032 (USD BILLIONS)
    120. SPAIN GRAPH ANALYTICS MARKET SIZE ESTIMATES & FORECAST, BY REGIONAL, 2019-2032
    121. (USD BILLIONS)
    122. & FORECAST, BY APPLICATION, 2019-2032 (USD BILLIONS)
    123. EUROPE GRAPH ANALYTICS MARKET SIZE ESTIMATES & FORECAST, BY DEPLOYMENT MODE,
    124. 2032 (USD BILLIONS)
    125. ESTIMATES & FORECAST, BY END USER, 2019-2032 (USD BILLIONS)
    126. REST OF EUROPE GRAPH ANALYTICS MARKET SIZE ESTIMATES & FORECAST, BY COMPONENT,
    127. 2032 (USD BILLIONS)
    128. ESTIMATES & FORECAST, BY REGIONAL, 2019-2032 (USD BILLIONS)
    129. APAC GRAPH ANALYTICS MARKET SIZE ESTIMATES & FORECAST, BY APPLICATION, 2019-2032
    130. (USD BILLIONS)
    131. FORECAST, BY DEPLOYMENT MODE, 2019-2032 (USD BILLIONS)
    132. ANALYTICS MARKET SIZE ESTIMATES & FORECAST, BY END USER, 2019-2032 (USD BILLIONS)
    133. 2032 (USD BILLIONS)
    134. & FORECAST, BY REGIONAL, 2019-2032 (USD BILLIONS)
    135. ANALYTICS MARKET SIZE ESTIMATES & FORECAST, BY APPLICATION, 2019-2032 (USD BILLIONS)
    136. MODE, 2019-2032 (USD BILLIONS)
    137. ESTIMATES & FORECAST, BY END USER, 2019-2032 (USD BILLIONS)
    138. CHINA GRAPH ANALYTICS MARKET SIZE ESTIMATES & FORECAST, BY COMPONENT, 2019-2032
    139. (USD BILLIONS)
    140. FORECAST, BY REGIONAL, 2019-2032 (USD BILLIONS)
    141. MARKET SIZE ESTIMATES & FORECAST, BY APPLICATION, 2019-2032 (USD BILLIONS)
    142. MODE, 2019-2032 (USD BILLIONS)
    143. ESTIMATES & FORECAST, BY END USER, 2019-2032 (USD BILLIONS)
    144. INDIA GRAPH ANALYTICS MARKET SIZE ESTIMATES & FORECAST, BY COMPONENT, 2019-2032
    145. (USD BILLIONS)
    146. FORECAST, BY REGIONAL, 2019-2032 (USD BILLIONS)
    147. MARKET SIZE ESTIMATES & FORECAST, BY APPLICATION, 2019-2032 (USD BILLIONS)
    148. MODE, 2019-2032 (USD BILLIONS)
    149. ESTIMATES & FORECAST, BY END USER, 2019-2032 (USD BILLIONS)
    150. JAPAN GRAPH ANALYTICS MARKET SIZE ESTIMATES & FORECAST, BY COMPONENT, 2019-2032
    151. (USD BILLIONS)
    152. FORECAST, BY REGIONAL, 2019-2032 (USD BILLIONS)
    153. ANALYTICS MARKET SIZE ESTIMATES & FORECAST, BY APPLICATION, 2019-2032 (USD BILLIONS)
    154. BY DEPLOYMENT MODE, 2019-2032 (USD BILLIONS)
    155. MARKET SIZE ESTIMATES & FORECAST, BY END USER, 2019-2032 (USD BILLIONS)
    156. COMPONENT, 2019-2032 (USD BILLIONS)
    157. MARKET SIZE ESTIMATES & FORECAST, BY REGIONAL, 2019-2032 (USD BILLIONS)
    158. 2032 (USD BILLIONS)
    159. & FORECAST, BY DEPLOYMENT MODE, 2019-2032 (USD BILLIONS)
    160. GRAPH ANALYTICS MARKET SIZE ESTIMATES & FORECAST, BY END USER, 2019-2032 (USD
    161. BILLIONS)
    162. BY COMPONENT, 2019-2032 (USD BILLIONS)
    163. MARKET SIZE ESTIMATES & FORECAST, BY REGIONAL, 2019-2032 (USD BILLIONS)
    164. 2032 (USD BILLIONS)
    165. & FORECAST, BY DEPLOYMENT MODE, 2019-2032 (USD BILLIONS)
    166. GRAPH ANALYTICS MARKET SIZE ESTIMATES & FORECAST, BY END USER, 2019-2032 (USD
    167. BILLIONS)
    168. BY COMPONENT, 2019-2032 (USD BILLIONS)
    169. MARKET SIZE ESTIMATES & FORECAST, BY REGIONAL, 2019-2032 (USD BILLIONS)
    170. 2032 (USD BILLIONS)
    171. & FORECAST, BY DEPLOYMENT MODE, 2019-2032 (USD BILLIONS)
    172. GRAPH ANALYTICS MARKET SIZE ESTIMATES & FORECAST, BY END USER, 2019-2032 (USD
    173. BILLIONS)
    174. FORECAST, BY COMPONENT, 2019-2032 (USD BILLIONS)
    175. ANALYTICS MARKET SIZE ESTIMATES & FORECAST, BY REGIONAL, 2019-2032 (USD BILLIONS)
    176. BY APPLICATION, 2019-2032 (USD BILLIONS)
    177. MARKET SIZE ESTIMATES & FORECAST, BY DEPLOYMENT MODE, 2019-2032 (USD BILLIONS)
    178. BY END USER, 2019-2032 (USD BILLIONS)
    179. MARKET SIZE ESTIMATES & FORECAST, BY COMPONENT, 2019-2032 (USD BILLIONS)
    180. BY REGIONAL, 2019-2032 (USD BILLIONS)
    181. MARKET SIZE ESTIMATES & FORECAST, BY APPLICATION, 2019-2032 (USD BILLIONS)
    182. BY DEPLOYMENT MODE, 2019-2032 (USD BILLIONS)
    183. ANALYTICS MARKET SIZE ESTIMATES & FORECAST, BY END USER, 2019-2032 (USD BILLIONS)
    184. BY COMPONENT, 2019-2032 (USD BILLIONS)
    185. MARKET SIZE ESTIMATES & FORECAST, BY REGIONAL, 2019-2032 (USD BILLIONS)
    186. 2032 (USD BILLIONS)
    187. & FORECAST, BY DEPLOYMENT MODE, 2019-2032 (USD BILLIONS)
    188. GRAPH ANALYTICS MARKET SIZE ESTIMATES & FORECAST, BY END USER, 2019-2032 (USD
    189. BILLIONS)
    190. BY COMPONENT, 2019-2032 (USD BILLIONS)
    191. SIZE ESTIMATES & FORECAST, BY REGIONAL, 2019-2032 (USD BILLIONS)
    192. MEXICO GRAPH ANALYTICS MARKET SIZE ESTIMATES & FORECAST, BY APPLICATION,
    193. 2032 (USD BILLIONS)
    194. & FORECAST, BY DEPLOYMENT MODE, 2019-2032 (USD BILLIONS)
    195. GRAPH ANALYTICS MARKET SIZE ESTIMATES & FORECAST, BY END USER, 2019-2032 (USD
    196. BILLIONS)
    197. BY COMPONENT, 2019-2032 (USD BILLIONS)
    198. SIZE ESTIMATES & FORECAST, BY REGIONAL, 2019-2032 (USD BILLIONS)
    199. ARGENTINA GRAPH ANALYTICS MARKET SIZE ESTIMATES & FORECAST, BY APPLICATION,
    200. 2032 (USD BILLIONS)
    201. ESTIMATES & FORECAST, BY DEPLOYMENT MODE, 2019-2032 (USD BILLIONS)
    202. ARGENTINA GRAPH ANALYTICS MARKET SIZE ESTIMATES & FORECAST, BY END USER,
    203. 2032 (USD BILLIONS)
    204. ESTIMATES & FORECAST, BY COMPONENT, 2019-2032 (USD BILLIONS)
    205. ARGENTINA GRAPH ANALYTICS MARKET SIZE ESTIMATES & FORECAST, BY REGIONAL, 2019-2032
    206. (USD BILLIONS)
    207. ESTIMATES & FORECAST, BY APPLICATION, 2019-2032 (USD BILLIONS)
    208. REST OF SOUTH AMERICA GRAPH ANALYTICS MARKET SIZE ESTIMATES & FORECAST, BY DEPLOYMENT
    209. MODE, 2019-2032 (USD BILLIONS)
    210. MARKET SIZE ESTIMATES & FORECAST, BY END USER, 2019-2032 (USD BILLIONS)
    211. BY COMPONENT, 2019-2032 (USD BILLIONS)
    212. ANALYTICS MARKET SIZE ESTIMATES & FORECAST, BY REGIONAL, 2019-2032 (USD BILLIONS)
    213. 2032 (USD BILLIONS)
    214. & FORECAST, BY DEPLOYMENT MODE, 2019-2032 (USD BILLIONS)
    215. GRAPH ANALYTICS MARKET SIZE ESTIMATES & FORECAST, BY END USER, 2019-2032 (USD
    216. BILLIONS)
    217. BY COMPONENT, 2019-2032 (USD BILLIONS)
    218. SIZE ESTIMATES & FORECAST, BY REGIONAL, 2019-2032 (USD BILLIONS)
    219. GCC COUNTRIES GRAPH ANALYTICS MARKET SIZE ESTIMATES & FORECAST, BY APPLICATION,
    220. 2032 (USD BILLIONS)
    221. ESTIMATES & FORECAST, BY DEPLOYMENT MODE, 2019-2032 (USD BILLIONS)
    222. GCC COUNTRIES GRAPH ANALYTICS MARKET SIZE ESTIMATES & FORECAST, BY END
    223. USER, 2019-2032 (USD BILLIONS)
    224. SIZE ESTIMATES & FORECAST, BY COMPONENT, 2019-2032 (USD BILLIONS)
    225. GCC COUNTRIES GRAPH ANALYTICS MARKET SIZE ESTIMATES & FORECAST, BY REGIONAL,
    226. 2032 (USD BILLIONS)
    227. ESTIMATES & FORECAST, BY APPLICATION, 2019-2032 (USD BILLIONS)
    228. SOUTH AFRICA GRAPH ANALYTICS MARKET SIZE ESTIMATES & FORECAST, BY DEPLOYMENT
    229. MODE, 2019-2032 (USD BILLIONS)
    230. SIZE ESTIMATES & FORECAST, BY END USER, 2019-2032 (USD BILLIONS)
    231. SOUTH AFRICA GRAPH ANALYTICS MARKET SIZE ESTIMATES & FORECAST, BY COMPONENT,
    232. 2032 (USD BILLIONS)
    233. ESTIMATES & FORECAST, BY REGIONAL, 2019-2032 (USD BILLIONS)
    234. REST OF MEA GRAPH ANALYTICS MARKET SIZE ESTIMATES & FORECAST, BY APPLICATION,
    235. 2032 (USD BILLIONS)
    236. ESTIMATES & FORECAST, BY DEPLOYMENT MODE, 2019-2032 (USD BILLIONS)
    237. REST OF MEA GRAPH ANALYTICS MARKET SIZE ESTIMATES & FORECAST, BY END USER,
    238. 2032 (USD BILLIONS)
    239. ESTIMATES & FORECAST, BY COMPONENT, 2019-2032 (USD BILLIONS)
    240. REST OF MEA GRAPH ANALYTICS MARKET SIZE ESTIMATES & FORECAST, BY REGIONAL, 2019-2032
    241. (USD BILLIONS)
    242. MARKET SYNOPSIS
    243. US GRAPH ANALYTICS MARKET ANALYSIS BY DEPLOYMENT MODE
    244. MARKET ANALYSIS BY END USER
    245. COMPONENT
    246. CANADA GRAPH ANALYTICS MARKET ANALYSIS BY APPLICATION
    247. GRAPH ANALYTICS MARKET ANALYSIS BY DEPLOYMENT MODE
    248. ANALYTICS MARKET ANALYSIS BY END USER
    249. ANALYSIS BY COMPONENT
    250. REGIONAL
    251. GERMANY GRAPH ANALYTICS MARKET ANALYSIS BY APPLICATION
    252. GRAPH ANALYTICS MARKET ANALYSIS BY DEPLOYMENT MODE
    253. ANALYTICS MARKET ANALYSIS BY END USER
    254. ANALYSIS BY COMPONENT
    255. REGIONAL
    256. UK GRAPH ANALYTICS MARKET ANALYSIS BY END USER
    257. MARKET ANALYSIS BY COMPONENT
    258. BY REGIONAL
    259. FRANCE GRAPH ANALYTICS MARKET ANALYSIS BY END USER
    260. ANALYTICS MARKET ANALYSIS BY COMPONENT
    261. ANALYSIS BY REGIONAL
    262. APPLICATION
    263. MODE
    264. RUSSIA GRAPH ANALYTICS MARKET ANALYSIS BY COMPONENT
    265. GRAPH ANALYTICS MARKET ANALYSIS BY REGIONAL
    266. MARKET ANALYSIS BY APPLICATION
    267. BY DEPLOYMENT MODE
    268. USER
    269. ITALY GRAPH ANALYTICS MARKET ANALYSIS BY REGIONAL
    270. ANALYTICS MARKET ANALYSIS BY APPLICATION
    271. MARKET ANALYSIS BY DEPLOYMENT MODE
    272. ANALYSIS BY END USER
    273. REST OF EUROPE GRAPH ANALYTICS MARKET ANALYSIS BY APPLICATION
    274. REST OF EUROPE GRAPH ANALYTICS MARKET ANALYSIS BY DEPLOYMENT MODE
    275. REST OF EUROPE GRAPH ANALYTICS MARKET ANALYSIS BY END USER
    276. OF EUROPE GRAPH ANALYTICS MARKET ANALYSIS BY COMPONENT
    277. EUROPE GRAPH ANALYTICS MARKET ANALYSIS BY REGIONAL
    278. MARKET ANALYSIS
    279. CHINA GRAPH ANALYTICS MARKET ANALYSIS BY END USER
    280. ANALYTICS MARKET ANALYSIS BY COMPONENT
    281. ANALYSIS BY REGIONAL
    282. INDIA GRAPH ANALYTICS MARKET ANALYSIS BY END USER
    283. ANALYTICS MARKET ANALYSIS BY COMPONENT
    284. ANALYSIS BY REGIONAL
    285. JAPAN GRAPH ANALYTICS MARKET ANALYSIS BY END USER
    286. ANALYTICS MARKET ANALYSIS BY COMPONENT
    287. ANALYSIS BY REGIONAL
    288. BY APPLICATION
    289. MODE
    290. SOUTH KOREA GRAPH ANALYTICS MARKET ANALYSIS BY REGIONAL
    291. GRAPH ANALYTICS MARKET ANALYSIS BY APPLICATION
    292. MARKET ANALYSIS BY DEPLOYMENT MODE
    293. ANALYSIS BY END USER
    294. COMPONENT
    295. THAILAND GRAPH ANALYTICS MARKET ANALYSIS BY DEPLOYMENT MODE
    296. THAILAND GRAPH ANALYTICS MARKET ANALYSIS BY END USER
    297. ANALYTICS MARKET ANALYSIS BY COMPONENT
    298. MARKET ANALYSIS BY REGIONAL
    299. BY APPLICATION
    300. MODE
    301. INDONESIA GRAPH ANALYTICS MARKET ANALYSIS BY REGIONAL
    302. OF APAC GRAPH ANALYTICS MARKET ANALYSIS BY APPLICATION
    303. APAC GRAPH ANALYTICS MARKET ANALYSIS BY DEPLOYMENT MODE
    304. APAC GRAPH ANALYTICS MARKET ANALYSIS BY END USER
    305. ANALYTICS MARKET ANALYSIS BY COMPONENT
    306. MARKET ANALYSIS BY REGIONAL
    307. ANALYSIS
    308. BRAZIL GRAPH ANALYTICS MARKET ANALYSIS BY END USER
    309. ANALYTICS MARKET ANALYSIS BY COMPONENT
    310. ANALYSIS BY REGIONAL
    311. APPLICATION
    312. MODE
    313. MEXICO GRAPH ANALYTICS MARKET ANALYSIS BY COMPONENT
    314. GRAPH ANALYTICS MARKET ANALYSIS BY REGIONAL
    315. MARKET ANALYSIS BY APPLICATION
    316. ANALYSIS BY DEPLOYMENT MODE
    317. BY END USER
    318. REST OF SOUTH AMERICA GRAPH ANALYTICS MARKET ANALYSIS BY APPLICATION
    319. REST OF SOUTH AMERICA GRAPH ANALYTICS MARKET ANALYSIS BY DEPLOYMENT MODE
    320. GRAPH ANALYTICS MARKET ANALYSIS BY APPLICATION
    321. ANALYTICS MARKET ANALYSIS BY DEPLOYMENT MODE
    322. ANALYTICS MARKET ANALYSIS BY END USER
    323. MARKET ANALYSIS BY COMPONENT
    324. ANALYSIS BY REGIONAL
    325. BY APPLICATION
    326. DEPLOYMENT MODE
    327. END USER
    328. REST OF MEA GRAPH ANALYTICS MARKET ANALYSIS BY APPLICATION
    329. REST OF MEA GRAPH ANALYTICS MARKET ANALYSIS BY DEPLOYMENT MODE
    330. REST OF MEA GRAPH ANALYTICS MARKET ANALYSIS BY END USER
    331. MEA GRAPH ANALYTICS MARKET ANALYSIS BY COMPONENT
    332. ANALYTICS MARKET ANALYSIS BY REGIONAL
    333. ANALYTICS MARKET
    334. ANALYSIS OF GRAPH ANALYTICS MARKET
    335. ANALYTICS MARKET
    336. GRAPH ANALYTICS MARKET, BY APPLICATION, 2024 (% SHARE)
    337. MARKET, BY APPLICATION, 2019 TO 2032 (USD Billions)
    338. MARKET, BY DEPLOYMENT MODE, 2024 (% SHARE)
    339. BY DEPLOYMENT MODE, 2019 TO 2032 (USD Billions)
    340. MARKET, BY END USER, 2024 (% SHARE)
    341. END USER, 2019 TO 2032 (USD Billions)
    342. BY COMPONENT, 2024 (% SHARE)
    343. TO 2032 (USD Billions)
    344. (% SHARE)
    345. (USD Billions)

    Graph Analytics Market Segmentation


    • Graph Analytics Market By Application (USD Billion, 2019-2032)
      • Fraud Detection
      • Social Network Analysis
      • Recommendation Systems
      • Risk Management
      • Knowledge Graphs


    • Graph Analytics Market By Deployment Mode (USD Billion, 2019-2032)
      • On-Premises
      • Cloud-Based
      • Hybrid


    • Graph Analytics Market By End User (USD Billion, 2019-2032)
      • BFSI
      • Retail
      • Telecommunications
      • Healthcare
      • Government


    • Graph Analytics Market By Component (USD Billion, 2019-2032)
      • Software
      • Services


    • Graph Analytics Market By Regional (USD Billion, 2019-2032)
      • North America
      • Europe
      • South America
      • Asia Pacific
      • Middle East and Africa


    Graph Analytics Market Regional Outlook (USD Billion, 2019-2032)


    • North America Outlook (USD Billion, 2019-2032)
      • North America Graph Analytics Market by Application Type
        • Fraud Detection
        • Social Network Analysis
        • Recommendation Systems
        • Risk Management
        • Knowledge Graphs
      • North America Graph Analytics Market by Deployment Mode Type
        • On-Premises
        • Cloud-Based
        • Hybrid
      • North America Graph Analytics Market by End User Type
        • BFSI
        • Retail
        • Telecommunications
        • Healthcare
        • Government
      • North America Graph Analytics Market by Component Type
        • Software
        • Services
      • North America Graph Analytics Market by Regional Type
        • US
        • Canada
      • US Outlook (USD Billion, 2019-2032)
      • US Graph Analytics Market by Application Type
        • Fraud Detection
        • Social Network Analysis
        • Recommendation Systems
        • Risk Management
        • Knowledge Graphs
      • US Graph Analytics Market by Deployment Mode Type
        • On-Premises
        • Cloud-Based
        • Hybrid
      • US Graph Analytics Market by End User Type
        • BFSI
        • Retail
        • Telecommunications
        • Healthcare
        • Government
      • US Graph Analytics Market by Component Type
        • Software
        • Services
      • CANADA Outlook (USD Billion, 2019-2032)
      • CANADA Graph Analytics Market by Application Type
        • Fraud Detection
        • Social Network Analysis
        • Recommendation Systems
        • Risk Management
        • Knowledge Graphs
      • CANADA Graph Analytics Market by Deployment Mode Type
        • On-Premises
        • Cloud-Based
        • Hybrid
      • CANADA Graph Analytics Market by End User Type
        • BFSI
        • Retail
        • Telecommunications
        • Healthcare
        • Government
      • CANADA Graph Analytics Market by Component Type
        • Software
        • Services
      • Europe Outlook (USD Billion, 2019-2032)
        • Europe Graph Analytics Market by Application Type
          • Fraud Detection
          • Social Network Analysis
          • Recommendation Systems
          • Risk Management
          • Knowledge Graphs
        • Europe Graph Analytics Market by Deployment Mode Type
          • On-Premises
          • Cloud-Based
          • Hybrid
        • Europe Graph Analytics Market by End User Type
          • BFSI
          • Retail
          • Telecommunications
          • Healthcare
          • Government
        • Europe Graph Analytics Market by Component Type
          • Software
          • Services
        • Europe Graph Analytics Market by Regional Type
          • Germany
          • UK
          • France
          • Russia
          • Italy
          • Spain
          • Rest of Europe
        • GERMANY Outlook (USD Billion, 2019-2032)
        • GERMANY Graph Analytics Market by Application Type
          • Fraud Detection
          • Social Network Analysis
          • Recommendation Systems
          • Risk Management
          • Knowledge Graphs
        • GERMANY Graph Analytics Market by Deployment Mode Type
          • On-Premises
          • Cloud-Based
          • Hybrid
        • GERMANY Graph Analytics Market by End User Type
          • BFSI
          • Retail
          • Telecommunications
          • Healthcare
          • Government
        • GERMANY Graph Analytics Market by Component Type
          • Software
          • Services
        • UK Outlook (USD Billion, 2019-2032)
        • UK Graph Analytics Market by Application Type
          • Fraud Detection
          • Social Network Analysis
          • Recommendation Systems
          • Risk Management
          • Knowledge Graphs
        • UK Graph Analytics Market by Deployment Mode Type
          • On-Premises
          • Cloud-Based
          • Hybrid
        • UK Graph Analytics Market by End User Type
          • BFSI
          • Retail
          • Telecommunications
          • Healthcare
          • Government
        • UK Graph Analytics Market by Component Type
          • Software
          • Services
        • FRANCE Outlook (USD Billion, 2019-2032)
        • FRANCE Graph Analytics Market by Application Type
          • Fraud Detection
          • Social Network Analysis
          • Recommendation Systems
          • Risk Management
          • Knowledge Graphs
        • FRANCE Graph Analytics Market by Deployment Mode Type
          • On-Premises
          • Cloud-Based
          • Hybrid
        • FRANCE Graph Analytics Market by End User Type
          • BFSI
          • Retail
          • Telecommunications
          • Healthcare
          • Government
        • FRANCE Graph Analytics Market by Component Type
          • Software
          • Services
        • RUSSIA Outlook (USD Billion, 2019-2032)
        • RUSSIA Graph Analytics Market by Application Type
          • Fraud Detection
          • Social Network Analysis
          • Recommendation Systems
          • Risk Management
          • Knowledge Graphs
        • RUSSIA Graph Analytics Market by Deployment Mode Type
          • On-Premises
          • Cloud-Based
          • Hybrid
        • RUSSIA Graph Analytics Market by End User Type
          • BFSI
          • Retail
          • Telecommunications
          • Healthcare
          • Government
        • RUSSIA Graph Analytics Market by Component Type
          • Software
          • Services
        • ITALY Outlook (USD Billion, 2019-2032)
        • ITALY Graph Analytics Market by Application Type
          • Fraud Detection
          • Social Network Analysis
          • Recommendation Systems
          • Risk Management
          • Knowledge Graphs
        • ITALY Graph Analytics Market by Deployment Mode Type
          • On-Premises
          • Cloud-Based
          • Hybrid
        • ITALY Graph Analytics Market by End User Type
          • BFSI
          • Retail
          • Telecommunications
          • Healthcare
          • Government
        • ITALY Graph Analytics Market by Component Type
          • Software
          • Services
        • SPAIN Outlook (USD Billion, 2019-2032)
        • SPAIN Graph Analytics Market by Application Type
          • Fraud Detection
          • Social Network Analysis
          • Recommendation Systems
          • Risk Management
          • Knowledge Graphs
        • SPAIN Graph Analytics Market by Deployment Mode Type
          • On-Premises
          • Cloud-Based
          • Hybrid
        • SPAIN Graph Analytics Market by End User Type
          • BFSI
          • Retail
          • Telecommunications
          • Healthcare
          • Government
        • SPAIN Graph Analytics Market by Component Type
          • Software
          • Services
        • REST OF EUROPE Outlook (USD Billion, 2019-2032)
        • REST OF EUROPE Graph Analytics Market by Application Type
          • Fraud Detection
          • Social Network Analysis
          • Recommendation Systems
          • Risk Management
          • Knowledge Graphs
        • REST OF EUROPE Graph Analytics Market by Deployment Mode Type
          • On-Premises
          • Cloud-Based
          • Hybrid
        • REST OF EUROPE Graph Analytics Market by End User Type
          • BFSI
          • Retail
          • Telecommunications
          • Healthcare
          • Government
        • REST OF EUROPE Graph Analytics Market by Component Type
          • Software
          • Services
        • APAC Outlook (USD Billion, 2019-2032)
          • APAC Graph Analytics Market by Application Type
            • Fraud Detection
            • Social Network Analysis
            • Recommendation Systems
            • Risk Management
            • Knowledge Graphs
          • APAC Graph Analytics Market by Deployment Mode Type
            • On-Premises
            • Cloud-Based
            • Hybrid
          • APAC Graph Analytics Market by End User Type
            • BFSI
            • Retail
            • Telecommunications
            • Healthcare
            • Government
          • APAC Graph Analytics Market by Component Type
            • Software
            • Services
          • APAC Graph Analytics Market by Regional Type
            • China
            • India
            • Japan
            • South Korea
            • Malaysia
            • Thailand
            • Indonesia
            • Rest of APAC
          • CHINA Outlook (USD Billion, 2019-2032)
          • CHINA Graph Analytics Market by Application Type
            • Fraud Detection
            • Social Network Analysis
            • Recommendation Systems
            • Risk Management
            • Knowledge Graphs
          • CHINA Graph Analytics Market by Deployment Mode Type
            • On-Premises
            • Cloud-Based
            • Hybrid
          • CHINA Graph Analytics Market by End User Type
            • BFSI
            • Retail
            • Telecommunications
            • Healthcare
            • Government
          • CHINA Graph Analytics Market by Component Type
            • Software
            • Services
          • INDIA Outlook (USD Billion, 2019-2032)
          • INDIA Graph Analytics Market by Application Type
            • Fraud Detection
            • Social Network Analysis
            • Recommendation Systems
            • Risk Management
            • Knowledge Graphs
          • INDIA Graph Analytics Market by Deployment Mode Type
            • On-Premises
            • Cloud-Based
            • Hybrid
          • INDIA Graph Analytics Market by End User Type
            • BFSI
            • Retail
            • Telecommunications
            • Healthcare
            • Government
          • INDIA Graph Analytics Market by Component Type
            • Software
            • Services
          • JAPAN Outlook (USD Billion, 2019-2032)
          • JAPAN Graph Analytics Market by Application Type
            • Fraud Detection
            • Social Network Analysis
            • Recommendation Systems
            • Risk Management
            • Knowledge Graphs
          • JAPAN Graph Analytics Market by Deployment Mode Type
            • On-Premises
            • Cloud-Based
            • Hybrid
          • JAPAN Graph Analytics Market by End User Type
            • BFSI
            • Retail
            • Telecommunications
            • Healthcare
            • Government
          • JAPAN Graph Analytics Market by Component Type
            • Software
            • Services
          • SOUTH KOREA Outlook (USD Billion, 2019-2032)
          • SOUTH KOREA Graph Analytics Market by Application Type
            • Fraud Detection
            • Social Network Analysis
            • Recommendation Systems
            • Risk Management
            • Knowledge Graphs
          • SOUTH KOREA Graph Analytics Market by Deployment Mode Type
            • On-Premises
            • Cloud-Based
            • Hybrid
          • SOUTH KOREA Graph Analytics Market by End User Type
            • BFSI
            • Retail
            • Telecommunications
            • Healthcare
            • Government
          • SOUTH KOREA Graph Analytics Market by Component Type
            • Software
            • Services
          • MALAYSIA Outlook (USD Billion, 2019-2032)
          • MALAYSIA Graph Analytics Market by Application Type
            • Fraud Detection
            • Social Network Analysis
            • Recommendation Systems
            • Risk Management
            • Knowledge Graphs
          • MALAYSIA Graph Analytics Market by Deployment Mode Type
            • On-Premises
            • Cloud-Based
            • Hybrid
          • MALAYSIA Graph Analytics Market by End User Type
            • BFSI
            • Retail
            • Telecommunications
            • Healthcare
            • Government
          • MALAYSIA Graph Analytics Market by Component Type
            • Software
            • Services
          • THAILAND Outlook (USD Billion, 2019-2032)
          • THAILAND Graph Analytics Market by Application Type
            • Fraud Detection
            • Social Network Analysis
            • Recommendation Systems
            • Risk Management
            • Knowledge Graphs
          • THAILAND Graph Analytics Market by Deployment Mode Type
            • On-Premises
            • Cloud-Based
            • Hybrid
          • THAILAND Graph Analytics Market by End User Type
            • BFSI
            • Retail
            • Telecommunications
            • Healthcare
            • Government
          • THAILAND Graph Analytics Market by Component Type
            • Software
            • Services
          • INDONESIA Outlook (USD Billion, 2019-2032)
          • INDONESIA Graph Analytics Market by Application Type
            • Fraud Detection
            • Social Network Analysis
            • Recommendation Systems
            • Risk Management
            • Knowledge Graphs
          • INDONESIA Graph Analytics Market by Deployment Mode Type
            • On-Premises
            • Cloud-Based
            • Hybrid
          • INDONESIA Graph Analytics Market by End User Type
            • BFSI
            • Retail
            • Telecommunications
            • Healthcare
            • Government
          • INDONESIA Graph Analytics Market by Component Type
            • Software
            • Services
          • REST OF APAC Outlook (USD Billion, 2019-2032)
          • REST OF APAC Graph Analytics Market by Application Type
            • Fraud Detection
            • Social Network Analysis
            • Recommendation Systems
            • Risk Management
            • Knowledge Graphs
          • REST OF APAC Graph Analytics Market by Deployment Mode Type
            • On-Premises
            • Cloud-Based
            • Hybrid
          • REST OF APAC Graph Analytics Market by End User Type
            • BFSI
            • Retail
            • Telecommunications
            • Healthcare
            • Government
          • REST OF APAC Graph Analytics Market by Component Type
            • Software
            • Services
          • South America Outlook (USD Billion, 2019-2032)
            • South America Graph Analytics Market by Application Type
              • Fraud Detection
              • Social Network Analysis
              • Recommendation Systems
              • Risk Management
              • Knowledge Graphs
            • South America Graph Analytics Market by Deployment Mode Type
              • On-Premises
              • Cloud-Based
              • Hybrid
            • South America Graph Analytics Market by End User Type
              • BFSI
              • Retail
              • Telecommunications
              • Healthcare
              • Government
            • South America Graph Analytics Market by Component Type
              • Software
              • Services
            • South America Graph Analytics Market by Regional Type
              • Brazil
              • Mexico
              • Argentina
              • Rest of South America
            • BRAZIL Outlook (USD Billion, 2019-2032)
            • BRAZIL Graph Analytics Market by Application Type
              • Fraud Detection
              • Social Network Analysis
              • Recommendation Systems
              • Risk Management
              • Knowledge Graphs
            • BRAZIL Graph Analytics Market by Deployment Mode Type
              • On-Premises
              • Cloud-Based
              • Hybrid
            • BRAZIL Graph Analytics Market by End User Type
              • BFSI
              • Retail
              • Telecommunications
              • Healthcare
              • Government
            • BRAZIL Graph Analytics Market by Component Type
              • Software
              • Services
            • MEXICO Outlook (USD Billion, 2019-2032)
            • MEXICO Graph Analytics Market by Application Type
              • Fraud Detection
              • Social Network Analysis
              • Recommendation Systems
              • Risk Management
              • Knowledge Graphs
            • MEXICO Graph Analytics Market by Deployment Mode Type
              • On-Premises
              • Cloud-Based
              • Hybrid
            • MEXICO Graph Analytics Market by End User Type
              • BFSI
              • Retail
              • Telecommunications
              • Healthcare
              • Government
            • MEXICO Graph Analytics Market by Component Type
              • Software
              • Services
            • ARGENTINA Outlook (USD Billion, 2019-2032)
            • ARGENTINA Graph Analytics Market by Application Type
              • Fraud Detection
              • Social Network Analysis
              • Recommendation Systems
              • Risk Management
              • Knowledge Graphs
            • ARGENTINA Graph Analytics Market by Deployment Mode Type
              • On-Premises
              • Cloud-Based
              • Hybrid
            • ARGENTINA Graph Analytics Market by End User Type
              • BFSI
              • Retail
              • Telecommunications
              • Healthcare
              • Government
            • ARGENTINA Graph Analytics Market by Component Type
              • Software
              • Services
            • REST OF SOUTH AMERICA Outlook (USD Billion, 2019-2032)
            • REST OF SOUTH AMERICA Graph Analytics Market by Application Type
              • Fraud Detection
              • Social Network Analysis
              • Recommendation Systems
              • Risk Management
              • Knowledge Graphs
            • REST OF SOUTH AMERICA Graph Analytics Market by Deployment Mode Type
              • On-Premises
              • Cloud-Based
              • Hybrid
            • REST OF SOUTH AMERICA Graph Analytics Market by End User Type
              • BFSI
              • Retail
              • Telecommunications
              • Healthcare
              • Government
            • REST OF SOUTH AMERICA Graph Analytics Market by Component Type
              • Software
              • Services
            • MEA Outlook (USD Billion, 2019-2032)
              • MEA Graph Analytics Market by Application Type
                • Fraud Detection
                • Social Network Analysis
                • Recommendation Systems
                • Risk Management
                • Knowledge Graphs
              • MEA Graph Analytics Market by Deployment Mode Type
                • On-Premises
                • Cloud-Based
                • Hybrid
              • MEA Graph Analytics Market by End User Type
                • BFSI
                • Retail
                • Telecommunications
                • Healthcare
                • Government
              • MEA Graph Analytics Market by Component Type
                • Software
                • Services
              • MEA Graph Analytics Market by Regional Type
                • GCC Countries
                • South Africa
                • Rest of MEA
              • GCC COUNTRIES Outlook (USD Billion, 2019-2032)
              • GCC COUNTRIES Graph Analytics Market by Application Type
                • Fraud Detection
                • Social Network Analysis
                • Recommendation Systems
                • Risk Management
                • Knowledge Graphs
              • GCC COUNTRIES Graph Analytics Market by Deployment Mode Type
                • On-Premises
                • Cloud-Based
                • Hybrid
              • GCC COUNTRIES Graph Analytics Market by End User Type
                • BFSI
                • Retail
                • Telecommunications
                • Healthcare
                • Government
              • GCC COUNTRIES Graph Analytics Market by Component Type
                • Software
                • Services
              • SOUTH AFRICA Outlook (USD Billion, 2019-2032)
              • SOUTH AFRICA Graph Analytics Market by Application Type
                • Fraud Detection
                • Social Network Analysis
                • Recommendation Systems
                • Risk Management
                • Knowledge Graphs
              • SOUTH AFRICA Graph Analytics Market by Deployment Mode Type
                • On-Premises
                • Cloud-Based
                • Hybrid
              • SOUTH AFRICA Graph Analytics Market by End User Type
                • BFSI
                • Retail
                • Telecommunications
                • Healthcare
                • Government
              • SOUTH AFRICA Graph Analytics Market by Component Type
                • Software
                • Services
              • REST OF MEA Outlook (USD Billion, 2019-2032)
              • REST OF MEA Graph Analytics Market by Application Type
                • Fraud Detection
                • Social Network Analysis
                • Recommendation Systems
                • Risk Management
                • Knowledge Graphs
              • REST OF MEA Graph Analytics Market by Deployment Mode Type
                • On-Premises
                • Cloud-Based
                • Hybrid
              • REST OF MEA Graph Analytics Market by End User Type
                • BFSI
                • Retail
                • Telecommunications
                • Healthcare
                • Government
              • REST OF MEA Graph Analytics Market by Component Type
                • Software
                • Services
    Graph Analytics Market Research Report - Global Forecast till 2032 Infographic
    Free Sample Request

    Kindly complete the form below to receive a free sample of this Report

    Customer Strories

    “I am very pleased with how market segments have been defined in a relevant way for my purposes (such as "Portable Freezers & refrigerators" and "last-mile"). In general the report is well structured. Thanks very much for your efforts.”

    Victoria Milne Founder
    Case Study

    Chemicals and Materials