• Cat-intel
  • MedIntelliX
  • Resources
  • About Us
  • Request Free Sample ×

    Kindly complete the form below to receive a free sample of this Report

    Leading companies partner with us for data-driven Insights

    clients tt-cursor

    GCC Graph Analytics Market

    ID: MRFR/ICT/63476-HCR
    200 Pages
    Aarti Dhapte
    September 2025

    GCC Graph Analytics Market Research Report By Application (Fraud Detection, Social Network Analysis, Recommendation Systems, Risk Management, Knowledge Graphs), By Deployment Mode (On-Premises, Cloud-Based, Hybrid), By End User (BFSI, Retail, Telecommunications, Healthcare, Government) and By Component (Software, Services)- Forecast to 2035

    Share:
    Download PDF ×

    We do not share your information with anyone. However, we may send you emails based on your report interest from time to time. You may contact us at any time to opt-out.

    Purchase Options
    $ 4,950.0
    $ 5,950.0
    $ 7,250.0
    Table of Contents

    GCC Graph Analytics Market Summary

    Key Market Trends & Highlights

    GCC Graph Analytics Market Trends

    The GCC Graph Analytics Market is experiencing significant growth driven by increasing data generation and the need for effective data processing and analysis frameworks. Governments in the GCC region are heavily investing in digital transformation initiatives, emphasizing the importance of data analytics in understanding complex relationships within large data sets. 

    This push is bolstered by the rise of smart city projects, which aim to harness data for improving urban environments, thereby creating a substantial demand for graph analytics solutions. Companies within the GCC are exploring opportunities in sectors such as finance, healthcare, and telecommunications to leverage graph analytics for better decision-making and fraud detection.Businesses want to use these technologies to get an edge over their competitors in their markets by improving customer experiences and making operations more efficient. There is also a growing interest in cloud-based graph analytics solutions. 

    This is because businesses need tools that can handle large amounts of data in a way that is both scalable and flexible. The use of AI and machine learning in the GCC is another factor that is helping the graph analytics market grow. Businesses can learn more and create more complex data models with these technologies. As the GCC works to become a knowledge-based economy, it's clear that graph analytics are being used more and more in different fields. This is leading to new ideas and ways of doing business.The overall digital landscape in the region is conducive to fostering advancements in graph analytics, paving the way for future growth and application in diverse sectors.

    GCC Graph Analytics Market Drivers

    Market Segment Insights

    GCC Graph Analytics Market Segment Insights

    Graph Analytics Market Application Insights

    The Application segment of the GCC Graph Analytics Market is a pivotal area that is expected to witness significant advancements as organizations increasingly recognize the value of graph analytics in their operations. Fraud Detection is a key area where graph analytics plays a critical role, particularly in the GCC region, known for its rapid digital transformation and financial innovation, helping institutions better identify unusual patterns and potential fraudulent activities. Social Network Analysis has also gained prominence, as businesses leverage data connections to understand customer behavior and improve marketing strategies, which is essential in a diverse market such as GCC, where social dynamics heavily influence consumer decisions.

    Recommendation Systems are becoming a fundamental piece of the customer experience, enabling companies to deliver personalized recommendations and improve user engagement, thus driving growth in e-commerce and retail sectors in the GCC. Moreover, Risk Management applications utilize intricate relationships among data points to assess potential risks, allowing businesses to implement proactive measures, particularly in sectors like finance and insurance, which are crucial for the GCC’s economy. Knowledge Graphs facilitate better data organization and retrieval, enhancing business intelligence capabilities and empowering decision makers with timely insights.

    Collectively, these applications underline the importance of harnessing GCC Graph Analytics Market data, elevating the overall value for organizations by optimizing processes, fostering innovation, and supporting strategic decision-making in an ever-evolving economic landscape. As GCC continues to invest in technological advancements and data analytics, the growth of graph analytics in these applications is expected to reshape industries and offer new opportunities for businesses to thrive.

    GCC Graph Analytics Market Segment

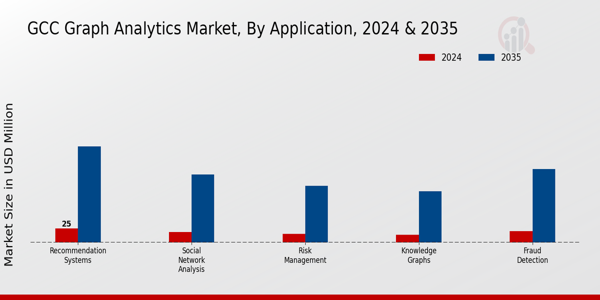
    Source: Primary Research, Secondary Research, MRFR Database and Analyst Review

    Graph Analytics Market Deployment Mode Insights

    The Deployment Mode segment of the GCC Graph Analytics Market has gained significant traction due to the increasing demand for robust data management solutions. The On-Premises model provides organizations with a high level of control and security, making it a preferred choice for sectors such as finance and healthcare, where data sensitivity is paramount. On the other hand, the Cloud-Based deployment is rapidly growing in popularity, driven by the benefits of scalability, cost-effectiveness, and flexibility, appealing to various industries looking to streamline operations and enhance data accessibility.

    The Hybrid approach captures the advantages of both On-Premises and Cloud-Based models, allowing businesses in the GCC region to customize their data strategies according to specific needs, thus facilitating better resource allocation and performance optimization. As organizations across GCC countries embrace digital transformation initiatives, the adoption of these deployment modes is expected to play a critical role in maximizing the overall value derived from graph analytics solutions. This diversification reflects the unique market dynamics prevalent in the GCC, underscoring the increasing emphasis on innovative analytical tools to drive business growth and informed decision-making.

    Graph Analytics Market End User Insights

    The End User segment of the GCC Graph Analytics Market is diverse and crucial for driving advancements across various industries. Within this landscape, sectors like Banking, Financial Services, and Insurance (BFSI) leverage graph analytics to enhance fraud detection and risk management, enabling rapid decision-making and improved customer service. The Retail industry benefits significantly from graph analytics through personalized marketing strategies and inventory optimization, helping businesses streamline operations and enhance customer engagement.Telecommunications companies utilize graph-based approaches for network optimization and customer experience enhancement, gaining insights into user behavior and preferences. 

    In Healthcare, graph analytics aid in patient data management and treatment optimization, contributing to improved health outcomes and operational efficiency. Meanwhile, Government entities utilize these analytics for smart city initiatives and public safety, facilitating data-driven decision-making for better resource allocation. Overall, the GCC graph analytics market segmentation reflects a growing trend towards data-driven insights, which are pivotal for operational excellence and strategic growth in these key sectors.

    Graph Analytics Market Component Insights

    The GCC Graph Analytics Market, particularly within the Component segment, exhibits significant growth potential driven by the increasing demand for data-driven decision-making in various industries. This segment is primarily composed of Software and Services, which are critical for enabling organizations to derive meaningful insights from complex datasets. Software solutions are pivotal as they provide the tools necessary for real-time data analysis and visualization, allowing businesses to optimize their operations and enhance customer experiences.

    Similarly, the Services aspect plays a crucial role in supporting organizations with integration, consultation, and custom development, ensuring that they can effectively utilize graph analytics technologies. The interplay between these components is fueling greater adoption in sectors such as banking, telecommunications, and healthcare within the GCC region, as businesses strive to leverage their datasets for competitive advantage. Moreover, the GCC region's focus on digital transformation and innovation is propelling advancements in graph analytics, further solidifying the importance of Software and Services in meeting the evolving needs of enterprises.As organizations in the GCC increasingly embrace these solutions, the Component segment is expected to witness robust demand, ultimately contributing to the overall GCC Graph Analytics Market growth.

    Regional Insights

    Key Players and Competitive Insights

    The GCC Graph Analytics Market has been experiencing significant evolution, driven by the increasing demand for advanced data analytics solutions across various industries. This market encompasses a variety of players that are continuously innovating and expanding their offerings to maintain a competitive edge. The proliferation of digital transformation initiatives within the region has further solidified the role of graph analytics in enabling organizations to visualize complex relationships and uncover hidden patterns in their data. Key factors such as increasing investments in AI and machine learning technologies, along with the growth of big data, have contributed to the expansion of this market. 

    The competitive insights reveal that major players are focusing on enhancing their product capabilities and tailoring their solutions to meet the distinct needs of businesses in the GCC, creating a dynamic and rapidly evolving market landscape.Oracle holds a prominent position in the GCC Graph Analytics Market, recognized for its comprehensive suite of databases and analytics tools. The company's strengths lie in its robust technology architecture, extensive experience in data management, and strong presence in the enterprise segment. With a firm commitment to innovation, Oracle has developed advanced graph analytics capabilities, enabling organizations to perform complex analysis efficiently. The company's ability to integrate its analytics tools with existing enterprise systems provides added value to its clients, facilitating seamless transitions and enhanced operational efficiency. 

    Furthermore, Oracle's strategic partnerships within the region have amplified its market presence, allowing it to cater to the diverse needs of various sectors, including finance, telecommunications, and government.Information Builders has established itself as a key player in the GCC Graph Analytics Market by offering robust data management and analytics solutions tailored to the local market. The company is well-regarded for its innovative products that enable businesses to derive meaningful insights from their data through effective visualization and analysis. Its strengths include a well-developed analytical platform that provides users with the tools necessary for graph analytics and data integration. Information Builders has focused on catering to the unique requirements of organizations in the GCC, such as compliance with local regulations and industry standards. The organization has engaged in strategic mergers and collaborations to enhance its service offerings, ensuring a strong competitive foothold in the region. Through these efforts, Information Builders has been able to expand its market presence and solidify its reputation as a reliable provider of graph analytics for businesses across various sectors in the GCC.

    Industry Developments

    The GCC Graph Analytics Market has seen significant developments recently, driven by the increased demand for data-driven decision-making across various sectors. In October 2023, Oracle announced enhancements to itscloud infrastructure to bolster itsgraph analytics capabilities, targeting businesses needing advanced data visualization. TIBCO Software also revealed a new partnership with local enterprises to implement graph-based solutions for real-time data processing, enhancing operational efficiency. Additionally, DataStax has reported a surge in demand for its graph database services in the region, attributed to the rapid digital transformation initiatives being implemented by governments and private sectors alike.

    In terms of mergers and acquisitions, in September 2023, SAP acquired a local analytics firm to strengthen its position in the GCC market, aiming to integrate itssolutions with existing graph technologies. This acquisition is part of SAP's strategy to expand itsproduct offerings in the region's growing data analytics landscape. Major companies like IBM and Microsoft are also investing heavily in Research and Development to introduce innovative graph analytics solutions tailored for GCC clients, reflecting the market's evolving needs and aspirations for digital excellence. Overall, the GCC Graph Analytics Market is poised for substantial growth as organizations increasingly leverage advanced analytics to enhance their competitive edge.

    Market Segmentation

    Graph Analytics Market End User Outlook

    • BFSI
    • Retail
    • Telecommunications
    • Healthcare
    • Government

    Graph Analytics Market Component Outlook

    • Software
    • Services

    Graph Analytics Market Application Outlook

    • Fraud Detection
    • Social Network Analysis
    • Recommendation Systems
    • Risk Management
    • Knowledge Graphs

    Graph Analytics Market Deployment Mode Outlook

    • On-Premises
    • Cloud-Based
    • Hybrid

    Report Scope


    Report Attribute/Metric Source: Details
    MARKET SIZE 2023 77.17(USD Million)
    MARKET SIZE 2024 91.12(USD Million)
    MARKET SIZE 2035 610.82(USD Million)
    COMPOUND ANNUAL GROWTH RATE (CAGR) 18.882% (2025 - 2035)
    REPORT COVERAGE Revenue Forecast, Competitive Landscape, Growth Factors, and Trends
    BASE YEAR 2024
    MARKET FORECAST PERIOD 2025 - 2035
    HISTORICAL DATA 2019 - 2024
    MARKET FORECAST UNITS USD Million
    KEY COMPANIES PROFILED Oracle, Information Builders, TIBCO Software, Cisco, SAP, Qlik, IBM, DataStax, Neo4j, Teradata, Microsoft, Hewlett Packard Enterprise, Cloudera, Amazon Web Services
    SEGMENTS COVERED Application, Deployment Mode, End User, Component
    KEY MARKET OPPORTUNITIES Increased demand for real-time insights, Enhanced social network analysis capabilities, Growing need for fraud detection solutions, Expansion of smart city initiatives, Adoption in healthcare data management
    KEY MARKET DYNAMICS growing data complexity, increasing demand for insights, rise in AI adoption, expanding cloud infrastructure, focus on real-time analytics
    COUNTRIES COVERED GCC

    Market Highlights

    Author
    Aarti Dhapte
    Team Lead - Research

    She holds an experience of about 6+ years in Market Research and Business Consulting, working under the spectrum of Information Communication Technology, Telecommunications and Semiconductor domains. Aarti conceptualizes and implements a scalable business strategy and provides strategic leadership to the clients. Her expertise lies in market estimation, competitive intelligence, pipeline analysis, customer assessment, etc.

    Leave a Comment

    FAQs

    What is the projected market size of the GCC Graph Analytics Market in 2024?

    The GCC Graph Analytics Market is expected to be valued at 91.12 USD Million in 2024.

    What is the expected market size of the GCC Graph Analytics Market by 2035?

    By 2035, the GCC Graph Analytics Market is projected to reach a valuation of 610.82 USD Million.

    What is the expected compound annual growth rate (CAGR) for the GCC Graph Analytics Market from 2025 to 2035?

    The expected CAGR for the GCC Graph Analytics Market from 2025 to 2035 is 18.882 %.

    Which application within the GCC Graph Analytics Market is expected to have significant growth?

    The Recommendation Systems application is anticipated to grow significantly, valued at 170.0 USD Million by 2035.

    What will be the market value of Fraud Detection in the GCC Graph Analytics Market by 2035?

    The market value for Fraud Detection in the GCC Graph Analytics Market is projected to reach 130.0 USD Million by 2035.

    Who are the key players in the GCC Graph Analytics Market?

    Major players in the market include Oracle, IBM, Microsoft, and Amazon Web Services.

    What is the anticipated market value for Social Network Analysis by 2035?

    Social Network Analysis is expected to grow to 120.0 USD Million by 2035 in the GCC Graph Analytics Market.

    What are the projected values for Risk Management in the GCC Graph Analytics Market by 2035?

    By 2035, the market value for Risk Management is expected to be 100.0 USD Million.

    What is the expected market size for Knowledge Graphs by 2035?

    Knowledge Graphs is projected to reach a market size of 90.82 USD Million by 2035.

    How is the current market trend affecting the growth of the GCC Graph Analytics Market?

    The growth drivers include increasing demand for data analytics and enhanced fraud detection capabilities.

    1. EXECUTIVE
    2. SUMMARY
    3. Market Overview
    4. Key Findings
    5. Market Segmentation
    6. Competitive Landscape
    7. Challenges and Opportunities
    8. Future Outlook
    9. MARKET INTRODUCTION
    10. Definition
    11. Scope of the study
    12. Research Objective
    13. Assumption
    14. Limitations
    15. RESEARCH
    16. METHODOLOGY
    17. Overview
    18. Data
    19. Mining
    20. Secondary Research
    21. Primary
    22. Research
    23. Primary Interviews and Information Gathering
    24. Process
    25. Breakdown of Primary Respondents
    26. Forecasting
    27. Model
    28. Market Size Estimation
    29. Bottom-Up
    30. Approach
    31. Top-Down Approach
    32. Data
    33. Triangulation
    34. Validation
    35. MARKET
    36. DYNAMICS
    37. Overview
    38. Drivers
    39. Restraints
    40. Opportunities
    41. MARKET FACTOR ANALYSIS
    42. Value chain Analysis
    43. Porter's
    44. Five Forces Analysis
    45. Bargaining Power of Suppliers
    46. Bargaining
    47. Power of Buyers
    48. Threat of New Entrants
    49. Threat
    50. of Substitutes
    51. Intensity of Rivalry
    52. COVID-19
    53. Impact Analysis
    54. Market Impact Analysis
    55. Regional
    56. Impact
    57. Opportunity and Threat Analysis
    58. GCC
    59. Graph Analytics Market, BY Application (USD Million)
    60. Fraud
    61. Detection
    62. Social Network Analysis
    63. Recommendation
    64. Systems
    65. Risk Management
    66. Knowledge
    67. Graphs
    68. GCC Graph Analytics
    69. Market, BY Deployment Mode (USD Million)
    70. On-Premises
    71. Cloud-Based
    72. Hybrid
    73. GCC
    74. Graph Analytics Market, BY End User (USD Million)
    75. BFSI
    76. Retail
    77. Telecommunications
    78. Healthcare
    79. Government
    80. GCC
    81. Graph Analytics Market, BY Component (USD Million)
    82. Software
    83. Services
    84. Competitive Landscape
    85. Overview
    86. Competitive
    87. Analysis
    88. Market share Analysis
    89. Major
    90. Growth Strategy in the Graph Analytics Market
    91. Competitive
    92. Benchmarking
    93. Leading Players in Terms of Number of Developments
    94. in the Graph Analytics Market
    95. Key developments and growth
    96. strategies
    97. New Product Launch/Service Deployment
    98. Merger
    99. & Acquisitions
    100. Joint Ventures
    101. Major
    102. Players Financial Matrix
    103. Sales and Operating Income
    104. Major
    105. Players R&D Expenditure. 2023
    106. Company
    107. Profiles
    108. Oracle
    109. Financial
    110. Overview
    111. Products Offered
    112. Key
    113. Developments
    114. SWOT Analysis
    115. Key
    116. Strategies
    117. Information Builders
    118. Financial
    119. Overview
    120. Products Offered
    121. Key
    122. Developments
    123. SWOT Analysis
    124. Key
    125. Strategies
    126. TIBCO Software
    127. Financial
    128. Overview
    129. Products Offered
    130. Key
    131. Developments
    132. SWOT Analysis
    133. Key
    134. Strategies
    135. Cisco
    136. Financial
    137. Overview
    138. Products Offered
    139. Key
    140. Developments
    141. SWOT Analysis
    142. Key
    143. Strategies
    144. SAP
    145. Financial
    146. Overview
    147. Products Offered
    148. Key
    149. Developments
    150. SWOT Analysis
    151. Key
    152. Strategies
    153. Qlik
    154. Financial
    155. Overview
    156. Products Offered
    157. Key
    158. Developments
    159. SWOT Analysis
    160. Key
    161. Strategies
    162. IBM
    163. Financial
    164. Overview
    165. Products Offered
    166. Key
    167. Developments
    168. SWOT Analysis
    169. Key
    170. Strategies
    171. DataStax
    172. Financial
    173. Overview
    174. Products Offered
    175. Key
    176. Developments
    177. SWOT Analysis
    178. Key
    179. Strategies
    180. Neo4j
    181. Financial
    182. Overview
    183. Products Offered
    184. Key
    185. Developments
    186. SWOT Analysis
    187. Key
    188. Strategies
    189. Teradata
    190. Financial
    191. Overview
    192. Products Offered
    193. Key
    194. Developments
    195. SWOT Analysis
    196. Key
    197. Strategies
    198. Microsoft
    199. Financial
    200. Overview
    201. Products Offered
    202. Key
    203. Developments
    204. SWOT Analysis
    205. Key
    206. Strategies
    207. Hewlett Packard Enterprise
    208. Financial
    209. Overview
    210. Products Offered
    211. Key
    212. Developments
    213. SWOT Analysis
    214. Key
    215. Strategies
    216. Cloudera
    217. Financial
    218. Overview
    219. Products Offered
    220. Key
    221. Developments
    222. SWOT Analysis
    223. Key
    224. Strategies
    225. Amazon Web Services
    226. Financial
    227. Overview
    228. Products Offered
    229. Key
    230. Developments
    231. SWOT Analysis
    232. Key
    233. Strategies
    234. References
    235. Related
    236. Reports
    237. LIST
    238. OF ASSUMPTIONS
    239. GCC Graph Analytics Market SIZE ESTIMATES
    240. & FORECAST, BY APPLICATION, 2019-2035 (USD Billions)
    241. GCC
    242. Graph Analytics Market SIZE ESTIMATES & FORECAST, BY DEPLOYMENT MODE, 2019-2035
    243. (USD Billions)
    244. GCC Graph Analytics Market SIZE ESTIMATES
    245. & FORECAST, BY END USER, 2019-2035 (USD Billions)
    246. GCC
    247. Graph Analytics Market SIZE ESTIMATES & FORECAST, BY COMPONENT, 2019-2035 (USD
    248. Billions)
    249. PRODUCT LAUNCH/PRODUCT DEVELOPMENT/APPROVAL
    250. ACQUISITION/PARTNERSHIP
    251. LIST
    252. Of figures
    253. MARKET SYNOPSIS
    254. GCC
    255. GRAPH ANALYTICS MARKET ANALYSIS BY APPLICATION
    256. GCC GRAPH
    257. ANALYTICS MARKET ANALYSIS BY DEPLOYMENT MODE
    258. GCC GRAPH
    259. ANALYTICS MARKET ANALYSIS BY END USER
    260. GCC GRAPH ANALYTICS
    261. MARKET ANALYSIS BY COMPONENT
    262. KEY BUYING CRITERIA OF GRAPH
    263. ANALYTICS MARKET
    264. RESEARCH PROCESS OF MRFR
    265. DRO
    266. ANALYSIS OF GRAPH ANALYTICS MARKET
    267. DRIVERS IMPACT ANALYSIS:
    268. GRAPH ANALYTICS MARKET
    269. RESTRAINTS IMPACT ANALYSIS: GRAPH
    270. ANALYTICS MARKET
    271. SUPPLY / VALUE CHAIN: GRAPH ANALYTICS
    272. MARKET
    273. GRAPH ANALYTICS MARKET, BY APPLICATION, 2025 (%
    274. SHARE)
    275. GRAPH ANALYTICS MARKET, BY APPLICATION, 2019 TO
    276. (USD Billions)
    277. GRAPH ANALYTICS MARKET, BY DEPLOYMENT
    278. MODE, 2025 (% SHARE)
    279. GRAPH ANALYTICS MARKET, BY DEPLOYMENT
    280. MODE, 2019 TO 2035 (USD Billions)
    281. GRAPH ANALYTICS MARKET,
    282. BY END USER, 2025 (% SHARE)
    283. GRAPH ANALYTICS MARKET, BY
    284. END USER, 2019 TO 2035 (USD Billions)
    285. GRAPH ANALYTICS
    286. MARKET, BY COMPONENT, 2025 (% SHARE)
    287. GRAPH ANALYTICS
    288. MARKET, BY COMPONENT, 2019 TO 2035 (USD Billions)
    289. BENCHMARKING
    290. OF MAJOR COMPETITORS

    GCC Graph Analytics Market Segmentation

    • Graph Analytics Market By Application (USD Million, 2019-2035)

      • Fraud Detection
      • Social Network Analysis
      • Recommendation Systems
      • Risk Management
      • Knowledge Graphs


    • Graph Analytics Market By Deployment Mode (USD Million, 2019-2035)

      • On-Premises
      • Cloud-Based
      • Hybrid


    • Graph Analytics Market By End User (USD Million, 2019-2035)

      • BFSI
      • Retail
      • Telecommunications
      • Healthcare
      • Government


    • Graph Analytics Market By Component (USD Million, 2019-2035)

      • Software
      • Services


    No infographic available

    Free Sample Request

    Kindly complete the form below to receive a free sample of this Report

    Customer Strories

    “I am very pleased with how market segments have been defined in a relevant way for my purposes (such as "Portable Freezers & refrigerators" and "last-mile"). In general the report is well structured. Thanks very much for your efforts.”

    Victoria Milne Founder
    Case Study

    Chemicals and Materials