• Cat-intel
  • MedIntelliX
  • Resources
  • About Us
  • Request Free Sample ×

    Kindly complete the form below to receive a free sample of this Report

    Leading companies partner with us for data-driven Insights

    clients tt-cursor

    Floating LNG Power Vessel Market

    ID: MRFR/E&P/7114-HCR
    111 Pages
    Priya Nagrale
    September 2025

    Floating LNG Power Vessel Market Research Report By Application (Power Generation, Desalination, Gas Processing), By Power Output (Less than 100 MW, 100 MW to 300 MW, Above 300 MW), By Vessel Type (Floating Storage Regasification Unit, Floating Storage Unit, Floating Power Unit), By End Use (Coastal Regions, Isolated Areas, Industrial Applications) and By Regional (North America, Europe, South America, Asia Pacific, Middle East and Africa) - Forecast to 2032

    Share:
    Download PDF ×

    We do not share your information with anyone. However, we may send you emails based on your report interest from time to time. You may contact us at any time to opt-out.

    Floating LNG Power Vessel Market Research Report - Global Forecast till 2032 Infographic
    Purchase Options
    $ 4,950.0
    $ 5,950.0
    $ 7,250.0
    Table of Contents

    Floating LNG Power Vessel Market Summary

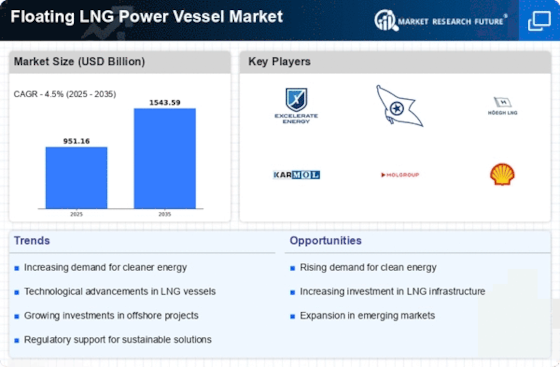
    As per Market Research Future Analysis, the Floating LNG Power Vessel Market was valued at 2.75 USD Billion in 2022 and is projected to grow to 8.0 USD Billion by 2032, reflecting a CAGR of 11.25% from 2024 to 2032. The market is driven by rising energy demands, the need for cleaner fuels, and the flexibility of floating LNG vessels, which are essential for regions with limited infrastructure. The market is also witnessing advancements in technology that enhance the efficiency of these vessels, leading to increased investment opportunities.

    Key Market Trends & Highlights

    The Floating LNG Power Vessel Market is characterized by several key trends.

    • Market Size in 2023: 3.06 USD Billion; Expected to reach 8.0 USD Billion by 2032.
    • Power Generation segment valued at 1.24 USD Billion in 2023.
    • Desalination segment valued at 0.86 USD Billion in 2023.
    • Gas Processing segment valued at 0.96 USD Billion in 2023.

    Market Size & Forecast

    2022 Market Size USD 2.75 Billion
    2023 Market Size USD 3.06 Billion
    2032 Market Size USD 8.0 Billion
    CAGR (2024-2032) 11.25%

    Major Players

    Key players include Shell, General Electric, Excelerate Energy, Siemens, DNV GL, Black and Veatch, Sempra Energy, TotalEnergies, Golar LNG, Marubeni Corporation, Bumi Armada, TenneT, Mitsubishi Corporation, and Wärtsilä.

    Floating LNG Power Vessel Market Trends

    Companies are investing in research and development to enhance the operational capabilities of these vessels. Collaborations between different stakeholders are becoming more common, facilitating knowledge-sharing and innovation in the sector. As environmental regulations tighten, the emphasis on cleaner, reliable energy continues to drive interest in floating LNG power vessels, indicating a strong trajectory for future growth in the market.

    The Floating LNG Power Vessel market is poised for expansion as nations increasingly seek flexible and sustainable energy solutions to meet their growing electricity demands.

    U.S. Energy Information Administration

    Floating LNG Power Vessel Market Drivers

    Market Growth Projections

    The Global Floating LNG Power Vessel Market Industry is poised for substantial growth, with projections indicating a market size of 3.42 USD Billion in 2024 and an anticipated increase to 11.0 USD Billion by 2035. This growth reflects a CAGR of 11.23% from 2025 to 2035, driven by factors such as rising energy demand, technological advancements, and supportive regulatory frameworks. The market's expansion is likely to be influenced by emerging economies seeking to diversify their energy sources and enhance energy security. As the industry evolves, it may present numerous opportunities for stakeholders to capitalize on the growing demand for floating LNG solutions.

    Growing Demand for Clean Energy

    The Global Floating LNG Power Vessel Market Industry is experiencing a surge in demand for cleaner energy sources. As nations strive to reduce their carbon footprints, LNG emerges as a viable alternative to traditional fossil fuels. Countries such as Japan and South Korea are increasingly investing in floating LNG technology to enhance energy security while minimizing environmental impact. This shift is expected to drive the market's growth, with projections indicating that the market could reach 3.42 USD Billion in 2024. The transition towards cleaner energy solutions is likely to bolster the adoption of floating LNG power vessels globally.

    Regulatory Support and Policy Frameworks

    The Global Floating LNG Power Vessel Market Industry benefits from supportive regulatory frameworks and policies aimed at promoting cleaner energy solutions. Governments worldwide are implementing incentives and subsidies to encourage the adoption of LNG as a transitional fuel. For example, the European Union has established policies to facilitate the development of LNG infrastructure, which enhances the attractiveness of floating LNG power vessels. This regulatory support is likely to stimulate investments and foster market growth, as stakeholders seek to align with national and international energy goals. The evolving policy landscape may further accelerate the transition towards LNG as a primary energy source.

    Strategic Partnerships and Collaborations

    Strategic partnerships and collaborations within the Global Floating LNG Power Vessel Market Industry are becoming increasingly common as companies seek to leverage each other's strengths. Collaborations between energy firms and technology providers can enhance operational efficiencies and reduce costs associated with floating LNG projects. For instance, joint ventures between established energy companies and innovative startups may lead to the development of cutting-edge technologies that improve vessel performance. Such partnerships are likely to drive market expansion, as they enable stakeholders to share resources and expertise, ultimately contributing to the industry's growth trajectory.

    Technological Advancements in LNG Technology

    Technological innovations within the Global Floating LNG Power Vessel Market Industry are pivotal in enhancing efficiency and reducing operational costs. Advances in liquefaction processes and floating platform designs have improved the feasibility of deploying LNG vessels in remote locations. For instance, the development of more efficient regasification technologies allows for quicker and more effective energy delivery. These advancements not only facilitate the expansion of LNG infrastructure but also attract investments, potentially propelling the market to an estimated 11.0 USD Billion by 2035. The ongoing evolution of technology is likely to play a crucial role in shaping the industry's future.

    Increasing Energy Demand in Emerging Economies

    Emerging economies are witnessing a rapid increase in energy demand, which significantly influences the Global Floating LNG Power Vessel Market Industry. Countries in Asia, particularly India and Southeast Asian nations, are experiencing economic growth that drives the need for reliable and scalable energy solutions. Floating LNG power vessels present a flexible option to meet this demand, as they can be deployed quickly and efficiently in various locations. This trend suggests a robust growth trajectory for the market, with a projected CAGR of 11.23% from 2025 to 2035, as these nations seek to diversify their energy sources and enhance energy security.

    Market Segment Insights

    Floating LNG Power Vessel Market Application Insights   

    The Floating LNG Power Vessel Market is gaining significant traction, particularly within the Application segment, showcasing diverse utility across several domains, including Power Generation, Desalination, and Gas Processing. In 2023, the overall market is collectively valued at 3.06 USD Billion, highlighting robust demand and investment opportunities in this sector. Within this framework, the Power Generation domain stands as a prominent contributor, commanding a valuation of 1.24 USD Billion in 2023. This segment exemplifies a majority holding in the market due to its critical role in supporting energy infrastructure and ensuring electricity supply in regions with limited land-based resources.

    The Desalination aspect represents another vital application, initially valued at 0.86 USD Billion in the same year. This part is essential for providing freshwater solutions in water-scarce regions, underscoring its importance in addressing ongoing global freshwater shortages. Meanwhile, Gas Processing, valued at 0.96 USD Billion in 2023, also plays a crucial function by ensuring the efficient handling and processing of natural gas, which is crucial for promoting energy security.

    Each of these segments not only contributes to the Floating LNG Power Vessel Market revenue but showcases unique growth drivers ranging from increasing energy demands to the necessity of clean water access.

    As the market evolves, trends such as technological advancements and the push toward cleaner energy solutions continue to underscore the potential within these applications. The expected growth rates within these segments reflect not just market potential but also the broader shift towards sustainable practices and resource efficiency in today's industries. Thus, the Floating LNG Power Vessel Market segmentation illustrates a diverse landscape where each application type addresses specific challenges and opportunities, fostering a proactive response to global demands.

    Source: Primary Research, Secondary Research, Market Research Future Database and Analyst Review

    Floating LNG Power Vessel Market Power Output Insights

    The Floating LNG Power Vessel Market is experiencing notable growth, with the overall market anticipated to be valued at 3.06 USD Billion in 2023, driven by the increasing demand for flexible and efficient power solutions. Power Output plays a pivotal role in determining the capabilities and applications of these vessels. The market consists of various classifications, where categories such as Less than 100 MW are crucial for smaller, localized power generation, mainly catering to remote areas and islands. Meanwhile, the range of 100 MW to 300 MW accommodates medium-scale energy requirements, enhancing grid stability and complementing renewable sources.

    The segment dubbed Above 300 MW dominates the market due to its ability to deliver large-scale, dependable energy, meeting the needs of industrial applications and urban centers. Collectively, these segments showcase a diverse range of applications, enabling adaptability to different energy requirements, thus highlighting their significance in the overall dynamics of the Floating LNG Power Vessel Market. The expansion in these segments is propelled by technological advancements and the global push for cleaner energy solutions, while challenges like regulatory frameworks and environmental concerns continue to influence market conditions.

    Floating LNG Power Vessel Market Vessel Type Insights

    The Floating LNG Power Vessel Market is experiencing significant growth, with an overall market valuation expected to be 3.06 billion USD in 2023, which underscores its expanding importance in the energy sector. The market is categorized by various vessel types, which include Floating Storage Regasification Units, Floating Storage Units, and Floating Power Units. Among these, the Floating Storage Regasification Units hold a notable share as they play a vital role in the conversion of liquefied natural gas to gaseous form for energy generation, contributing to the market's efficiency and sustainability.

    Floating Storage Units are also critical, serving as essential facilities for the temporary storage of LNG and ensuring a steady supply chain, which is crucial amidst fluctuating energy demands. The Floating Power Units, which integrate power generation and floating storage capabilities, are a growing focal point for developers aiming to enhance energy accessibility in remote or developing regions. The combined impact of these vessel types significantly drives the Floating LNG Power Vessel Market revenue, reflecting key trends such as diversification in energy sources and the push towards cleaner energy alternatives.

    As the market evolves, understanding this segmentation provides valuable insights into operational strategies and growth opportunities within the industry.

    Floating LNG Power Vessel Market End Use Insights

    The Floating LNG Power Vessel Market is expected to experience significant growth driven by its applications across various end-use segments. In 2023, this market is valued at 3.06 USD Billion, with a notable expansion projected towards 2032. Coastal regions play a crucial role in this market as they frequently require efficient energy solutions to support population growth and industrial activities. Similarly, isolated areas present unique challenges for energy access; thus, floating LNG power vessels become a key solution by providing a reliable power supply.

    Industrial applications are equally important, as they demand steady energy due to operational requirements. Each end use represents a strategic avenue for enhancing energy efficiency and resilience in the market. The market growth is fueled by increasing demand for cleaner energy alternatives, regulatory support, and the potential for mitigating energy scarcity in various geographic locations. As the industry embraces advancements in technology and infrastructure, the Floating LNG Power Vessel Market statistics highlight a promising outlook, offering numerous opportunities for stakeholders.

    Get more detailed insights about Floating LNG Power Vessel Market Research Report - Global Forecast till 2032

    Regional Insights

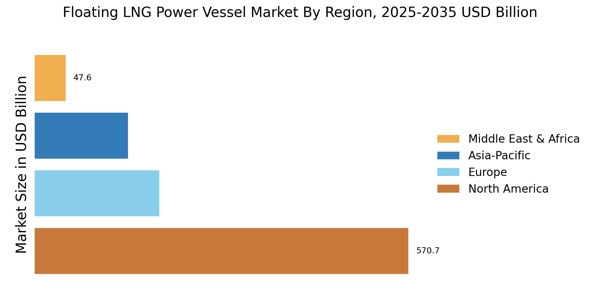
    The Floating LNG Power Vessel Market is displaying substantial growth across various regional markets, with total expected revenue reaching 3.06 USD Billion in 2023 and projected to reach 8.0 USD Billion by 2032. Among the regions, APAC stands out with a significant market valuation of 1.2 USD Billion in 2023, accounting for a major share as the region focuses on increasing energy demands and cleaner energy sources. North America follows closely, with a market value of 0.76 USD Billion in 2023, driven by technological advancements and a shift towards LNG solutions.

    Europe also plays a crucial role in the market, with a valuation of 0.74 USD Billion, focusing on energy security and sustainability. South America and MEA represent the smaller segments of this market, valued at 0.2 USD Billion and 0.16 USD Billion in 2023, respectively. However, these regions possess opportunities to enhance their positions as infrastructure and demand for LNG technologies evolve. With the Floating LNG Power Vessel Market growing consistently, the regional segmentation highlights the importance of understanding local demands and trends, which contribute to the overall market growth trajectory.

    Floating LNG Power Vessel Market Regional Insights

    Source: Primary Research, Secondary Research, Market Research Future Database and Analyst Review

    Key Players and Competitive Insights

    The Floating LNG Power Vessel Market has seen significant growth due to the increasing demand for energy and the need for sustainable power solutions. As nations strive to reduce their carbon footprint while ensuring energy security, floating LNG power vessels have emerged as an innovative solution. These vessels combine the advantages of liquefied natural gas with the flexibility of floating power generation, allowing for efficient energy production closer to consumption points. In this competitive landscape, various players are actively involved, focusing on technological advancements, strategic partnerships, and expansion of operational capacities.

    As companies navigate this evolving market, understanding individual strengths and capabilities is crucial for positioning themselves effectively against competitors.

    Shell has successfully established a strong presence in the Floating LNG Power Vessel Market by leveraging its vast experience in the energy sector and extensive technical expertise. The company excels in providing integrated energy solutions, focusing on the development, construction, and operation of floating LNG power vessels. Shell's strengths lie in its ability to innovate and optimize LNG technology, which enhances the efficiency and reliability of its power generation services.

    Additionally, the company has been able to effectively capitalize on its robust global supply chain and establish relationships with various stakeholders in the energy domain, allowing it to secure advantageous partnerships and projects. This strategic positioning enables Shell to respond agilely to market demands and contribute significantly to the advancement of floating LNG technologies, reinforcing its competitive edge in the market.

    General Electric has positioned itself as a formidable player in the Floating LNG Power Vessel Market by capitalizing on its extensive portfolio of advanced technologies and industry expertise. The company's strengths stem from its focus on innovation in power generation and commitment to sustainability, providing customers with efficient LNG solutions tailored to their unique energy needs. General Electric’s vast experience in engineering and manufacturing, coupled with its cutting-edge research and development capabilities, empowers it to deliver highly reliable floating power generation systems.

    Moreover, General Electric is adept at forming strategic alliances and collaborations that enhance its operational capabilities and market reach. This focus on innovation and collaboration ultimately allows General Electric to maintain a strong competitive presence in the ever-evolving floating LNG power vessel landscape.

    Key Companies in the Floating LNG Power Vessel Market market include

    Industry Developments

    Recent developments in the Floating LNG Power Vessel Market highlight a growing inclination toward sustainable energy sources. Shell has been making strides in expanding its floating LNG capabilities, focusing on innovative technologies to enhance efficiency. General Electric is also actively involved in optimizing its power generation solutions for floating LNG platforms, while Siemens continues to integrate smart technology into their offerings. Excelerate Energy has been increasing its footprint in the market, emphasizing rapid deployment for energy security.

    Notably, Golar LNG has advanced its projects, aiming to bolster infrastructure in emerging markets. Additionally, TotalEnergies has announced strategic partnerships aimed at enhancing floating LNG operations and facilitating access to cleaner energy. Recent mergers and acquisitions have become prevalent, with companies like Mitsubishi Corporation eyeing expansion opportunities, which are set to significantly impact market growth and valuation. Bumi Armada and Wärtsilä are also in the limelight for collaborative efforts aimed at streamlining operations and enhancing floating solutions.

    The increasing demand for flexible, cleaner energy options is driving growth, pushing companies such as Black & Veatch and Sempra Energy to innovate and adapt in this competitive landscape.

    Future Outlook

    Floating LNG Power Vessel Market Future Outlook

    The Floating LNG Power Vessel Market is projected to grow at 11.23% CAGR from 2024 to 2035, driven by increasing energy demand, technological advancements, and environmental regulations.

    New opportunities lie in:

    • Develop modular floating LNG solutions for emerging markets.
    • Invest in hybrid power systems integrating renewable energy sources.
    • Enhance digitalization in vessel operations for efficiency and safety.

    By 2035, the Floating LNG Power Vessel Market is expected to be a pivotal component of global energy infrastructure.

    Market Segmentation

    Floating LNG Power Vessel Market End Use Outlook

    • Coastal Regions
    • Isolated Areas
    • Industrial Applications

    Floating LNG Power Vessel Market Regional Outlook

    • North America
    • Europe
    • South America
    • Asia Pacific
    • Middle East and Africa

    Floating LNG Power Vessel Market Application Outlook

    • Power Generation
    • Desalination
    • Gas Processing

    Floating LNG Power Vessel Market Vessel Type Outlook

    • Floating Storage Regasification Unit
    • Floating Storage Unit
    • Floating Power Unit

    Floating LNG Power Vessel Market Power Output Outlook

    • Less than 100 MW
    • 100 MW to 300 MW
    • Above 300 MW

    Report Scope

    Report Attribute/Metric Details
    Market Size 2022 2.75 (USD Billion)
    Market Size 2023 3.06 (USD Billion)
    Market Size 2032 8.0 (USD Billion)
    Compound Annual Growth Rate (CAGR) 11.25% (2024 - 2032)
    Report Coverage Revenue Forecast, Competitive Landscape, Growth Factors, and Trends
    Base Year 2023
    Market Forecast Period 2024 - 2032
    Historical Data 2019 - 2023
    Market Forecast Units USD Billion
    Key Companies Profiled Shell, General Electric, Excelerate Energy, Siemens, DNV GL, Black  and  Veatch, Sempra Energy, TotalEnergies, Golar LNG, Marubeni Corporation, Bumi Armada, TenneT, Mitsubishi Corporation, Wärtsilä, KBR
    Segments Covered Application, Power Output, Vessel Type, End Use, Regional
    Key Market Opportunities Increasing energy demand, Offshore gas exploration, Sustainable power solutions, Technological advancements, Coastal infrastructure development
    Key Market Dynamics Growing energy demand, Environmental regulations, Technological advancements, Offshore gas reserves, Investment and financing challenges
    Countries Covered North America, Europe, APAC, South America, MEA

    Market Highlights

    Author
    Priya Nagrale
    Senior Research Analyst

    With an experience of over five years in market research industry (Chemicals & Materials domain), I gather and analyze market data from diverse sources to produce results, which are then presented back to a client. Also, provide recommendations based on the findings. As a Senior Research Analyst, I perform quality checks (QC) for market estimations, QC for reports, and handle queries and work extensively on client customizations. Also, handle the responsibilities of client proposals, report planning, report finalization, and execution

    Leave a Comment

    FAQs

    What is the expected market size of the Floating LNG Power Vessel Market in 2032?

    The Floating LNG Power Vessel Market is expected to reach a value of 8.0 USD Billion by 2032.

    What is the anticipated compound annual growth rate (CAGR) for the Floating LNG Power Vessel Market from 2024 to 2032?

    The Floating LNG Power Vessel Market is projected to have a CAGR of 11.25% from 2024 to 2032.

    Which region is projected to have the largest market size for the Floating LNG Power Vessel Market in 2032?

    The APAC region is anticipated to have the largest market size, valued at 3.2 USD Billion by 2032.

    What are the estimated values for the Power Generation application segment in the Floating LNG Power Vessel Market by 2032?

    The Power Generation application segment is expected to be valued at 3.2 USD Billion by 2032.

    Who are the key players in the Floating LNG Power Vessel Market?

    Major players in this market include Shell, General Electric, Excelerate Energy, Siemens, and TotalEnergies.

    What is the expected market value for the Desalination application segment by 2032?

    The Desalination application segment is projected to be valued at 2.3 USD Billion in 2032.

    How much is the North American segment of the Floating LNG Power Vessel Market expected to be valued in 2032?

    The North American segment is expected to reach a market value of 2.0 USD Billion by 2032.

    What is the forecasted market value for the Gas Processing application by 2032?

    The Gas Processing application segment is anticipated to be valued at 2.5 USD Billion by 2032.

    What challenges might the Floating LNG Power Vessel Market face in its growth?

    The market may face challenges such as regulatory hurdles and competition from alternative energy sources.

    Which region had a market value of 0.16 USD Billion in 2023, and what is its expected value in 2032?

    The MEA region had a market value of 0.16 USD Billion in 2023 and is expected to reach 0.4 USD Billion by 2032.

    1. 'TABLE OF CONTENTS
    2. EXECUTIVE SUMMARY
    3. Market Overview
      1. Key Findings
      2. Market Segmentation
    4. Competitive Landscape
      1. Challenges and Opportunities
      2. Future Outlook
    5. MARKET INTRODUCTION
      1. Definition
      2. Scope of the study
        1. Research Objective
        2. Assumption
        3. Limitations
    6. RESEARCH METHODOLOGY
      1. Overview
    7. Data Mining
      1. Secondary Research
      2. Primary Research
    8. Primary Interviews and Information Gathering Process
      1. Breakdown of Primary
    9. Respondents
      1. Forecasting Model
      2. Market Size Estimation
    10. Bottom-Up Approach
      1. Top-Down Approach
      2. Data Triangulation
      3. Validation
    11. MARKET DYNAMICS
      1. Overview
      2. Drivers
      3. Restraints
      4. Opportunities
    12. MARKET FACTOR ANALYSIS
      1. Value chain Analysis
      2. Porter''s Five Forces
    13. Analysis
      1. Bargaining Power of Suppliers
        1. Bargaining Power
    14. of Buyers
      1. Threat of New Entrants
        1. Threat of Substitutes
        2. Intensity of Rivalry
      2. COVID-19 Impact Analysis
    15. Market Impact Analysis
      1. Regional Impact
        1. Opportunity and
    16. Threat Analysis
    17. FLOATING LNG POWER VESSEL MARKET, BY
    18. APPLICATION (USD BILLION)
      1. Power Generation
      2. Desalination
      3. Gas Processing
    19. FLOATING LNG POWER VESSEL MARKET, BY POWER OUTPUT
    20. (USD BILLION)
      1. Less than 100 MW
      2. 100 MW to 300 MW
    21. Above 300 MW
    22. FLOATING LNG POWER VESSEL MARKET, BY VESSEL TYPE (USD BILLION)
      1. Floating Storage Regasification Unit
      2. Floating Storage Unit
      3. Floating Power Unit
    23. FLOATING LNG POWER VESSEL MARKET, BY END
    24. USE (USD BILLION)
      1. Coastal Regions
      2. Isolated Areas
    25. Industrial Applications
    26. FLOATING LNG POWER VESSEL MARKET, BY REGIONAL
    27. (USD BILLION)
      1. North America
        1. US
        2. Canada
      2. Europe
        1. Germany
        2. UK
        3. France
    28. Russia
      1. Italy
        1. Spain
        2. Rest of Europe
      2. APAC
        1. China
        2. India
        3. Japan
    29. South Korea
      1. Malaysia
        1. Thailand
        2. Indonesia
        3. Rest of APAC
      2. South America
        1. Brazil
    30. Mexico
      1. Argentina
        1. Rest of South America
      2. MEA
        1. GCC Countries
        2. South Africa
        3. Rest of MEA
    31. COMPETITIVE LANDSCAPE
      1. Overview
    32. Competitive Analysis
      1. Market share Analysis
      2. Major Growth
    33. Strategy in the Floating LNG Power Vessel Market
      1. Competitive Benchmarking
      2. Leading Players in Terms of Number of Developments in the Floating LNG
    34. Power Vessel Market
      1. Key developments and growth strategies
    35. New Product Launch/Service Deployment
      1. Merger & Acquisitions
        1. Joint Ventures
      2. Major Players Financial Matrix
    36. Sales and Operating Income
      1. Major Players R&D Expenditure. 2023
    37. COMPANY PROFILES
      1. Shell
        1. Financial Overview
        2. Products Offered
        3. Key Developments
        4. SWOT Analysis
        5. Key Strategies
      2. General Electric
        1. Financial
    38. Overview
      1. Products Offered
        1. Key Developments
    39. SWOT Analysis
      1. Key Strategies
      2. Excelerate Energy
    40. Financial Overview
      1. Products Offered
        1. Key Developments
        2. SWOT Analysis
        3. Key Strategies
      2. Siemens
        1. Financial Overview
        2. Products Offered
        3. Key Developments
        4. SWOT Analysis
        5. Key Strategies
      3. DNV GL
        1. Financial Overview
        2. Products Offered
        3. Key Developments
        4. SWOT Analysis
        5. Key Strategies
      4. Black and Veatch
        1. Financial Overview
        2. Products Offered
        3. Key
    41. Developments
      1. SWOT Analysis
        1. Key Strategies
    42. Sempra Energy
      1. Financial Overview
        1. Products Offered
        2. Key Developments
        3. SWOT Analysis
        4. Key Strategies
      2. TotalEnergies
        1. Financial Overview
        2. Products
    43. Offered
      1. Key Developments
        1. SWOT Analysis
    44. Key Strategies
      1. Golar LNG
        1. Financial Overview
    45. Products Offered
      1. Key Developments
        1. SWOT Analysis
        2. Key Strategies
      2. Marubeni Corporation
        1. Financial
    46. Overview
      1. Products Offered
        1. Key Developments
    47. SWOT Analysis
      1. Key Strategies
      2. Bumi Armada
    48. Financial Overview
      1. Products Offered
        1. Key Developments
        2. SWOT Analysis
        3. Key Strategies
      2. TenneT
        1. Financial Overview
        2. Products Offered
        3. Key
    49. Developments
      1. SWOT Analysis
        1. Key Strategies
    50. Mitsubishi Corporation
      1. Financial Overview
        1. Products
    51. Offered
      1. Key Developments
        1. SWOT Analysis
    52. Key Strategies
      1. Wärtsilä
        1. Financial Overview
        2. Products Offered
        3. Key Developments
        4. SWOT
    53. Analysis
      1. Key Strategies
      2. KBR
        1. Financial
    54. Overview
      1. Products Offered
        1. Key Developments
    55. SWOT Analysis
      1. Key Strategies
    56. APPENDIX
      1. References
      2. Related Reports
    57. FORECAST, BY APPLICATION, 2019-2032 (USD BILLIONS)
    58. FLOATING LNG POWER VESSEL MARKET SIZE ESTIMATES & FORECAST, BY POWER OUTPUT,
    59. 2032 (USD BILLIONS)
    60. MARKET SIZE ESTIMATES & FORECAST, BY VESSEL TYPE, 2019-2032 (USD BILLIONS)
    61. BY END USE, 2019-2032 (USD BILLIONS)
    62. VESSEL MARKET SIZE ESTIMATES & FORECAST, BY REGIONAL, 2019-2032 (USD BILLIONS)
    63. BY APPLICATION, 2019-2032 (USD BILLIONS)
    64. MARKET SIZE ESTIMATES & FORECAST, BY POWER OUTPUT, 2019-2032 (USD BILLIONS)
    65. BY VESSEL TYPE, 2019-2032 (USD BILLIONS)
    66. MARKET SIZE ESTIMATES & FORECAST, BY END USE, 2019-2032 (USD BILLIONS)
    67. US FLOATING LNG POWER VESSEL MARKET SIZE ESTIMATES & FORECAST, BY REGIONAL,
    68. 2032 (USD BILLIONS)
    69. SIZE ESTIMATES & FORECAST, BY APPLICATION, 2019-2032 (USD BILLIONS)
    70. CANADA FLOATING LNG POWER VESSEL MARKET SIZE ESTIMATES & FORECAST, BY POWER
    71. OUTPUT, 2019-2032 (USD BILLIONS)
    72. MARKET SIZE ESTIMATES & FORECAST, BY VESSEL TYPE, 2019-2032 (USD BILLIONS)
    73. BY END USE, 2019-2032 (USD BILLIONS)
    74. MARKET SIZE ESTIMATES & FORECAST, BY REGIONAL, 2019-2032 (USD BILLIONS)
    75. BY APPLICATION, 2019-2032 (USD BILLIONS)
    76. VESSEL MARKET SIZE ESTIMATES & FORECAST, BY POWER OUTPUT, 2019-2032 (USD BILLIONS)
    77. BY VESSEL TYPE, 2019-2032 (USD BILLIONS)
    78. VESSEL MARKET SIZE ESTIMATES & FORECAST, BY END USE, 2019-2032 (USD BILLIONS)
    79. BY REGIONAL, 2019-2032 (USD BILLIONS)
    80. VESSEL MARKET SIZE ESTIMATES & FORECAST, BY APPLICATION, 2019-2032 (USD BILLIONS)
    81. BY POWER OUTPUT, 2019-2032 (USD BILLIONS)
    82. VESSEL MARKET SIZE ESTIMATES & FORECAST, BY VESSEL TYPE, 2019-2032 (USD BILLIONS)
    83. BY END USE, 2019-2032 (USD BILLIONS)
    84. VESSEL MARKET SIZE ESTIMATES & FORECAST, BY REGIONAL, 2019-2032 (USD BILLIONS)
    85. BY APPLICATION, 2019-2032 (USD BILLIONS)
    86. MARKET SIZE ESTIMATES & FORECAST, BY POWER OUTPUT, 2019-2032 (USD BILLIONS)
    87. BY VESSEL TYPE, 2019-2032 (USD BILLIONS)
    88. MARKET SIZE ESTIMATES & FORECAST, BY END USE, 2019-2032 (USD BILLIONS)
    89. UK FLOATING LNG POWER VESSEL MARKET SIZE ESTIMATES & FORECAST, BY REGIONAL,
    90. 2032 (USD BILLIONS)
    91. SIZE ESTIMATES & FORECAST, BY APPLICATION, 2019-2032 (USD BILLIONS)
    92. FRANCE FLOATING LNG POWER VESSEL MARKET SIZE ESTIMATES & FORECAST, BY POWER
    93. OUTPUT, 2019-2032 (USD BILLIONS)
    94. MARKET SIZE ESTIMATES & FORECAST, BY VESSEL TYPE, 2019-2032 (USD BILLIONS)
    95. BY END USE, 2019-2032 (USD BILLIONS)
    96. MARKET SIZE ESTIMATES & FORECAST, BY REGIONAL, 2019-2032 (USD BILLIONS)
    97. BY APPLICATION, 2019-2032 (USD BILLIONS)
    98. VESSEL MARKET SIZE ESTIMATES & FORECAST, BY POWER OUTPUT, 2019-2032 (USD BILLIONS)
    99. BY VESSEL TYPE, 2019-2032 (USD BILLIONS)
    100. VESSEL MARKET SIZE ESTIMATES & FORECAST, BY END USE, 2019-2032 (USD BILLIONS)
    101. BY REGIONAL, 2019-2032 (USD BILLIONS)
    102. MARKET SIZE ESTIMATES & FORECAST, BY APPLICATION, 2019-2032 (USD BILLIONS)
    103. BY POWER OUTPUT, 2019-2032 (USD BILLIONS)
    104. VESSEL MARKET SIZE ESTIMATES & FORECAST, BY VESSEL TYPE, 2019-2032 (USD BILLIONS)
    105. BY END USE, 2019-2032 (USD BILLIONS)
    106. MARKET SIZE ESTIMATES & FORECAST, BY REGIONAL, 2019-2032 (USD BILLIONS)
    107. BY APPLICATION, 2019-2032 (USD BILLIONS)
    108. VESSEL MARKET SIZE ESTIMATES & FORECAST, BY POWER OUTPUT, 2019-2032 (USD BILLIONS)
    109. BY VESSEL TYPE, 2019-2032 (USD BILLIONS)
    110. VESSEL MARKET SIZE ESTIMATES & FORECAST, BY END USE, 2019-2032 (USD BILLIONS)
    111. BY REGIONAL, 2019-2032 (USD BILLIONS)
    112. POWER VESSEL MARKET SIZE ESTIMATES & FORECAST, BY APPLICATION, 2019-2032 (USD
    113. BILLIONS)
    114. & FORECAST, BY POWER OUTPUT, 2019-2032 (USD BILLIONS)
    115. EUROPE FLOATING LNG POWER VESSEL MARKET SIZE ESTIMATES & FORECAST, BY VESSEL
    116. TYPE, 2019-2032 (USD BILLIONS)
    117. VESSEL MARKET SIZE ESTIMATES & FORECAST, BY END USE, 2019-2032 (USD BILLIONS)
    118. FORECAST, BY REGIONAL, 2019-2032 (USD BILLIONS)
    119. POWER VESSEL MARKET SIZE ESTIMATES & FORECAST, BY APPLICATION, 2019-2032 (USD
    120. BILLIONS)
    121. FORECAST, BY POWER OUTPUT, 2019-2032 (USD BILLIONS)
    122. LNG POWER VESSEL MARKET SIZE ESTIMATES & FORECAST, BY VESSEL TYPE, 2019-2032
    123. (USD BILLIONS)
    124. & FORECAST, BY END USE, 2019-2032 (USD BILLIONS)
    125. LNG POWER VESSEL MARKET SIZE ESTIMATES & FORECAST, BY REGIONAL, 2019-2032 (USD
    126. BILLIONS)
    127. & FORECAST, BY APPLICATION, 2019-2032 (USD BILLIONS)
    128. LNG POWER VESSEL MARKET SIZE ESTIMATES & FORECAST, BY POWER OUTPUT, 2019-2032
    129. (USD BILLIONS)
    130. & FORECAST, BY VESSEL TYPE, 2019-2032 (USD BILLIONS)
    131. LNG POWER VESSEL MARKET SIZE ESTIMATES & FORECAST, BY END USE, 2019-2032 (USD
    132. BILLIONS)
    133. & FORECAST, BY REGIONAL, 2019-2032 (USD BILLIONS)
    134. LNG POWER VESSEL MARKET SIZE ESTIMATES & FORECAST, BY APPLICATION, 2019-2032
    135. (USD BILLIONS)
    136. & FORECAST, BY POWER OUTPUT, 2019-2032 (USD BILLIONS)
    137. FLOATING LNG POWER VESSEL MARKET SIZE ESTIMATES & FORECAST, BY VESSEL TYPE,
    138. 2032 (USD BILLIONS)
    139. SIZE ESTIMATES & FORECAST, BY END USE, 2019-2032 (USD BILLIONS)
    140. INDIA FLOATING LNG POWER VESSEL MARKET SIZE ESTIMATES & FORECAST, BY REGIONAL,
    141. 2032 (USD BILLIONS)
    142. SIZE ESTIMATES & FORECAST, BY APPLICATION, 2019-2032 (USD BILLIONS)
    143. JAPAN FLOATING LNG POWER VESSEL MARKET SIZE ESTIMATES & FORECAST, BY POWER
    144. OUTPUT, 2019-2032 (USD BILLIONS)
    145. MARKET SIZE ESTIMATES & FORECAST, BY VESSEL TYPE, 2019-2032 (USD BILLIONS)
    146. BY END USE, 2019-2032 (USD BILLIONS)
    147. MARKET SIZE ESTIMATES & FORECAST, BY REGIONAL, 2019-2032 (USD BILLIONS)
    148. BY APPLICATION, 2019-2032 (USD BILLIONS)
    149. POWER VESSEL MARKET SIZE ESTIMATES & FORECAST, BY POWER OUTPUT, 2019-2032 (USD
    150. BILLIONS)
    151. & FORECAST, BY VESSEL TYPE, 2019-2032 (USD BILLIONS)
    152. FLOATING LNG POWER VESSEL MARKET SIZE ESTIMATES & FORECAST, BY END USE, 2019-2032
    153. (USD BILLIONS)
    154. ESTIMATES & FORECAST, BY REGIONAL, 2019-2032 (USD BILLIONS)
    155. MALAYSIA FLOATING LNG POWER VESSEL MARKET SIZE ESTIMATES & FORECAST, BY APPLICATION,
    156. 2032 (USD BILLIONS)
    157. SIZE ESTIMATES & FORECAST, BY POWER OUTPUT, 2019-2032 (USD BILLIONS)
    158. MALAYSIA FLOATING LNG POWER VESSEL MARKET SIZE ESTIMATES & FORECAST, BY
    159. VESSEL TYPE, 2019-2032 (USD BILLIONS)
    160. VESSEL MARKET SIZE ESTIMATES & FORECAST, BY END USE, 2019-2032 (USD BILLIONS)
    161. BY REGIONAL, 2019-2032 (USD BILLIONS)
    162. VESSEL MARKET SIZE ESTIMATES & FORECAST, BY APPLICATION, 2019-2032 (USD BILLIONS)
    163. BY POWER OUTPUT, 2019-2032 (USD BILLIONS)
    164. POWER VESSEL MARKET SIZE ESTIMATES & FORECAST, BY VESSEL TYPE, 2019-2032 (USD
    165. BILLIONS)
    166. & FORECAST, BY END USE, 2019-2032 (USD BILLIONS)
    167. LNG POWER VESSEL MARKET SIZE ESTIMATES & FORECAST, BY REGIONAL, 2019-2032 (USD
    168. BILLIONS)
    169. & FORECAST, BY APPLICATION, 2019-2032 (USD BILLIONS)
    170. FLOATING LNG POWER VESSEL MARKET SIZE ESTIMATES & FORECAST, BY POWER OUTPUT,
    171. 2032 (USD BILLIONS)
    172. SIZE ESTIMATES & FORECAST, BY VESSEL TYPE, 2019-2032 (USD BILLIONS)
    173. INDONESIA FLOATING LNG POWER VESSEL MARKET SIZE ESTIMATES & FORECAST, BY
    174. END USE, 2019-2032 (USD BILLIONS)
    175. MARKET SIZE ESTIMATES & FORECAST, BY REGIONAL, 2019-2032 (USD BILLIONS)
    176. BY APPLICATION, 2019-2032 (USD BILLIONS)
    177. POWER VESSEL MARKET SIZE ESTIMATES & FORECAST, BY POWER OUTPUT, 2019-2032 (USD
    178. BILLIONS)
    179. & FORECAST, BY VESSEL TYPE, 2019-2032 (USD BILLIONS)
    180. APAC FLOATING LNG POWER VESSEL MARKET SIZE ESTIMATES & FORECAST, BY END USE,
    181. 2032 (USD BILLIONS)
    182. MARKET SIZE ESTIMATES & FORECAST, BY REGIONAL, 2019-2032 (USD BILLIONS)
    183. FORECAST, BY APPLICATION, 2019-2032 (USD BILLIONS)
    184. FLOATING LNG POWER VESSEL MARKET SIZE ESTIMATES & FORECAST, BY POWER OUTPUT,
    185. 2032 (USD BILLIONS)
    186. MARKET SIZE ESTIMATES & FORECAST, BY VESSEL TYPE, 2019-2032 (USD BILLIONS)
    187. FORECAST, BY END USE, 2019-2032 (USD BILLIONS)
    188. LNG POWER VESSEL MARKET SIZE ESTIMATES & FORECAST, BY REGIONAL, 2019-2032 (USD
    189. BILLIONS)
    190. & FORECAST, BY APPLICATION, 2019-2032 (USD BILLIONS)
    191. FLOATING LNG POWER VESSEL MARKET SIZE ESTIMATES & FORECAST, BY POWER OUTPUT,
    192. 2032 (USD BILLIONS)
    193. SIZE ESTIMATES & FORECAST, BY VESSEL TYPE, 2019-2032 (USD BILLIONS)
    194. BRAZIL FLOATING LNG POWER VESSEL MARKET SIZE ESTIMATES & FORECAST, BY END
    195. USE, 2019-2032 (USD BILLIONS)
    196. MARKET SIZE ESTIMATES & FORECAST, BY REGIONAL, 2019-2032 (USD BILLIONS)
    197. BY APPLICATION, 2019-2032 (USD BILLIONS)
    198. VESSEL MARKET SIZE ESTIMATES & FORECAST, BY POWER OUTPUT, 2019-2032 (USD BILLIONS)
    199. BY VESSEL TYPE, 2019-2032 (USD BILLIONS)
    200. VESSEL MARKET SIZE ESTIMATES & FORECAST, BY END USE, 2019-2032 (USD BILLIONS)
    201. BY REGIONAL, 2019-2032 (USD BILLIONS)
    202. VESSEL MARKET SIZE ESTIMATES & FORECAST, BY APPLICATION, 2019-2032 (USD BILLIONS)
    203. FORECAST, BY POWER OUTPUT, 2019-2032 (USD BILLIONS)
    204. LNG POWER VESSEL MARKET SIZE ESTIMATES & FORECAST, BY VESSEL TYPE, 2019-2032
    205. (USD BILLIONS)
    206. ESTIMATES & FORECAST, BY END USE, 2019-2032 (USD BILLIONS)
    207. ARGENTINA FLOATING LNG POWER VESSEL MARKET SIZE ESTIMATES & FORECAST, BY REGIONAL,
    208. 2032 (USD BILLIONS)
    209. VESSEL MARKET SIZE ESTIMATES & FORECAST, BY APPLICATION, 2019-2032 (USD BILLIONS)
    210. & FORECAST, BY POWER OUTPUT, 2019-2032 (USD BILLIONS)
    211. OF SOUTH AMERICA FLOATING LNG POWER VESSEL MARKET SIZE ESTIMATES & FORECAST,
    212. BY VESSEL TYPE, 2019-2032 (USD BILLIONS)
    213. FLOATING LNG POWER VESSEL MARKET SIZE ESTIMATES & FORECAST, BY END USE, 2019-2032
    214. (USD BILLIONS)
    215. MARKET SIZE ESTIMATES & FORECAST, BY REGIONAL, 2019-2032 (USD BILLIONS)
    216. BY APPLICATION, 2019-2032 (USD BILLIONS)
    217. VESSEL MARKET SIZE ESTIMATES & FORECAST, BY POWER OUTPUT, 2019-2032 (USD BILLIONS)
    218. BY VESSEL TYPE, 2019-2032 (USD BILLIONS)
    219. VESSEL MARKET SIZE ESTIMATES & FORECAST, BY END USE, 2019-2032 (USD BILLIONS)
    220. BY REGIONAL, 2019-2032 (USD BILLIONS)
    221. POWER VESSEL MARKET SIZE ESTIMATES & FORECAST, BY APPLICATION, 2019-2032 (USD
    222. BILLIONS)
    223. & FORECAST, BY POWER OUTPUT, 2019-2032 (USD BILLIONS)
    224. FLOATING LNG POWER VESSEL MARKET SIZE ESTIMATES & FORECAST, BY VESSEL TYPE,
    225. 2032 (USD BILLIONS)
    226. MARKET SIZE ESTIMATES & FORECAST, BY END USE, 2019-2032 (USD BILLIONS)
    227. GCC COUNTRIES FLOATING LNG POWER VESSEL MARKET SIZE ESTIMATES & FORECAST,
    228. BY REGIONAL, 2019-2032 (USD BILLIONS)
    229. POWER VESSEL MARKET SIZE ESTIMATES & FORECAST, BY APPLICATION, 2019-2032 (USD
    230. BILLIONS)
    231. & FORECAST, BY POWER OUTPUT, 2019-2032 (USD BILLIONS)
    232. AFRICA FLOATING LNG POWER VESSEL MARKET SIZE ESTIMATES & FORECAST, BY VESSEL
    233. TYPE, 2019-2032 (USD BILLIONS)
    234. VESSEL MARKET SIZE ESTIMATES & FORECAST, BY END USE, 2019-2032 (USD BILLIONS)
    235. FORECAST, BY REGIONAL, 2019-2032 (USD BILLIONS)
    236. LNG POWER VESSEL MARKET SIZE ESTIMATES & FORECAST, BY APPLICATION, 2019-2032
    237. (USD BILLIONS)
    238. ESTIMATES & FORECAST, BY POWER OUTPUT, 2019-2032 (USD BILLIONS)
    239. REST OF MEA FLOATING LNG POWER VESSEL MARKET SIZE ESTIMATES & FORECAST,
    240. BY VESSEL TYPE, 2019-2032 (USD BILLIONS)
    241. POWER VESSEL MARKET SIZE ESTIMATES & FORECAST, BY END USE, 2019-2032 (USD BILLIONS)
    242. FORECAST, BY REGIONAL, 2019-2032 (USD BILLIONS)
    243. DEVELOPMENT/APPROVAL
    244. LNG POWER VESSEL MARKET ANALYSIS
    245. ANALYSIS BY APPLICATION
    246. BY POWER OUTPUT
    247. VESSEL TYPE
    248. USE
    249. CANADA FLOATING LNG POWER VESSEL MARKET ANALYSIS BY REGIONAL
    250. EUROPE FLOATING LNG POWER VESSEL MARKET ANALYSIS
    251. LNG POWER VESSEL MARKET ANALYSIS BY APPLICATION
    252. LNG POWER VESSEL MARKET ANALYSIS BY POWER OUTPUT
    253. LNG POWER VESSEL MARKET ANALYSIS BY VESSEL TYPE
    254. LNG POWER VESSEL MARKET ANALYSIS BY END USE
    255. POWER VESSEL MARKET ANALYSIS BY REGIONAL
    256. VESSEL MARKET ANALYSIS BY APPLICATION
    257. MARKET ANALYSIS BY POWER OUTPUT
    258. ANALYSIS BY VESSEL TYPE
    259. BY END USE
    260. RUSSIA FLOATING LNG POWER VESSEL MARKET ANALYSIS BY APPLICATION
    261. RUSSIA FLOATING LNG POWER VESSEL MARKET ANALYSIS BY POWER OUTPUT
    262. RUSSIA FLOATING LNG POWER VESSEL MARKET ANALYSIS BY VESSEL TYPE
    263. RUSSIA FLOATING LNG POWER VESSEL MARKET ANALYSIS BY END USE
    264. RUSSIA FLOATING LNG POWER VESSEL MARKET ANALYSIS BY REGIONAL
    265. FLOATING LNG POWER VESSEL MARKET ANALYSIS BY APPLICATION
    266. FLOATING LNG POWER VESSEL MARKET ANALYSIS BY POWER OUTPUT
    267. FLOATING LNG POWER VESSEL MARKET ANALYSIS BY VESSEL TYPE
    268. FLOATING LNG POWER VESSEL MARKET ANALYSIS BY END USE
    269. LNG POWER VESSEL MARKET ANALYSIS BY REGIONAL
    270. POWER VESSEL MARKET ANALYSIS BY APPLICATION
    271. POWER VESSEL MARKET ANALYSIS BY POWER OUTPUT
    272. POWER VESSEL MARKET ANALYSIS BY VESSEL TYPE
    273. POWER VESSEL MARKET ANALYSIS BY END USE
    274. VESSEL MARKET ANALYSIS BY REGIONAL
    275. POWER VESSEL MARKET ANALYSIS BY APPLICATION
    276. LNG POWER VESSEL MARKET ANALYSIS BY POWER OUTPUT
    277. FLOATING LNG POWER VESSEL MARKET ANALYSIS BY VESSEL TYPE
    278. EUROPE FLOATING LNG POWER VESSEL MARKET ANALYSIS BY END USE
    279. OF EUROPE FLOATING LNG POWER VESSEL MARKET ANALYSIS BY REGIONAL
    280. APAC FLOATING LNG POWER VESSEL MARKET ANALYSIS
    281. POWER VESSEL MARKET ANALYSIS BY APPLICATION
    282. POWER VESSEL MARKET ANALYSIS BY POWER OUTPUT
    283. POWER VESSEL MARKET ANALYSIS BY VESSEL TYPE
    284. POWER VESSEL MARKET ANALYSIS BY END USE
    285. VESSEL MARKET ANALYSIS BY REGIONAL
    286. MARKET ANALYSIS BY APPLICATION
    287. MARKET ANALYSIS BY POWER OUTPUT
    288. MARKET ANALYSIS BY VESSEL TYPE
    289. MARKET ANALYSIS BY END USE
    290. ANALYSIS BY REGIONAL
    291. BY APPLICATION
    292. BY POWER OUTPUT
    293. BY VESSEL TYPE
    294. BY END USE
    295. OUTPUT
    296. VESSEL TYPE
    297. BY END USE
    298. BY REGIONAL
    299. BY APPLICATION
    300. BY POWER OUTPUT
    301. BY VESSEL TYPE
    302. BY END USE
    303. REGIONAL
    304. APPLICATION
    305. BY POWER OUTPUT
    306. BY VESSEL TYPE
    307. BY END USE
    308. REGIONAL
    309. APPLICATION
    310. BY POWER OUTPUT
    311. BY VESSEL TYPE
    312. BY END USE
    313. BY REGIONAL
    314. BY APPLICATION
    315. BY POWER OUTPUT
    316. BY VESSEL TYPE
    317. BY END USE
    318. BY REGIONAL
    319. MEXICO FLOATING LNG POWER VESSEL MARKET ANALYSIS BY APPLICATION
    320. MEXICO FLOATING LNG POWER VESSEL MARKET ANALYSIS BY POWER OUTPUT
    321. MEXICO FLOATING LNG POWER VESSEL MARKET ANALYSIS BY VESSEL TYPE
    322. MEXICO FLOATING LNG POWER VESSEL MARKET ANALYSIS BY END USE
    323. MEXICO FLOATING LNG POWER VESSEL MARKET ANALYSIS BY REGIONAL
    324. FLOATING LNG POWER VESSEL MARKET ANALYSIS BY APPLICATION
    325. FLOATING LNG POWER VESSEL MARKET ANALYSIS BY POWER OUTPUT
    326. FLOATING LNG POWER VESSEL MARKET ANALYSIS BY VESSEL TYPE
    327. FLOATING LNG POWER VESSEL MARKET ANALYSIS BY END USE
    328. FLOATING LNG POWER VESSEL MARKET ANALYSIS BY REGIONAL
    329. SOUTH AMERICA FLOATING LNG POWER VESSEL MARKET ANALYSIS BY APPLICATION
    330. REST OF SOUTH AMERICA FLOATING LNG POWER VESSEL MARKET ANALYSIS BY POWER OUTPUT
    331. BY VESSEL TYPE
    332. MARKET ANALYSIS BY END USE
    333. POWER VESSEL MARKET ANALYSIS BY REGIONAL
    334. VESSEL MARKET ANALYSIS
    335. MARKET ANALYSIS BY APPLICATION
    336. VESSEL MARKET ANALYSIS BY POWER OUTPUT
    337. LNG POWER VESSEL MARKET ANALYSIS BY VESSEL TYPE
    338. FLOATING LNG POWER VESSEL MARKET ANALYSIS BY END USE
    339. FLOATING LNG POWER VESSEL MARKET ANALYSIS BY REGIONAL
    340. FLOATING LNG POWER VESSEL MARKET ANALYSIS BY APPLICATION
    341. AFRICA FLOATING LNG POWER VESSEL MARKET ANALYSIS BY POWER OUTPUT
    342. SOUTH AFRICA FLOATING LNG POWER VESSEL MARKET ANALYSIS BY VESSEL TYPE
    343. SOUTH AFRICA FLOATING LNG POWER VESSEL MARKET ANALYSIS BY END USE
    344. SOUTH AFRICA FLOATING LNG POWER VESSEL MARKET ANALYSIS BY REGIONAL
    345. REST OF MEA FLOATING LNG POWER VESSEL MARKET ANALYSIS BY APPLICATION
    346. REST OF MEA FLOATING LNG POWER VESSEL MARKET ANALYSIS BY POWER OUTPUT
    347. REST OF MEA FLOATING LNG POWER VESSEL MARKET ANALYSIS BY VESSEL TYPE
    348. REST OF MEA FLOATING LNG POWER VESSEL MARKET ANALYSIS BY END USE
    349. REST OF MEA FLOATING LNG POWER VESSEL MARKET ANALYSIS BY REGIONAL
    350. KEY BUYING CRITERIA OF FLOATING LNG POWER VESSEL MARKET
    351. PROCESS OF MRFR
    352. SUPPLY / VALUE CHAIN: FLOATING LNG POWER VESSEL MARKET
    353. LNG POWER VESSEL MARKET, BY APPLICATION, 2024 (% SHARE)
    354. LNG POWER VESSEL MARKET, BY APPLICATION, 2019 TO 2032 (USD Billions)
    355. FLOATING LNG POWER VESSEL MARKET, BY POWER OUTPUT, 2024 (% SHARE)
    356. FLOATING LNG POWER VESSEL MARKET, BY POWER OUTPUT, 2019 TO 2032 (USD Billions)
    357. (USD Billions)
    358. (% SHARE)
    359. (USD Billions)
    360. (% SHARE)
    361. TO 2032 (USD Billions)

    Floating LNG Power Vessel Market Segmentation

    • Floating LNG Power Vessel Market By Application (USD Billion, 2019-2032)

      • Power Generation
      • Desalination
      • Gas Processing
    • Floating LNG Power Vessel Market By Power Output (USD Billion, 2019-2032)

      • Less than 100 MW
      • 100 MW to 300 MW
      • Above 300 MW

    • Floating LNG Power Vessel Market By Vessel Type (USD Billion, 2019-2032)

      • Floating Storage Regasification Unit
      • Floating Storage Unit
      • Floating Power Unit

    • Floating LNG Power Vessel Market By End Use (USD Billion, 2019-2032)

      • Coastal Regions
      • Isolated Areas
      • Industrial Applications

    • Floating LNG Power Vessel Market By Regional (USD Billion, 2019-2032)

      • North America
      • Europe
      • South America
      • Asia Pacific
      • Middle East and Africa

    Floating LNG Power Vessel Market Regional Outlook (USD Billion, 2019-2032)


    • North America Outlook (USD Billion, 2019-2032)

      • North America Floating LNG Power Vessel Market by Application Type

        • Power Generation
        • Desalination
        • Gas Processing
      • North America Floating LNG Power Vessel Market by Power Output Type

        • Less than 100 MW
        • 100 MW to 300 MW
        • Above 300 MW
      • North America Floating LNG Power Vessel Market by Vessel Type

        • Floating Storage Regasification Unit
        • Floating Storage Unit
        • Floating Power Unit
      • North America Floating LNG Power Vessel Market by End Use Type

        • Coastal Regions
        • Isolated Areas
        • Industrial Applications
      • North America Floating LNG Power Vessel Market by Regional Type

        • US
        • Canada
      • US Outlook (USD Billion, 2019-2032)
      • US Floating LNG Power Vessel Market by Application Type

        • Power Generation
        • Desalination
        • Gas Processing
      • US Floating LNG Power Vessel Market by Power Output Type

        • Less than 100 MW
        • 100 MW to 300 MW
        • Above 300 MW
      • US Floating LNG Power Vessel Market by Vessel Type

        • Floating Storage Regasification Unit
        • Floating Storage Unit
        • Floating Power Unit
      • US Floating LNG Power Vessel Market by End Use Type

        • Coastal Regions
        • Isolated Areas
        • Industrial Applications
      • CANADA Outlook (USD Billion, 2019-2032)
      • CANADA Floating LNG Power Vessel Market by Application Type

        • Power Generation
        • Desalination
        • Gas Processing
      • CANADA Floating LNG Power Vessel Market by Power Output Type

        • Less than 100 MW
        • 100 MW to 300 MW
        • Above 300 MW
      • CANADA Floating LNG Power Vessel Market by Vessel Type

        • Floating Storage Regasification Unit
        • Floating Storage Unit
        • Floating Power Unit
      • CANADA Floating LNG Power Vessel Market by End Use Type

        • Coastal Regions
        • Isolated Areas
        • Industrial Applications
    • Europe Outlook (USD Billion, 2019-2032)

      • Europe Floating LNG Power Vessel Market by Application Type

        • Power Generation
        • Desalination
        • Gas Processing
      • Europe Floating LNG Power Vessel Market by Power Output Type

        • Less than 100 MW
        • 100 MW to 300 MW
        • Above 300 MW
      • Europe Floating LNG Power Vessel Market by Vessel Type

        • Floating Storage Regasification Unit
        • Floating Storage Unit
        • Floating Power Unit
      • Europe Floating LNG Power Vessel Market by End Use Type

        • Coastal Regions
        • Isolated Areas
        • Industrial Applications
      • Europe Floating LNG Power Vessel Market by Regional Type

        • Germany
        • UK
        • France
        • Russia
        • Italy
        • Spain
        • Rest of Europe
      • GERMANY Outlook (USD Billion, 2019-2032)
      • GERMANY Floating LNG Power Vessel Market by Application Type

        • Power Generation
        • Desalination
        • Gas Processing
      • GERMANY Floating LNG Power Vessel Market by Power Output Type

        • Less than 100 MW
        • 100 MW to 300 MW
        • Above 300 MW
      • GERMANY Floating LNG Power Vessel Market by Vessel Type

        • Floating Storage Regasification Unit
        • Floating Storage Unit
        • Floating Power Unit
      • GERMANY Floating LNG Power Vessel Market by End Use Type

        • Coastal Regions
        • Isolated Areas
        • Industrial Applications
      • UK Outlook (USD Billion, 2019-2032)
      • UK Floating LNG Power Vessel Market by Application Type

        • Power Generation
        • Desalination
        • Gas Processing
      • UK Floating LNG Power Vessel Market by Power Output Type

        • Less than 100 MW
        • 100 MW to 300 MW
        • Above 300 MW
      • UK Floating LNG Power Vessel Market by Vessel Type

        • Floating Storage Regasification Unit
        • Floating Storage Unit
        • Floating Power Unit
      • UK Floating LNG Power Vessel Market by End Use Type

        • Coastal Regions
        • Isolated Areas
        • Industrial Applications
      • FRANCE Outlook (USD Billion, 2019-2032)
      • FRANCE Floating LNG Power Vessel Market by Application Type

        • Power Generation
        • Desalination
        • Gas Processing
      • FRANCE Floating LNG Power Vessel Market by Power Output Type

        • Less than 100 MW
        • 100 MW to 300 MW
        • Above 300 MW
      • FRANCE Floating LNG Power Vessel Market by Vessel Type

        • Floating Storage Regasification Unit
        • Floating Storage Unit
        • Floating Power Unit
      • FRANCE Floating LNG Power Vessel Market by End Use Type

        • Coastal Regions
        • Isolated Areas
        • Industrial Applications
      • RUSSIA Outlook (USD Billion, 2019-2032)
      • RUSSIA Floating LNG Power Vessel Market by Application Type

        • Power Generation
        • Desalination
        • Gas Processing
      • RUSSIA Floating LNG Power Vessel Market by Power Output Type

        • Less than 100 MW
        • 100 MW to 300 MW
        • Above 300 MW
      • RUSSIA Floating LNG Power Vessel Market by Vessel Type

        • Floating Storage Regasification Unit
        • Floating Storage Unit
        • Floating Power Unit
      • RUSSIA Floating LNG Power Vessel Market by End Use Type

        • Coastal Regions
        • Isolated Areas
        • Industrial Applications
      • ITALY Outlook (USD Billion, 2019-2032)
      • ITALY Floating LNG Power Vessel Market by Application Type

        • Power Generation
        • Desalination
        • Gas Processing
      • ITALY Floating LNG Power Vessel Market by Power Output Type

        • Less than 100 MW
        • 100 MW to 300 MW
        • Above 300 MW
      • ITALY Floating LNG Power Vessel Market by Vessel Type

        • Floating Storage Regasification Unit
        • Floating Storage Unit
        • Floating Power Unit
      • ITALY Floating LNG Power Vessel Market by End Use Type

        • Coastal Regions
        • Isolated Areas
        • Industrial Applications
      • SPAIN Outlook (USD Billion, 2019-2032)
      • SPAIN Floating LNG Power Vessel Market by Application Type

        • Power Generation
        • Desalination
        • Gas Processing
      • SPAIN Floating LNG Power Vessel Market by Power Output Type

        • Less than 100 MW
        • 100 MW to 300 MW
        • Above 300 MW
      • SPAIN Floating LNG Power Vessel Market by Vessel Type

        • Floating Storage Regasification Unit
        • Floating Storage Unit
        • Floating Power Unit
      • SPAIN Floating LNG Power Vessel Market by End Use Type

        • Coastal Regions
        • Isolated Areas
        • Industrial Applications
      • REST OF EUROPE Outlook (USD Billion, 2019-2032)
      • REST OF EUROPE Floating LNG Power Vessel Market by Application Type

        • Power Generation
        • Desalination
        • Gas Processing
      • REST OF EUROPE Floating LNG Power Vessel Market by Power Output Type

        • Less than 100 MW
        • 100 MW to 300 MW
        • Above 300 MW
      • REST OF EUROPE Floating LNG Power Vessel Market by Vessel Type

        • Floating Storage Regasification Unit
        • Floating Storage Unit
        • Floating Power Unit
      • REST OF EUROPE Floating LNG Power Vessel Market by End Use Type

        • Coastal Regions
        • Isolated Areas
        • Industrial Applications
    • APAC Outlook (USD Billion, 2019-2032)

      • APAC Floating LNG Power Vessel Market by Application Type

        • Power Generation
        • Desalination
        • Gas Processing
      • APAC Floating LNG Power Vessel Market by Power Output Type

        • Less than 100 MW
        • 100 MW to 300 MW
        • Above 300 MW
      • APAC Floating LNG Power Vessel Market by Vessel Type

        • Floating Storage Regasification Unit
        • Floating Storage Unit
        • Floating Power Unit
      • APAC Floating LNG Power Vessel Market by End Use Type

        • Coastal Regions
        • Isolated Areas
        • Industrial Applications
      • APAC Floating LNG Power Vessel Market by Regional Type

        • China
        • India
        • Japan
        • South Korea
        • Malaysia
        • Thailand
        • Indonesia
        • Rest of APAC
      • CHINA Outlook (USD Billion, 2019-2032)
      • CHINA Floating LNG Power Vessel Market by Application Type

        • Power Generation
        • Desalination
        • Gas Processing
      • CHINA Floating LNG Power Vessel Market by Power Output Type

        • Less than 100 MW
        • 100 MW to 300 MW
        • Above 300 MW
      • CHINA Floating LNG Power Vessel Market by Vessel Type

        • Floating Storage Regasification Unit
        • Floating Storage Unit
        • Floating Power Unit
      • CHINA Floating LNG Power Vessel Market by End Use Type

        • Coastal Regions
        • Isolated Areas
        • Industrial Applications
      • INDIA Outlook (USD Billion, 2019-2032)
      • INDIA Floating LNG Power Vessel Market by Application Type

        • Power Generation
        • Desalination
        • Gas Processing
      • INDIA Floating LNG Power Vessel Market by Power Output Type

        • Less than 100 MW
        • 100 MW to 300 MW
        • Above 300 MW
      • INDIA Floating LNG Power Vessel Market by Vessel Type

        • Floating Storage Regasification Unit
        • Floating Storage Unit
        • Floating Power Unit
      • INDIA Floating LNG Power Vessel Market by End Use Type

        • Coastal Regions
        • Isolated Areas
        • Industrial Applications
      • JAPAN Outlook (USD Billion, 2019-2032)
      • JAPAN Floating LNG Power Vessel Market by Application Type

        • Power Generation
        • Desalination
        • Gas Processing
      • JAPAN Floating LNG Power Vessel Market by Power Output Type

        • Less than 100 MW
        • 100 MW to 300 MW
        • Above 300 MW
      • JAPAN Floating LNG Power Vessel Market by Vessel Type

        • Floating Storage Regasification Unit
        • Floating Storage Unit
        • Floating Power Unit
      • JAPAN Floating LNG Power Vessel Market by End Use Type

        • Coastal Regions
        • Isolated Areas
        • Industrial Applications
      • SOUTH KOREA Outlook (USD Billion, 2019-2032)
      • SOUTH KOREA Floating LNG Power Vessel Market by Application Type

        • Power Generation
        • Desalination
        • Gas Processing
      • SOUTH KOREA Floating LNG Power Vessel Market by Power Output Type

        • Less than 100 MW
        • 100 MW to 300 MW
        • Above 300 MW
      • SOUTH KOREA Floating LNG Power Vessel Market by Vessel Type

        • Floating Storage Regasification Unit
        • Floating Storage Unit
        • Floating Power Unit
      • SOUTH KOREA Floating LNG Power Vessel Market by End Use Type

        • Coastal Regions
        • Isolated Areas
        • Industrial Applications
      • MALAYSIA Outlook (USD Billion, 2019-2032)
      • MALAYSIA Floating LNG Power Vessel Market by Application Type

        • Power Generation
        • Desalination
        • Gas Processing
      • MALAYSIA Floating LNG Power Vessel Market by Power Output Type

        • Less than 100 MW
        • 100 MW to 300 MW
        • Above 300 MW
      • MALAYSIA Floating LNG Power Vessel Market by Vessel Type

        • Floating Storage Regasification Unit
        • Floating Storage Unit
        • Floating Power Unit
      • MALAYSIA Floating LNG Power Vessel Market by End Use Type

        • Coastal Regions
        • Isolated Areas
        • Industrial Applications
      • THAILAND Outlook (USD Billion, 2019-2032)
      • THAILAND Floating LNG Power Vessel Market by Application Type

        • Power Generation
        • Desalination
        • Gas Processing
      • THAILAND Floating LNG Power Vessel Market by Power Output Type

        • Less than 100 MW
        • 100 MW to 300 MW
        • Above 300 MW
      • THAILAND Floating LNG Power Vessel Market by Vessel Type

        • Floating Storage Regasification Unit
        • Floating Storage Unit
        • Floating Power Unit
      • THAILAND Floating LNG Power Vessel Market by End Use Type

        • Coastal Regions
        • Isolated Areas
        • Industrial Applications
      • INDONESIA Outlook (USD Billion, 2019-2032)
      • INDONESIA Floating LNG Power Vessel Market by Application Type

        • Power Generation
        • Desalination
        • Gas Processing
      • INDONESIA Floating LNG Power Vessel Market by Power Output Type

        • Less than 100 MW
        • 100 MW to 300 MW
        • Above 300 MW
      • INDONESIA Floating LNG Power Vessel Market by Vessel Type

        • Floating Storage Regasification Unit
        • Floating Storage Unit
        • Floating Power Unit
      • INDONESIA Floating LNG Power Vessel Market by End Use Type

        • Coastal Regions
        • Isolated Areas
        • Industrial Applications
      • REST OF APAC Outlook (USD Billion, 2019-2032)
      • REST OF APAC Floating LNG Power Vessel Market by Application Type

        • Power Generation
        • Desalination
        • Gas Processing
      • REST OF APAC Floating LNG Power Vessel Market by Power Output Type

        • Less than 100 MW
        • 100 MW to 300 MW
        • Above 300 MW
      • REST OF APAC Floating LNG Power Vessel Market by Vessel Type

        • Floating Storage Regasification Unit
        • Floating Storage Unit
        • Floating Power Unit
      • REST OF APAC Floating LNG Power Vessel Market by End Use Type

        • Coastal Regions
        • Isolated Areas
        • Industrial Applications
    • South America Outlook (USD Billion, 2019-2032)

      • South America Floating LNG Power Vessel Market by Application Type

        • Power Generation
        • Desalination
        • Gas Processing
      • South America Floating LNG Power Vessel Market by Power Output Type

        • Less than 100 MW
        • 100 MW to 300 MW
        • Above 300 MW
      • South America Floating LNG Power Vessel Market by Vessel Type

        • Floating Storage Regasification Unit
        • Floating Storage Unit
        • Floating Power Unit
      • South America Floating LNG Power Vessel Market by End Use Type

        • Coastal Regions
        • Isolated Areas
        • Industrial Applications
      • South America Floating LNG Power Vessel Market by Regional Type

        • Brazil
        • Mexico
        • Argentina
        • Rest of South America
      • BRAZIL Outlook (USD Billion, 2019-2032)
      • BRAZIL Floating LNG Power Vessel Market by Application Type

        • Power Generation
        • Desalination
        • Gas Processing
      • BRAZIL Floating LNG Power Vessel Market by Power Output Type

        • Less than 100 MW
        • 100 MW to 300 MW
        • Above 300 MW
      • BRAZIL Floating LNG Power Vessel Market by Vessel Type

        • Floating Storage Regasification Unit
        • Floating Storage Unit
        • Floating Power Unit
      • BRAZIL Floating LNG Power Vessel Market by End Use Type

        • Coastal Regions
        • Isolated Areas
        • Industrial Applications
      • MEXICO Outlook (USD Billion, 2019-2032)
      • MEXICO Floating LNG Power Vessel Market by Application Type

        • Power Generation
        • Desalination
        • Gas Processing
      • MEXICO Floating LNG Power Vessel Market by Power Output Type

        • Less than 100 MW
        • 100 MW to 300 MW
        • Above 300 MW
      • MEXICO Floating LNG Power Vessel Market by Vessel Type

        • Floating Storage Regasification Unit
        • Floating Storage Unit
        • Floating Power Unit
      • MEXICO Floating LNG Power Vessel Market by End Use Type

        • Coastal Regions
        • Isolated Areas
        • Industrial Applications
      • ARGENTINA Outlook (USD Billion, 2019-2032)
      • ARGENTINA Floating LNG Power Vessel Market by Application Type

        • Power Generation
        • Desalination
        • Gas Processing
      • ARGENTINA Floating LNG Power Vessel Market by Power Output Type

        • Less than 100 MW
        • 100 MW to 300 MW
        • Above 300 MW
      • ARGENTINA Floating LNG Power Vessel Market by Vessel Type

        • Floating Storage Regasification Unit
        • Floating Storage Unit
        • Floating Power Unit
      • ARGENTINA Floating LNG Power Vessel Market by End Use Type

        • Coastal Regions
        • Isolated Areas
        • Industrial Applications
      • REST OF SOUTH AMERICA Outlook (USD Billion, 2019-2032)
      • REST OF SOUTH AMERICA Floating LNG Power Vessel Market by Application Type

        • Power Generation
        • Desalination
        • Gas Processing
      • REST OF SOUTH AMERICA Floating LNG Power Vessel Market by Power Output Type

        • Less than 100 MW
        • 100 MW to 300 MW
        • Above 300 MW
      • REST OF SOUTH AMERICA Floating LNG Power Vessel Market by Vessel Type

        • Floating Storage Regasification Unit
        • Floating Storage Unit
        • Floating Power Unit
      • REST OF SOUTH AMERICA Floating LNG Power Vessel Market by End Use Type

        • Coastal Regions
        • Isolated Areas
        • Industrial Applications
    • MEA Outlook (USD Billion, 2019-2032)

      • MEA Floating LNG Power Vessel Market by Application Type

        • Power Generation
        • Desalination
        • Gas Processing
      • MEA Floating LNG Power Vessel Market by Power Output Type

        • Less than 100 MW
        • 100 MW to 300 MW
        • Above 300 MW
      • MEA Floating LNG Power Vessel Market by Vessel Type

        • Floating Storage Regasification Unit
        • Floating Storage Unit
        • Floating Power Unit
      • MEA Floating LNG Power Vessel Market by End Use Type

        • Coastal Regions
        • Isolated Areas
        • Industrial Applications
      • MEA Floating LNG Power Vessel Market by Regional Type

        • GCC Countries
        • South Africa
        • Rest of MEA
      • GCC COUNTRIES Outlook (USD Billion, 2019-2032)
      • GCC COUNTRIES Floating LNG Power Vessel Market by Application Type

        • Power Generation
        • Desalination
        • Gas Processing
      • GCC COUNTRIES Floating LNG Power Vessel Market by Power Output Type

        • Less than 100 MW
        • 100 MW to 300 MW
        • Above 300 MW
      • GCC COUNTRIES Floating LNG Power Vessel Market by Vessel Type

        • Floating Storage Regasification Unit
        • Floating Storage Unit
        • Floating Power Unit
      • GCC COUNTRIES Floating LNG Power Vessel Market by End Use Type

        • Coastal Regions
        • Isolated Areas
        • Industrial Applications
      • SOUTH AFRICA Outlook (USD Billion, 2019-2032)
      • SOUTH AFRICA Floating LNG Power Vessel Market by Application Type

        • Power Generation
        • Desalination
        • Gas Processing
      • SOUTH AFRICA Floating LNG Power Vessel Market by Power Output Type

        • Less than 100 MW
        • 100 MW to 300 MW
        • Above 300 MW
      • SOUTH AFRICA Floating LNG Power Vessel Market by Vessel Type

        • Floating Storage Regasification Unit
        • Floating Storage Unit
        • Floating Power Unit
      • SOUTH AFRICA Floating LNG Power Vessel Market by End Use Type

        • Coastal Regions
        • Isolated Areas
        • Industrial Applications
      • REST OF MEA Outlook (USD Billion, 2019-2032)
      • REST OF MEA Floating LNG Power Vessel Market by Application Type

        • Power Generation
        • Desalination
        • Gas Processing
      • REST OF MEA Floating LNG Power Vessel Market by Power Output Type

        • Less than 100 MW
        • 100 MW to 300 MW
        • Above 300 MW
      • REST OF MEA Floating LNG Power Vessel Market by Vessel Type

        • Floating Storage Regasification Unit
        • Floating Storage Unit
        • Floating Power Unit
      • REST OF MEA Floating LNG Power Vessel Market by End Use Type

        • Coastal Regions
        • Isolated Areas
        • Industrial Applications
    Floating LNG Power Vessel Market Research Report - Global Forecast till 2032 Infographic
    Free Sample Request

    Kindly complete the form below to receive a free sample of this Report

    Customer Strories

    “I am very pleased with how market segments have been defined in a relevant way for my purposes (such as "Portable Freezers & refrigerators" and "last-mile"). In general the report is well structured. Thanks very much for your efforts.”

    Victoria Milne Founder
    Case Study

    Chemicals and Materials