Market Growth Projections
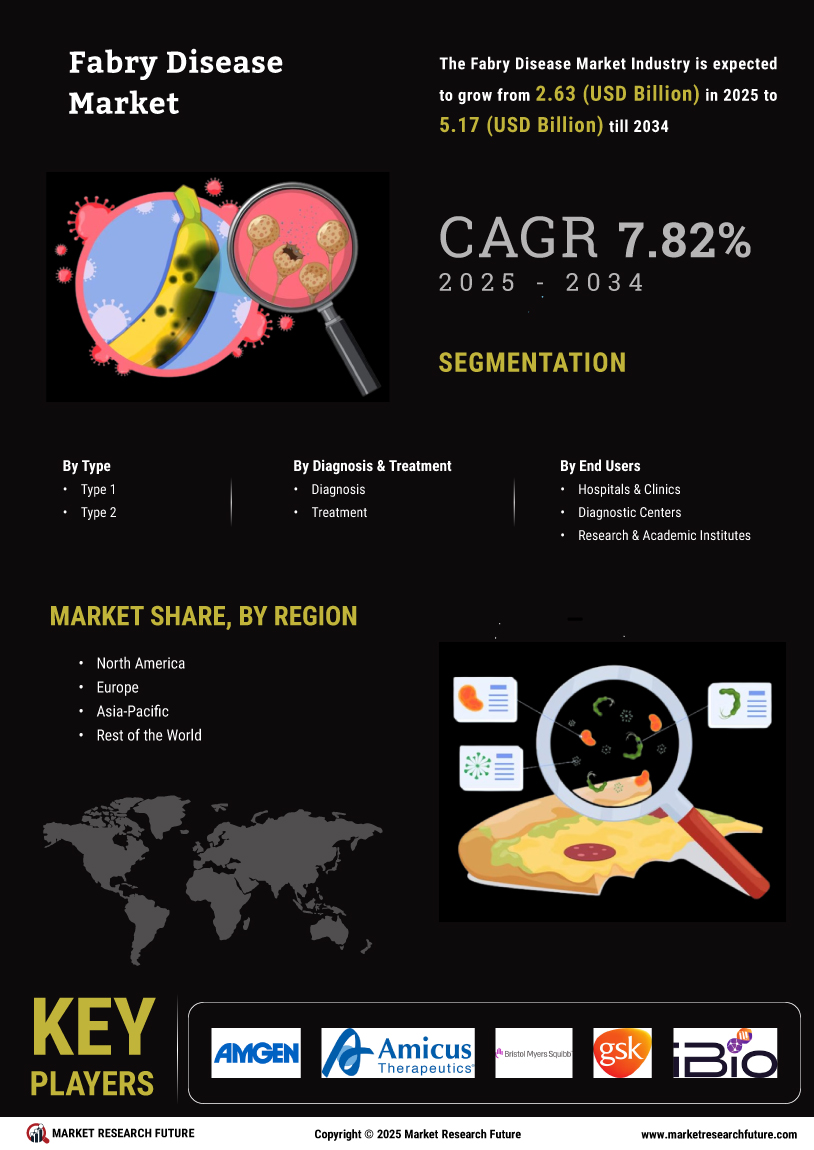
The Global Fabry Disease Market Industry is poised for substantial growth, with projections indicating a market size of 2.44 USD Billion in 2024 and an anticipated increase to 5.57 USD Billion by 2035. This growth trajectory reflects a compound annual growth rate of 7.8% from 2025 to 2035, driven by various factors including advancements in treatment options, rising awareness, and government support. The market's expansion is indicative of the ongoing efforts to address the needs of patients suffering from Fabry Disease Market, highlighting the importance of continued investment in research and development.
Government Support and Funding
Government initiatives and funding for rare diseases, including Fabry Disease Market, are essential drivers of the Global Fabry Disease Market Industry. Various countries are implementing policies to support research, development, and access to treatments for rare diseases. For example, the Orphan Drug Act in the United States provides incentives for companies to develop therapies for rare conditions. Such support not only encourages pharmaceutical companies to invest in Fabry Disease Market treatments but also ensures that patients have access to necessary therapies, thereby fostering market growth.
Advancements in Treatment Options
Innovations in treatment modalities significantly influence the Global Fabry Disease Market Industry. The introduction of enzyme replacement therapies and chaperone therapies has transformed patient management, enhancing quality of life and extending life expectancy. For instance, the approval of new therapies offers hope to patients who previously had limited options. As these treatments become more accessible, the market is expected to grow, with projections indicating a rise to 5.57 USD Billion by 2035. This growth underscores the importance of ongoing research and development in providing effective solutions for Fabry Disease Market.
Emerging Markets and Global Expansion
The expansion of healthcare infrastructure in emerging markets is a significant factor influencing the Global Fabry Disease Market Industry. Countries in Asia-Pacific and Latin America are witnessing improvements in healthcare access and diagnostic capabilities, leading to increased identification of Fabry Disease Market cases. As these regions develop, the demand for effective treatments is expected to rise, contributing to market growth. This trend aligns with the overall market trajectory, as the industry anticipates reaching 5.57 USD Billion by 2035, driven by the increasing need for therapies in these expanding markets.
Increasing Prevalence of Fabry Disease
The rising incidence of Fabry Disease Market is a critical driver for the Global Fabry Disease Market Industry. As awareness improves and diagnostic capabilities advance, more cases are being identified. It is estimated that Fabry Disease Market affects approximately 1 in 40,000 to 1 in 117,000 individuals globally. This growing patient population necessitates effective treatment options, contributing to the market's expansion. In 2024, the market is projected to reach 2.44 USD Billion, reflecting the urgent need for therapies that address the symptoms and complications associated with this rare genetic disorder.
Rising Awareness and Education Initiatives
Increased awareness and educational initiatives surrounding Fabry Disease Market play a pivotal role in driving the Global Fabry Disease Market Industry. Healthcare professionals and patients are becoming more informed about the disease, leading to earlier diagnosis and treatment. Organizations dedicated to rare diseases are actively promoting awareness campaigns, which are crucial for improving patient outcomes. This heightened awareness is likely to contribute to a compound annual growth rate of 7.8% from 2025 to 2035, as more individuals seek medical attention and treatment options become more widely recognized.